
Free swim lane diagram software
Swimlane diagram maker for cross-functional flowcharts
Write who does each step and in what order, and get a clean swimlane flowchart: one lane per role, department or system, optional phases across the lanes, decisions, documents and data stores, and hand-offs routed at right angles between lanes. Every step stays inside its own lane. Type it as short lines of text or click it together with the builder. Free, private, with SVG, PNG and PDF export.
Flowchart check: no problems found
Everything runs in your browser: nothing is uploaded, and the diagram is drawn exactly from your code. Undo with Ctrl+Z.
Step by step
How to make a swimlane diagram
Six steps that work for a lab SOP, an approval process or a class exercise in process mapping.
- 1
Fix where the process starts and ends
Name the trigger (Sample delivered, Referral received) and the result (Report released, Enrolled). Everything between them belongs on the diagram; everything outside does not.
- 2
List the lanes: roles, not people
Write one lane line per role, team or system that does part of the work: Reception, Lab technician, Principal investigator, LIMS. Order them so most arrows run between neighbouring lanes.
- 3
Write the steps in their lanes
Each step is a verb and an object (Check the request form) written after the short name of the lane that does it: Rec: step "Check the request form" as Check. Use decision for questions, start and end for the two ends.
- 4
Connect them, and label every decision exit
Join the steps in order with -->. Give each arrow out of a decision its answer: OK -->|yes| Record and OK -->|no| Contact. Arrows that go back (rework, a failed QC) are drawn around the steps automatically.
- 5
Add phases and check the hand-offs
Optional: write phase "Receipt", phase "Analysis" between the steps to split the process into stages. Then follow every arrow that crosses a lane line: each one is a hand-off, where delays and errors usually happen.
- 6
Check and export
The flowchart check under the drawing flags a decision with one way out, a step nothing leads to, or a lane with no steps. Download SVG or PDF for an SOP or a report, PNG for slides.
Templates
Swimlane diagram examples to start from
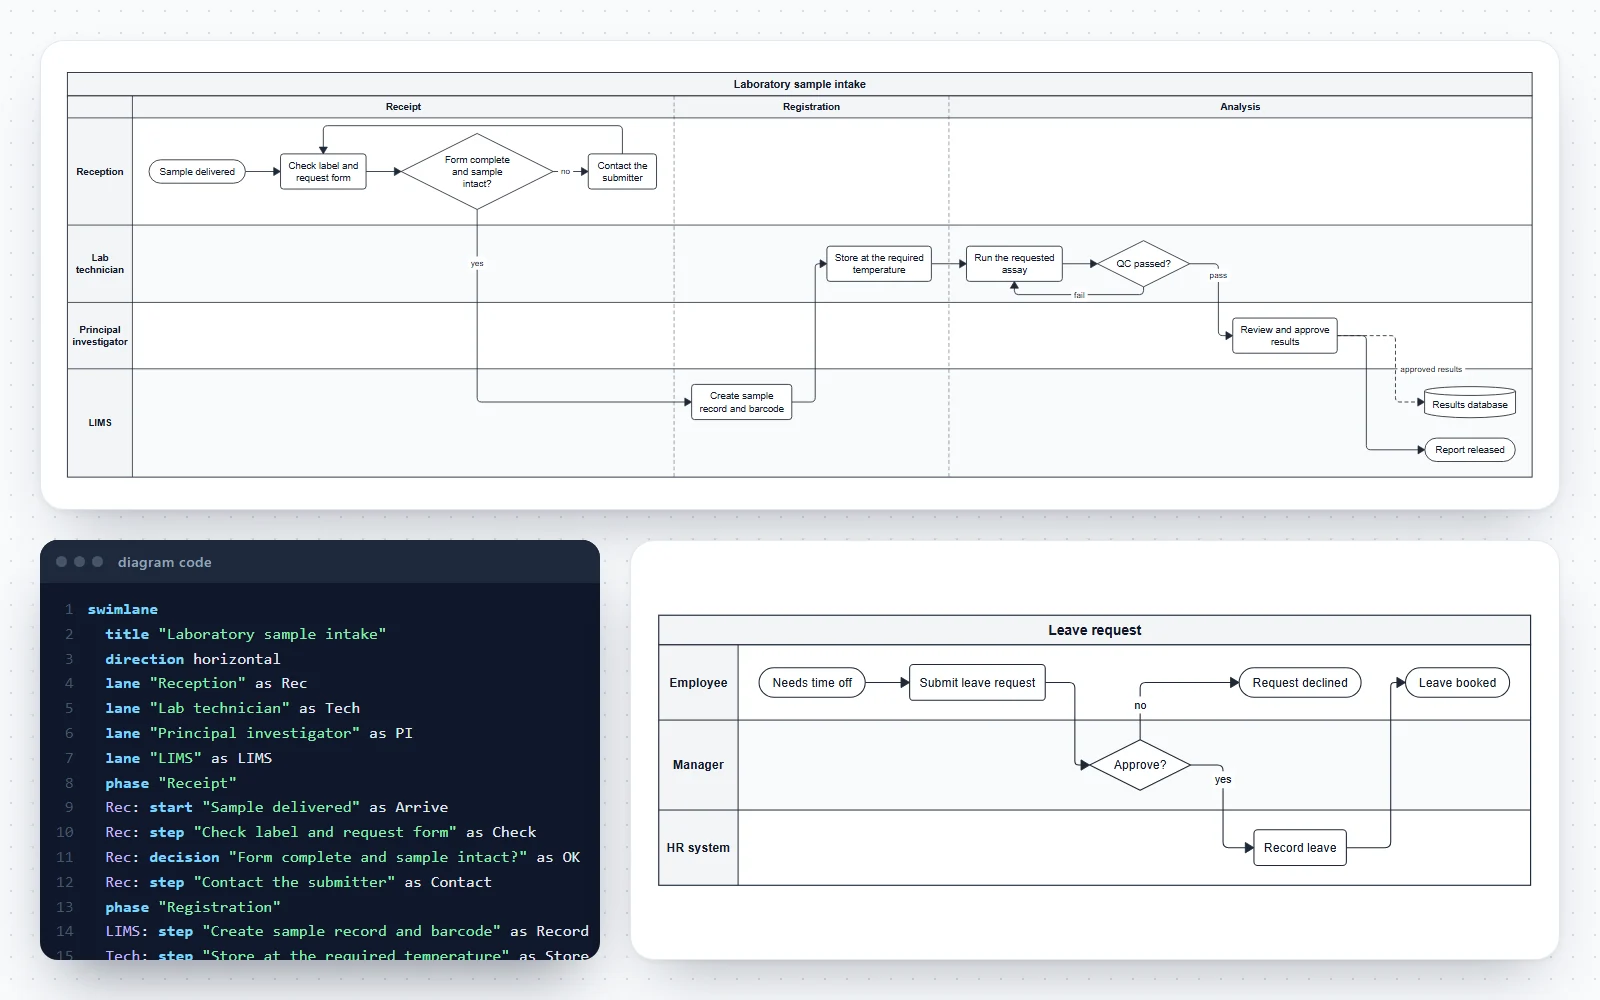
Seven complete cross-functional flowcharts, from a three-lane leave request to laboratory sample intake and journal peer review. Open one in the editor and rename the lanes and steps.
Symbols reference
Swimlane flowchart symbols and their code
The lanes, phases and flowchart shapes this tool draws, what each one means and how to write it. Add puts a working example into the laboratory sample intake diagram.
| Symbol | Element and meaning | Code in this tool |
|---|---|---|
Lane One role, team or system. Steps in it are done by that role. | lane "Lab technician" as Tech | |
Phase A stage across all lanes; the steps written after it belong to it. | phase "Reporting" | |
Start and end (terminator) Where the process begins, and where each path ends. | Rec: start "Sample delivered" as Arrive | |
Process step One task, written verb + object, in the lane that does it. | Tech: step "Run the assay" as Assay | |
Decision A question with one labelled arrow per answer. | Tech: decision "QC passed?" as QC | |
Document A form, label or report the process produces. | LIMS: document "Sample label" as Label | |
Data store A database or system record, such as the LIMS. | LIMS: data "Results database" as DB | |
Predefined process A step with its own procedure or diagram elsewhere. | PI: subprocess "Data analysis SOP" as Analysis | |
Hand-off An arrow that crosses a lane line: the work passes to another role. | Record --> Store | |
Information flow (dashed) Information or a document sent without handing over the work. | Review -.-> DB : approved results | |
Loop back (rework) An arrow to an earlier step, drawn around the boxes. | QC -->|fail| Assay |
Comparison
Swimlane diagram, flowchart, BPMN or sequence diagram?
Process diagrams overlap. The question to ask is whether the reader needs to see who does each step.
| Diagram | What it shows | Shows who does each step? | Best for |
|---|---|---|---|
| Swimlane diagram (cross-functional flowchart) | Steps in order, each in the lane of the role that does it | Yes: one lane per role, team or system | Hand-offs between roles, SOPs, onboarding, process improvement |
| Flowchart | Steps and decisions in order | No | Procedures with one owner, algorithms, decision trees |
| BPMN 2.0 process diagram | Events, tasks and gateways in pools and lanes, to a formal standard | Yes: pools for organisations, lanes for roles | Formal process documentation and process automation |
| UML activity diagram | Actions and control flow; partitions drawn as swimlanes | Yes, with activity partitions | Software and system behaviour |
| Sequence diagram | Messages between participants over time | Participants as lifelines, not steps | How systems or services interact in one scenario |
| Org chart | Who reports to whom | Roles, but no process or order | Structure of a team, lab or department |
Common mistakes
Six swim lane diagram mistakes and their fixes
Lanes named after people
WrongLanes called Maria, Dr Chen and Tom.
RightName roles or teams (Reception, Principal investigator, LIMS). The process should still be right when people change jobs.
A step owned by two lanes
WrongOne box stretched across Technician and PI, or a step drawn on the lane line.
RightEvery step has one owner. Split it (Technician prepares, PI approves) or name the role that is accountable.
Hidden hand-offs
WrongSend to the lab in the Reception lane, then the next box is already Run assay.
RightDraw the receiving step in the receiving lane (Log receipt) so every arrow across a lane line is a visible hand-off.
Decisions without labelled exits
WrongA diamond with two unlabelled arrows, or only one arrow out.
RightWrite the question in the diamond and label each exit with its answer: -->|yes| and -->|no|. The flowchart check flags any decision that is missing one.
Unhappy paths that just stop
WrongThe no arrow of Consents? leads nowhere.
RightEnd every path, including rejections and screen failures, with an end terminator that says what happens (Log as screen failure).
Ten lanes and fifty steps
WrongThe whole department’s work on one diagram.
RightKeep three to seven lanes and one level of detail. Move a detailed part into its own diagram and show it as a predefined process box.
How this swimlane diagram maker works
Write the process as short lines of text or build it from forms; the diagram is redrawn as you type and every change can be undone.
- Code tab: one statement per line (lane, phase, a step in a lane, or two steps joined by an arrow), with line numbers and plain-English messages that name the line to fix.
- Build tab: add lanes, phases, steps of every shape, decisions with their yes and no exits, and solid or dashed arrows. A step typed into an arrow that is not in the diagram yet is declared for you.
- The layout is automatic and repeatable: lanes keep their order and size, each step sits in its own lane and phase, steps that follow each other line up, and arrows are routed at right angles around the boxes instead of through them.
- Style tab: horizontal or vertical lanes, four figure styles, the text size and a compact spacing option. Seven templates, from a three-lane leave request to a journal peer review process.
- Saved in your browser as you work; nothing is uploaded and there is no account.
What is a swimlane diagram?
A swimlane diagram (also written swim lane diagram, and sometimes shortened to swim diagram) is a flowchart divided into parallel lanes, one for each person, role, team or system involved. Each step is drawn in the lane of whoever does it, so the diagram shows both the order of the work and who is responsible for each part.
- The same diagram is also called a cross-functional flowchart, a deployment flowchart or a Rummler–Brache diagram, after Geary Rummler and Alan Brache, who popularised it for mapping work across departments in Improving Performance (1990).
- Arrows that cross a lane line are hand-offs: the moment work, a sample or a document passes from one role to another. Most delays, lost samples and rework happen there, which is why swimlane maps are used for process improvement.
- Columns across the lanes can mark phases or stages (Receipt, Registration, Analysis), so the reader sees what happens in each stage and who does it.
- The idea is shared by the formal notations: BPMN 2.0 draws pools and lanes, and UML activity diagrams draw activity partitions as swimlanes.
When a swimlane flowchart is the right diagram
- Several roles or departments share one process and you need to show who does what: sample intake, purchase approval, a support ticket, onboarding.
- You are writing or auditing a standard operating procedure (SOP) and want each responsibility visible at a glance.
- A process is slow or error-prone and you want to find the hand-offs, waits and loops that cause it.
- You are explaining a workflow to new staff, a reviewer or an ethics committee who need to see where their part fits.
- For a process that one person does from start to finish, a plain flowchart is simpler; for how software components talk to each other, a sequence diagram is clearer.
Horizontal or vertical lanes?
Both are correct; choose the one that fits the page and the number of steps. The Lanes option in the Style tab switches between them without changing the code’s steps.
- Horizontal lanes (rows, the flow runs left to right) are the classic layout and suit landscape slides, wide reports and processes with phases, which then read as columns.
- Vertical lanes (columns, the flow runs top to bottom) suit portrait pages, SOP documents and long processes with many steps, because the diagram grows downwards instead of becoming very wide.
- With up to five or six lanes either works; with more lanes, horizontal rows usually stay readable longer.
Lanes, pools and phases
- A lane is one role, team or system. Write lane "Lab technician" as Tech; the short name after as is what step lines use.
- In BPMN 2.0 a pool stands for a whole participant (an organisation) and lanes divide it into roles. This tool draws one pool with its lanes, which is what most swimlane diagrams need; give an outside organisation its own lane (Supplier, Funding agency) and connect it with dashed arrows for what it sends.
- A phase (or stage) is a column across all lanes: write phase "Analysis" and the steps that follow it belong to that phase. Phases are drawn in order, separated by dashed lines, and a step never sits outside its phase.
- Lanes without steps are still drawn, so you can plan the roles first; the flowchart check reminds you to fill them.
Swimlane flowchart symbols
The shapes are the standard flowchart symbols (ISO 5807), placed inside lanes. Keep to a few of them: most good swimlane diagrams use only process boxes, decisions and the two terminators.
- Terminator (rounded box): where the process starts and where each path ends.
- Process (rectangle): one task, written verb + object. Decision (diamond): a yes / no or multiple-choice question with a labelled arrow for each answer.
- Document (wavy bottom): a form, report or label that is produced. Data store (cylinder): a database or system record such as a LIMS entry.
- Predefined process (rectangle with double sides): a step that has its own procedure or diagram elsewhere, such as Peer review or Data analysis SOP.
- Solid arrows move the work on; dashed arrows show information or a document sent to another lane without handing over the work.
Swimlane diagrams in the lab and in clinical research
- Sample intake and chain of custody: who receives, checks, registers, stores and analyses a sample, and where it waits. The laboratory template shows the completeness check and the QC rerun loop.
- Clinical trial enrolment: coordinator, participant, investigator and the randomisation system. Good Clinical Practice requires written informed consent before a participant takes part in a trial, so in the template the consent step comes before the screening visit.
- Journal submission and peer review: author, editorial office, handling editor and reviewers, with the revise-and-resubmit loop that authors often underestimate.
- Grant proposals and purchasing: the internal review loops and approval thresholds that decide how early a proposal or an order must start.
- For recruitment numbers rather than responsibilities, a CONSORT flow diagram is the reporting standard; a swimlane map is the operational view of the same process.
Tips for a swim lane diagram people can read
- Three to seven lanes. More than that usually means the diagram covers two processes; split it and link them with a predefined process box.
- One step, one owner. If two roles do a step together, either name the role that is accountable or split the step into two.
- Write every step as verb + object, and every decision as a question. Avoid steps called Process or Handle.
- Label every arrow out of a decision, and end every path with an end terminator, including the unhappy ones (Rejected, Screen failure).
- Keep one level of detail. Clicks and form fields belong in the SOP text; the diagram shows the steps and hand-offs.
Exporting for SOPs, reports and slides
- SVG and PDF are vector files with real, editable text: sharp at any size in Word, PowerPoint, Illustrator, Inkscape or a LaTeX document.
- PNG at 2× (or 4× from More) for slides, wikis and electronic lab notebooks.
- Wide horizontal diagrams fit a landscape page; long processes fit a portrait page better as vertical lanes. Compact spacing saves about a quarter of the size.
- The code is plain text: download it with the diagram so the process map can be updated when the procedure changes.
Frequently asked questions
Is this swimlane diagram maker free?
Yes. Drawing, the templates and every export (SVG, PNG and PDF) are free, with no account and no watermark. The diagram is drawn in your browser and saved there; nothing is uploaded.
What is a swimlane diagram?
A swimlane diagram, or swim lane diagram, is a flowchart split into lanes, one for each role, team or system. Each step sits in the lane of whoever does it, so the diagram shows the order of the work and who is responsible for every step. It is also called a cross-functional flowchart, a deployment flowchart or a Rummler–Brache diagram.
How do I make a swimlane diagram online?
Open a template or start blank, write one lane line per role, then write each step after the short name of its lane (Tech: step "Run the assay" as Assay) and join the steps with -->. Label the arrows out of each decision, add phases if the process has stages, and download the result as SVG, PNG or PDF. The Build tab does the same with forms.
What is the difference between a swimlane diagram and a flowchart?
A flowchart shows the steps and decisions in order. A swimlane diagram is a flowchart with lanes added, so it also shows who does each step and where the work passes from one role to another. Use a plain flowchart when one person or one program does everything.
What is a cross-functional flowchart?
It is another name for a swimlane diagram: a flowchart whose lanes are the functions (departments, roles or systems) involved in a process. Office drawing programs often use this name for their swimlane template.
Should the lanes be horizontal or vertical?
Horizontal lanes with the flow running left to right are the classic layout and fit landscape slides and processes with phases. Vertical lanes with the flow running down suit portrait pages and long processes. Switch between them with the Lanes option; the steps and arrows stay the same.
What are phases in a swimlane diagram?
Phases (or stages, or milestones) are columns across all lanes that split the process into periods such as Receipt, Registration and Analysis. Write phase "Name" and the steps after it belong to that phase; each phase gets a header and a dashed separator.
Which symbols does a swimlane flowchart use?
The standard flowchart symbols: rounded terminators for start and end, rectangles for process steps, diamonds for decisions, a wavy-bottomed shape for documents, a cylinder for a database and a double-sided rectangle for a predefined process. Arrows connect them; this tool draws information flows as dashed arrows.
How do I show a hand-off between departments?
Draw an arrow from the last step in one lane to the first step in the next role’s lane. Every arrow that crosses a lane line is a hand-off. If information or a document goes across without handing over the work, use a dashed arrow (A -.-> B).
What is the difference between a pool and a lane?
In BPMN 2.0 a pool represents a whole participant, usually an organisation, and lanes subdivide a pool into roles or departments. Work flows within a pool; between pools only messages pass. This tool draws one pool with its lanes; give an outside organisation (a supplier, a funder) its own lane and show what it sends with dashed arrows.
How many lanes should a swimlane diagram have?
Usually three to seven. Fewer than three and a plain flowchart may do; more than seven and the diagram tends to mix several processes. Split a large process into smaller diagrams and link them with a predefined process step.
Can I use it for a lab SOP or a clinical trial process?
Yes. The templates include laboratory sample intake (reception, technician, PI and LIMS), clinical trial enrolment, journal peer review and a grant proposal. They are illustrative: adapt the steps to your own procedure and approvals.
Does it work with Visio, Lucidchart or BPMN tools?
It does not import or export their file formats. The SVG export opens in Visio, PowerPoint, Illustrator and Inkscape as editable shapes and text, and the code is plain text you can keep with your SOP and paste back here to edit. It draws swimlane flowcharts, not executable BPMN models.
Which file format should I use for a report, a thesis or slides?
SVG or PDF for reports and theses: they are vector files with real text, sharp at any size. PNG at 2× or 4× for slides and web pages.
Related diagram tools
Flowchart Maker
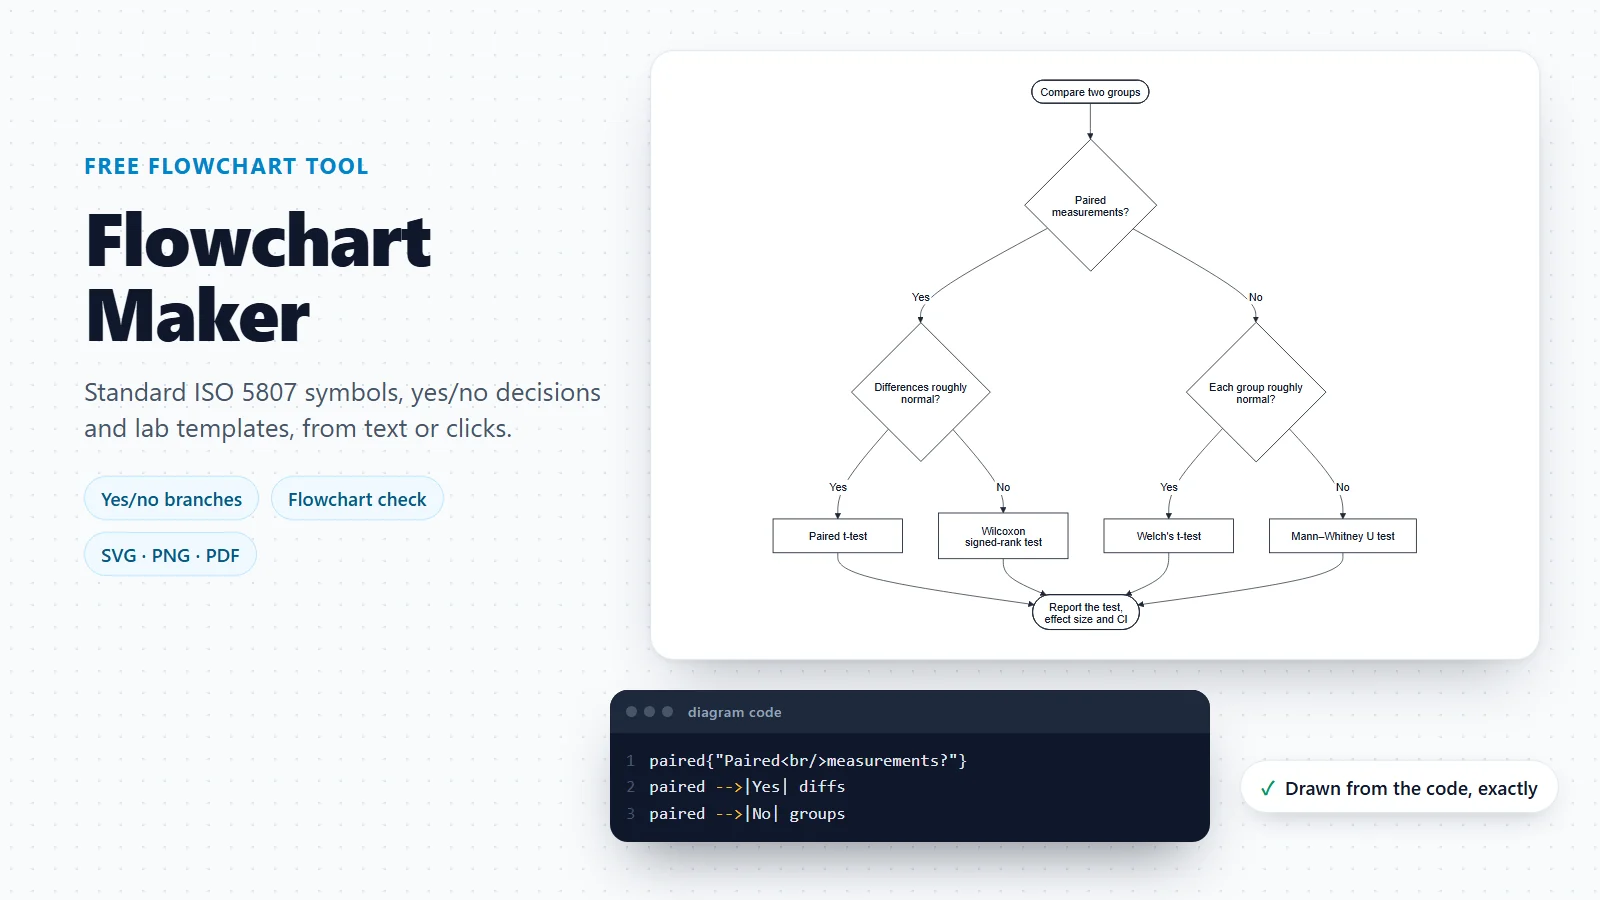
Steps, decisions and loops without lanes, for procedures that one person or one program carries out.
Workflow Diagram Generator
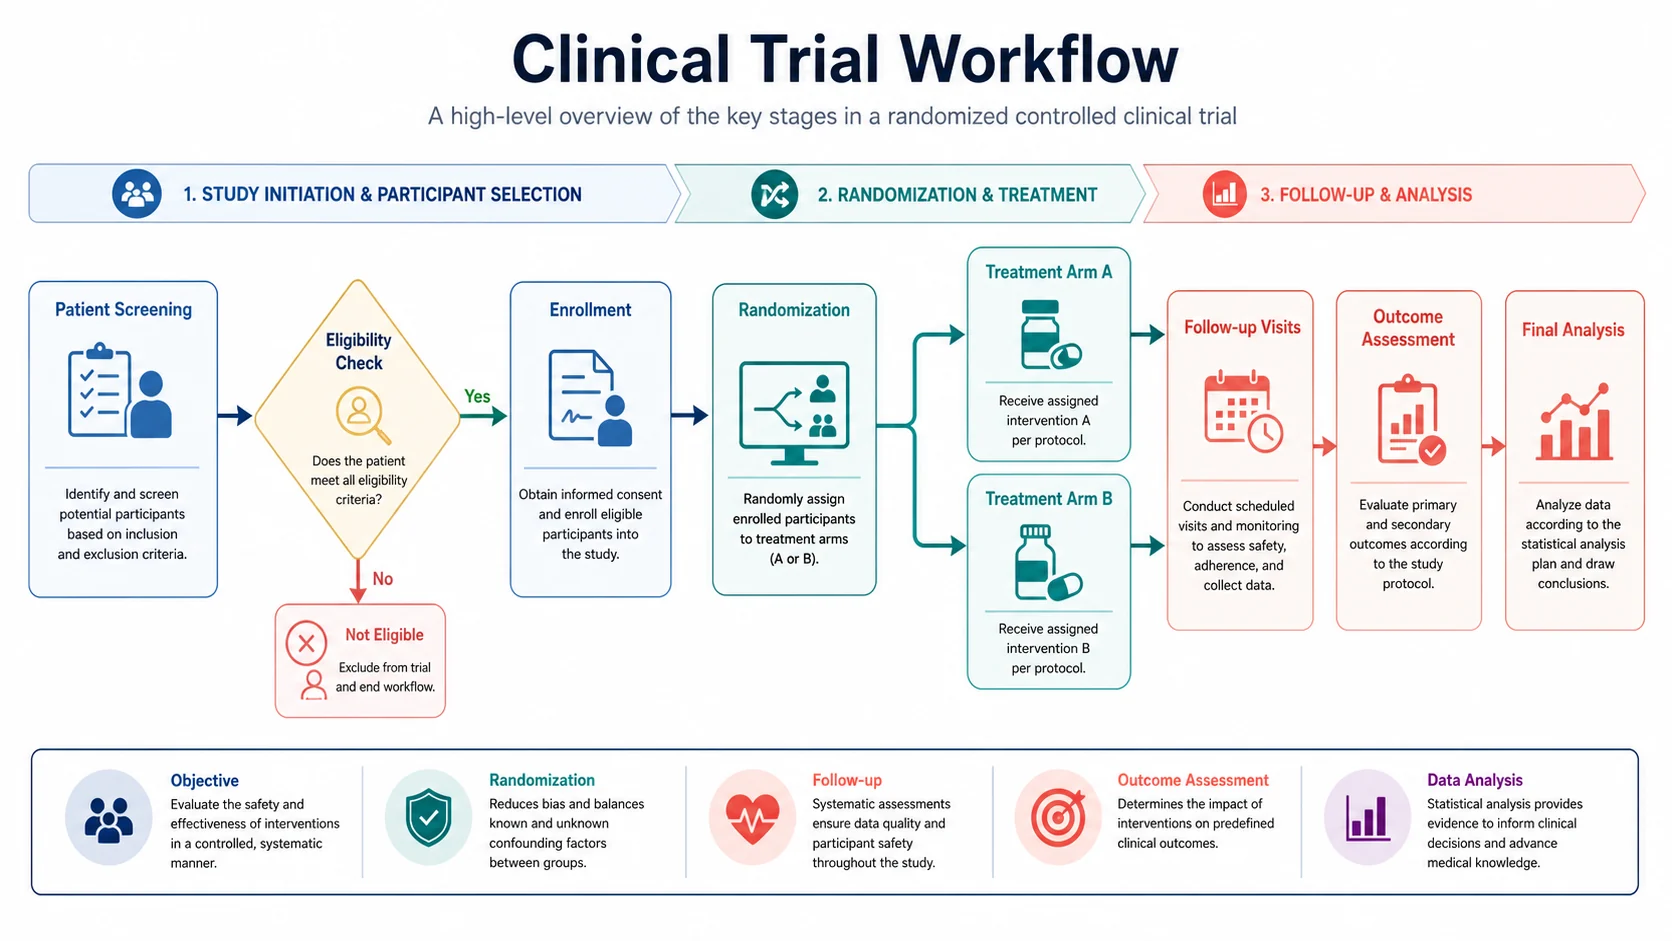
Describe a research or lab workflow in words and get an illustrated workflow figure.
Use Case Diagram Generator
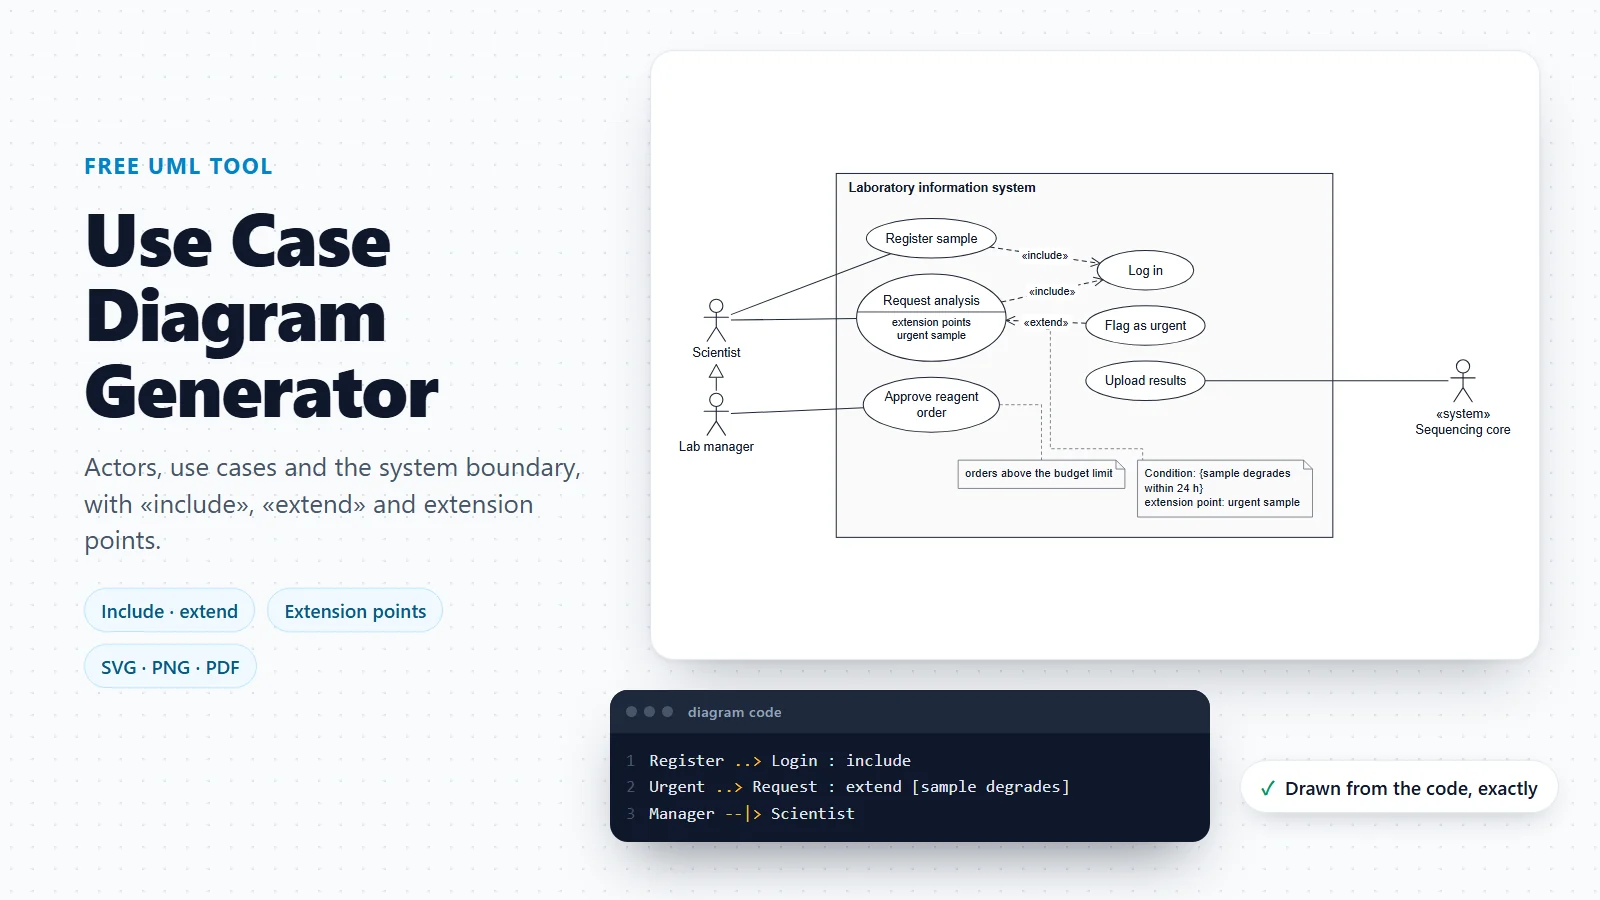
The roles that use a system and the goals they reach with it, in UML notation.
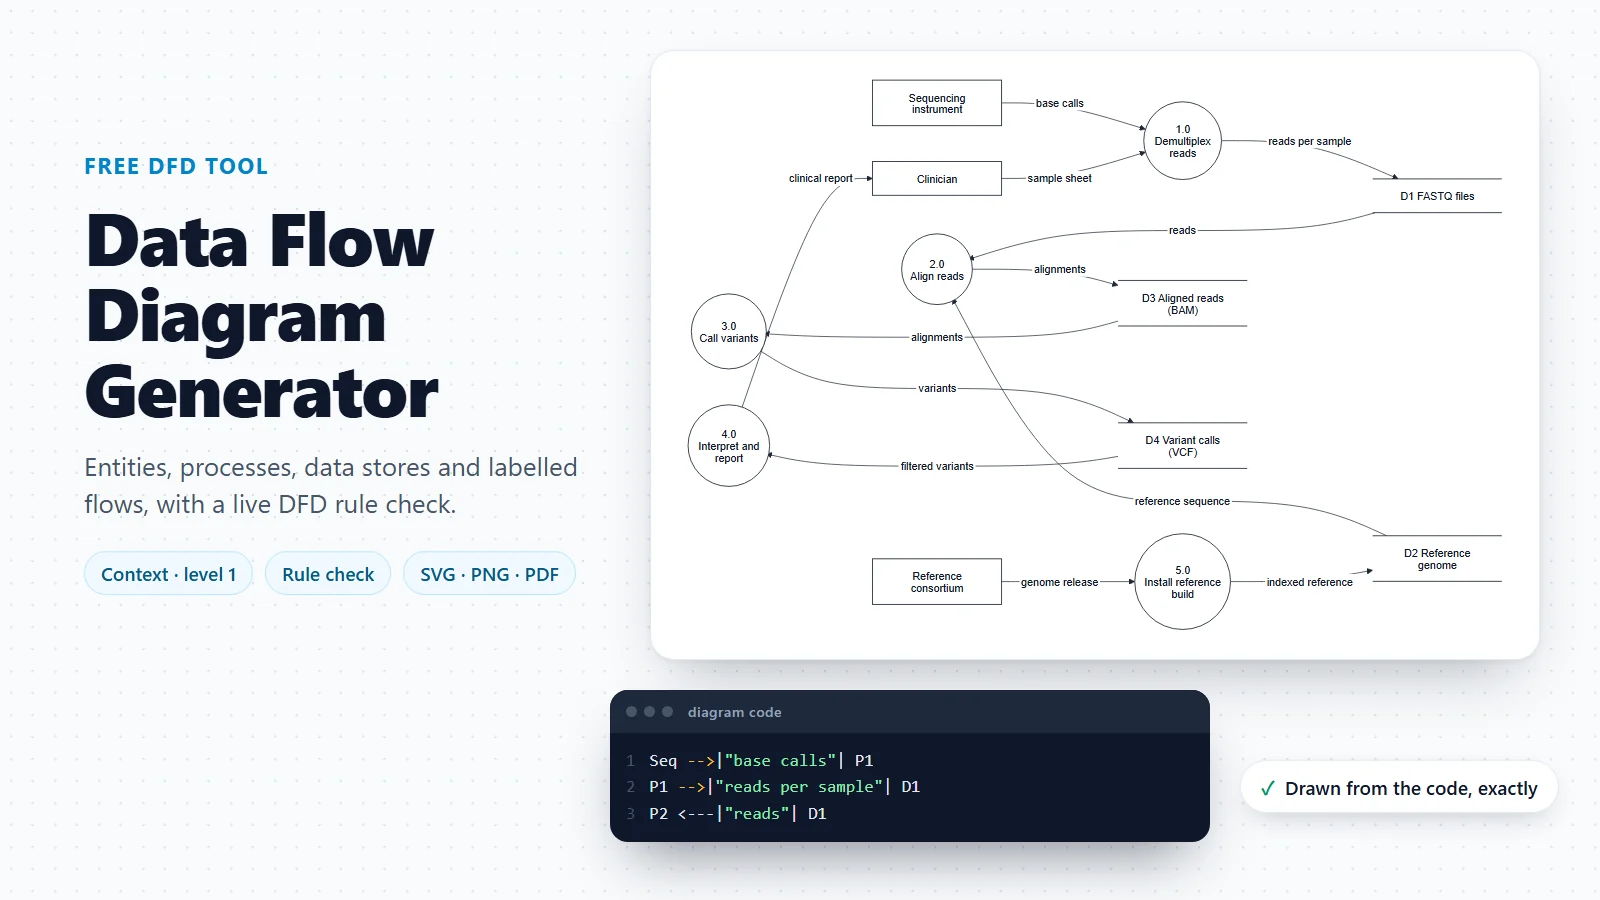
Data Flow Diagram Generator
How data moves between people, processes and data stores in the same process.
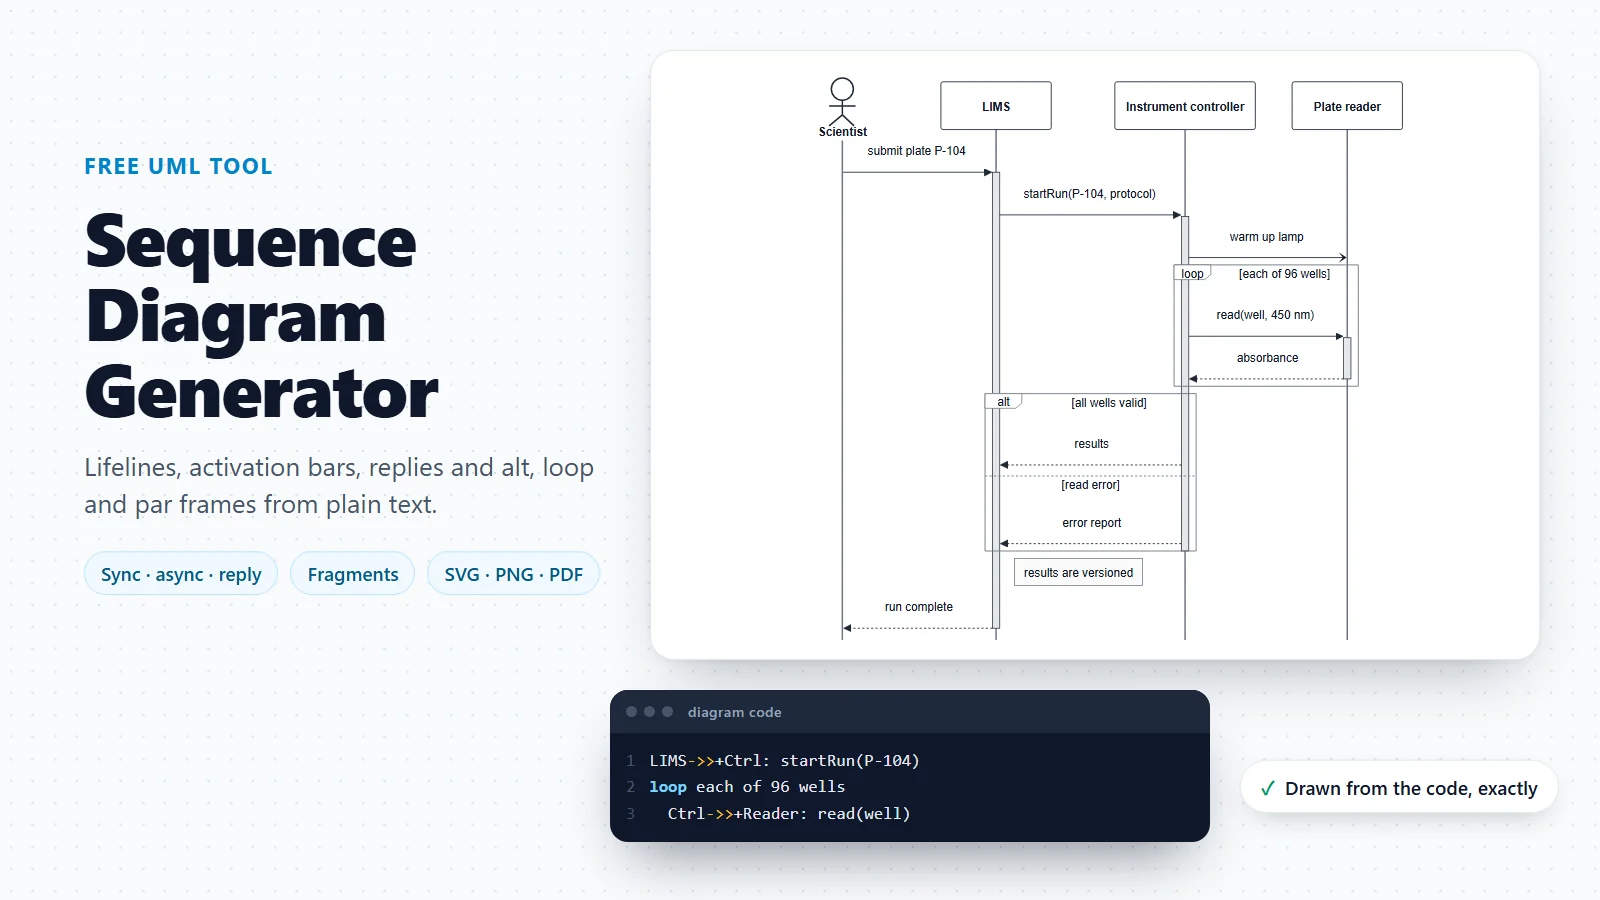
Sequence Diagram Generator
One scenario as messages between participants, in time order.
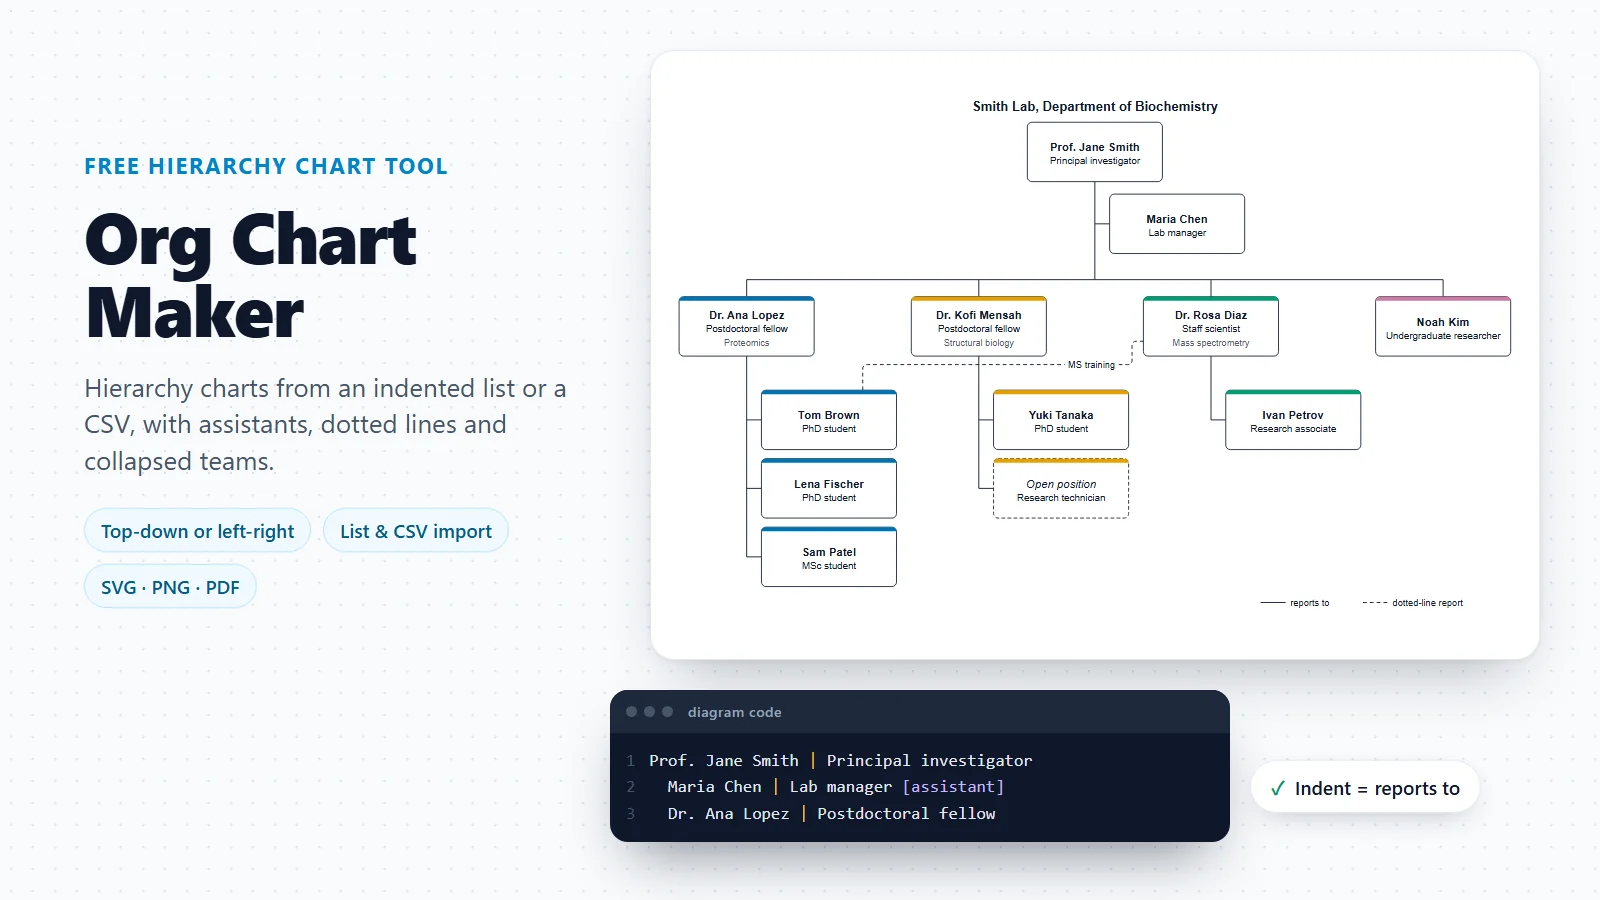
Org Chart Maker
Who reports to whom in the lab, department or team whose roles fill the lanes.
Want the workflow drawn as an illustrated figure?
A swimlane diagram is the operational map of a process. For a paper, a poster or a graphical abstract, the workflow diagram generator turns a description of the same process into an illustrated figure.
Open the workflow diagram generatorLast checked: November 17, 2026. Sources: Object Management Group, Business Process Model and Notation (BPMN) 2.0.2 (January 2014): pools and lanes; ISO 5807:1985, Documentation symbols and conventions for data, program and system flowcharts; Object Management Group, UML 2.5.1 specification, clause 15 Activities (activity partitions drawn as swimlanes); Rummler and Brache, Improving Performance: How to Manage the White Space on the Organization Chart (Jossey-Bass, 1990); ICH E6 Good Clinical Practice guideline: informed consent of trial subjects. The laboratory, clinical, publishing and business templates are illustrative processes, not the procedures of any real organisation.