
Free printable hundreds chart maker
Hundreds chart maker for blank, fill-in and patterned 100s grids
Build a hundreds chart in seconds: 1 to 100, 0 to 99, a 120 chart, a hundredths grid or any range you type. Leave numbers out for students to fill in, shade skip-counting patterns, or cut the chart into puzzle pieces, and every worksheet comes with its answer key. Fit up to six charts on a Letter or A4 page and download a crisp vector PDF, a PNG or an SVG.
Free, with no sign-up. Everything runs in your browser, and your last chart is kept on this device only. Undo with Ctrl+Z.
Worked example
Finding the primes to 100 with the Sieve of Eratosthenes
The sieve is the classic grade 4 hundreds chart activity. Cross out 1, which is neither prime nor composite. Then circle the first number that is still uncrossed and cross out every multiple of it. Repeat. You can stop once the next circled number squared is past 100: here that number is 11, and 11 × 11 = 121, so every composite number to 100 has already been crossed out by a smaller prime.
| Step | Numbers crossed out for the first time | How many | Still uncrossed |
|---|---|---|---|
| Cross out 1 | 1 | 1 | 99 |
| Circle 2 | 4, 6, 8, 10, 12, 14 … 100 | 49 | 50 |
| Circle 3 | 9, 15, 21, 27, 33, 39 … 99 | 16 | 34 |
| Circle 5 | 25, 35, 55, 65, 85, 95 | 6 | 28 |
| Circle 7 | 49, 77, 91 | 3 | 25 |
What is left are the 25 primes below 100: 2, 3, 5, 7, 11, 13, 17, 19, 23, 29, 31, 37, 41, 43, 47, 53, 59, 61, 67, 71, 73, 79, 83, 89, 97. On the chart they make a striking picture: apart from 2 and 5, every one sits in a column ending in 1, 3, 7 or 9, because any larger number ending in an even digit or 5 is a multiple of 2 or 5. The multiples of 2 alone fill five whole columns, which is why that first step crosses out almost half the chart.
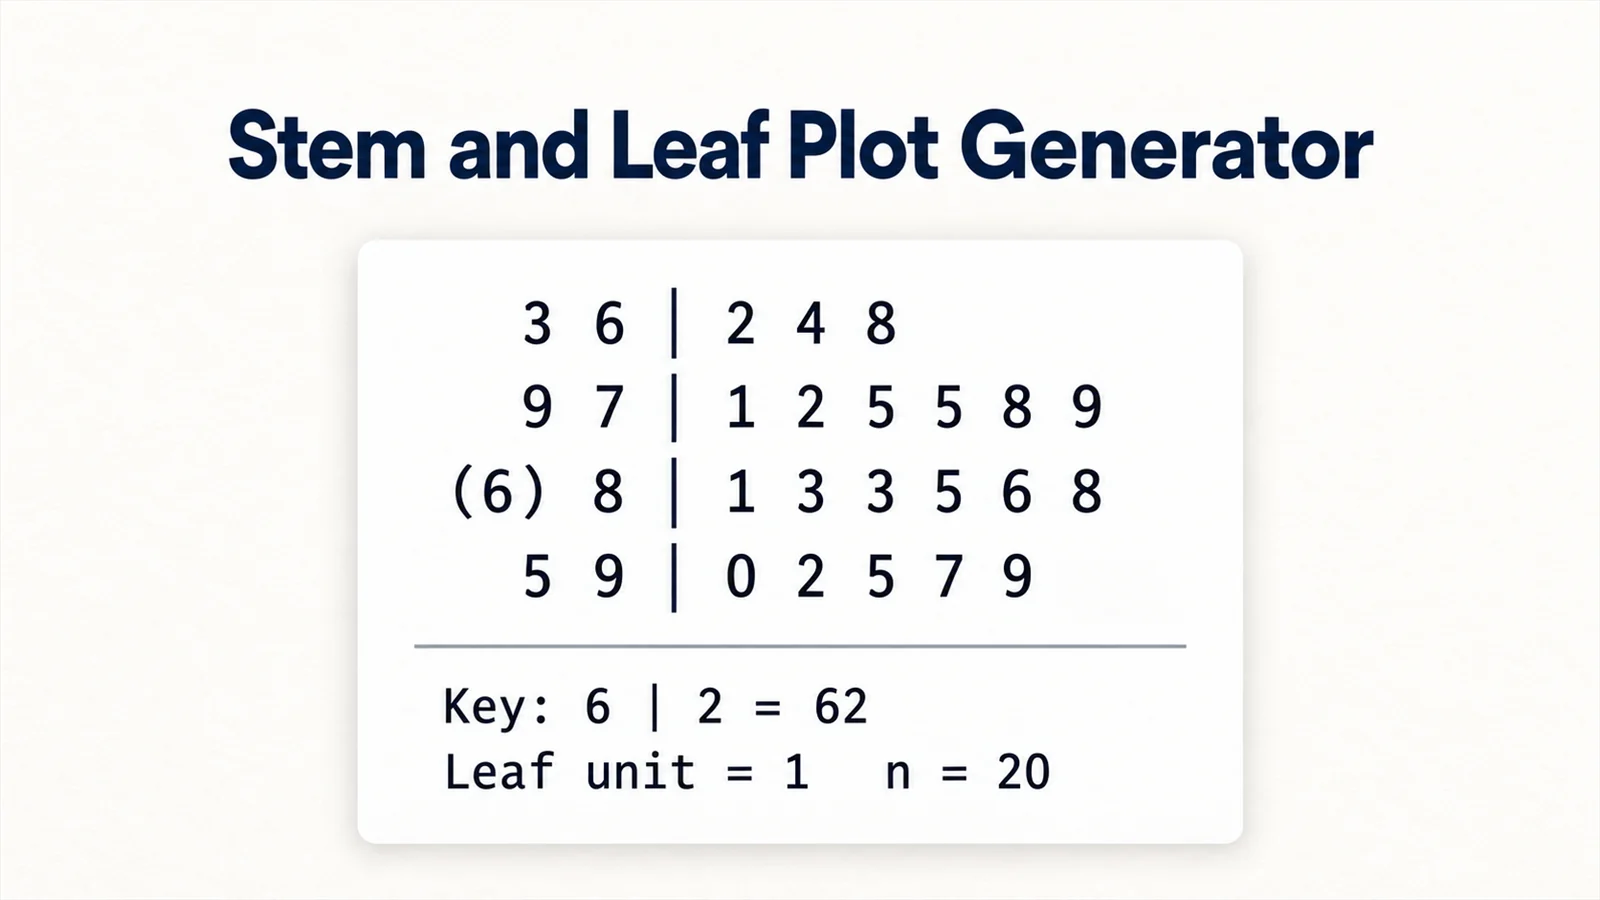
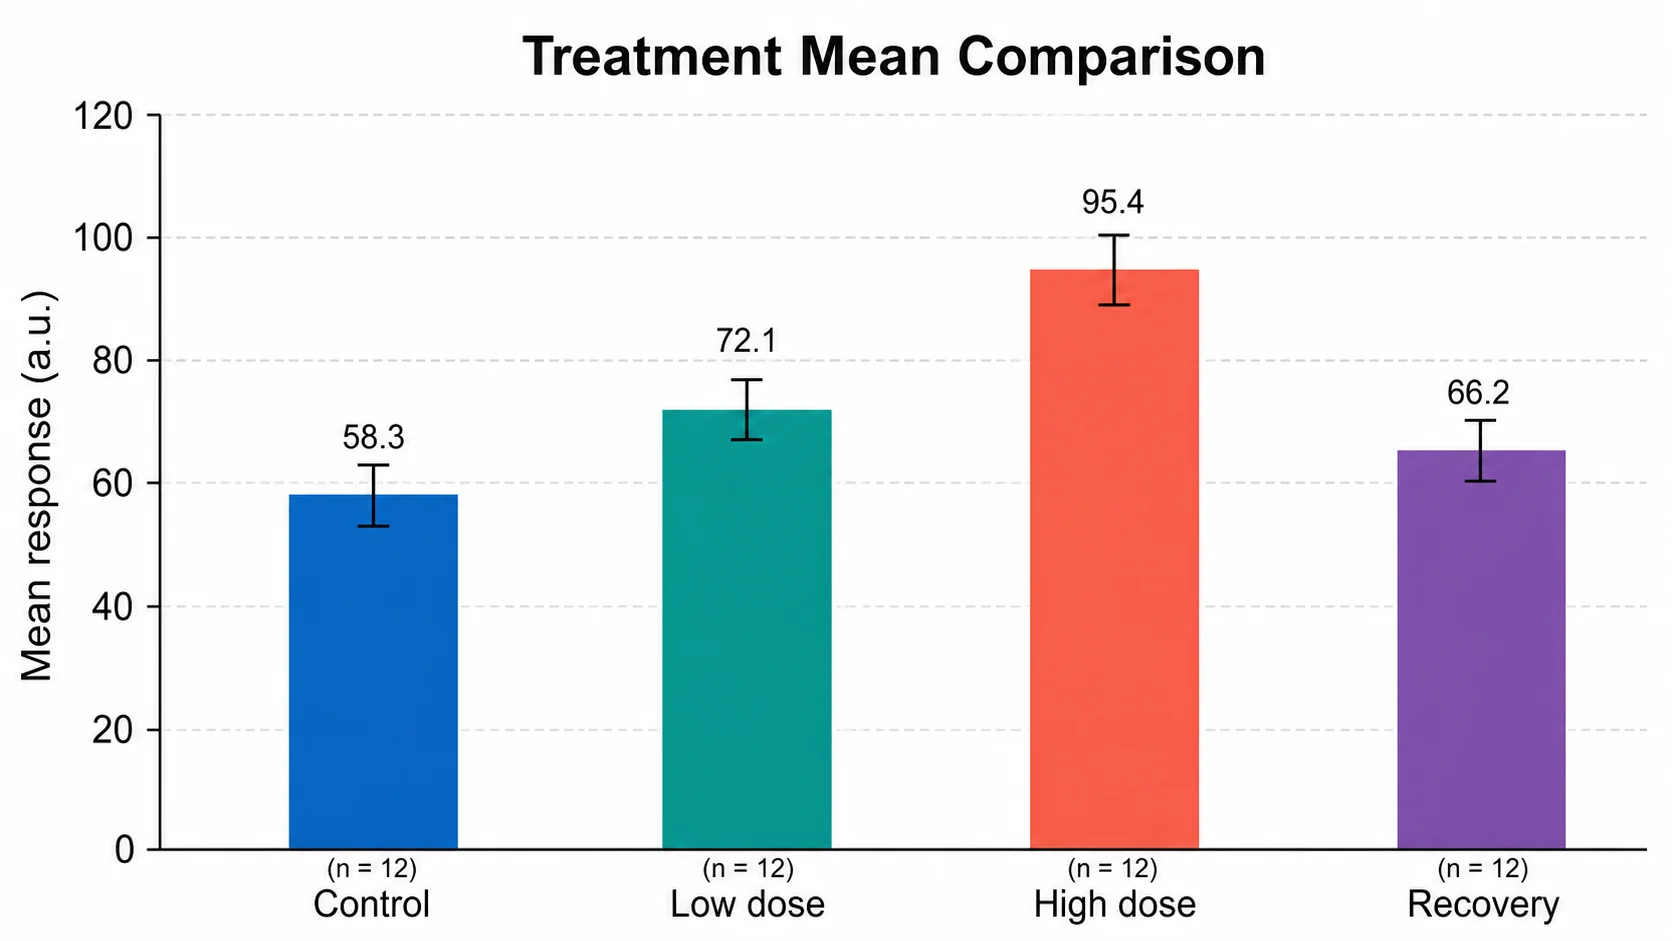
A hundreds chart is a number line folded into rows of ten. To show the same counting on one line, use the number line generator; to move from rows and columns to ordered pairs, the coordinate plane generator prints the grid students meet next. The chance that a number picked from 1 to 100 is prime is 25/100, or 1 in 4; for two or more picks in a row, draw it out with the tree diagram maker. Splitting numbers into tens and ones is also the idea behind a stem-and-leaf plot, and a class tally of, say, how many primes each row holds makes a quick bar chart.
What is a hundreds chart?
A hundreds chart, also called a 100s chart, hundred square or number grid to 100, is a 10 × 10 grid of the numbers 1 to 100 written in rows of ten. Because every row holds exactly ten numbers, the grid makes the base-ten system visible, and children can see why adding 10 is easy long before they can explain it.
- One square to the right adds 1 and one square to the left takes 1 away.
- One row down adds 10 and one row up takes 10 away, so 47 + 20 is two squares straight down from 47, landing on 67.
- Moving diagonally down and to the left adds 9; down and to the right adds 11. That is the whole trick behind the multiples of 9 and 11 lining up.
- On a 1–100 chart every number in a column ends in the same digit, and the last column holds the multiples of ten.
- On a 0–99 chart each row also shares its tens digit (30 to 39 sit together), so the tens digit changes exactly when the row does. That is why many teachers prefer it for place value.
How to make a hundreds chart with this maker
The chart redraws as you change a setting, and nothing is uploaded: the numbers are worked out and drawn by code running in your browser tab.
- Pick a range under Numbers: 1–100, 0–99, 1–120, 101–200, 10 to 1000 by tens, or the 0.01–1.00 hundredths grid. Or type your own first number, step, columns and rows, up to 20 columns and 30 rows.
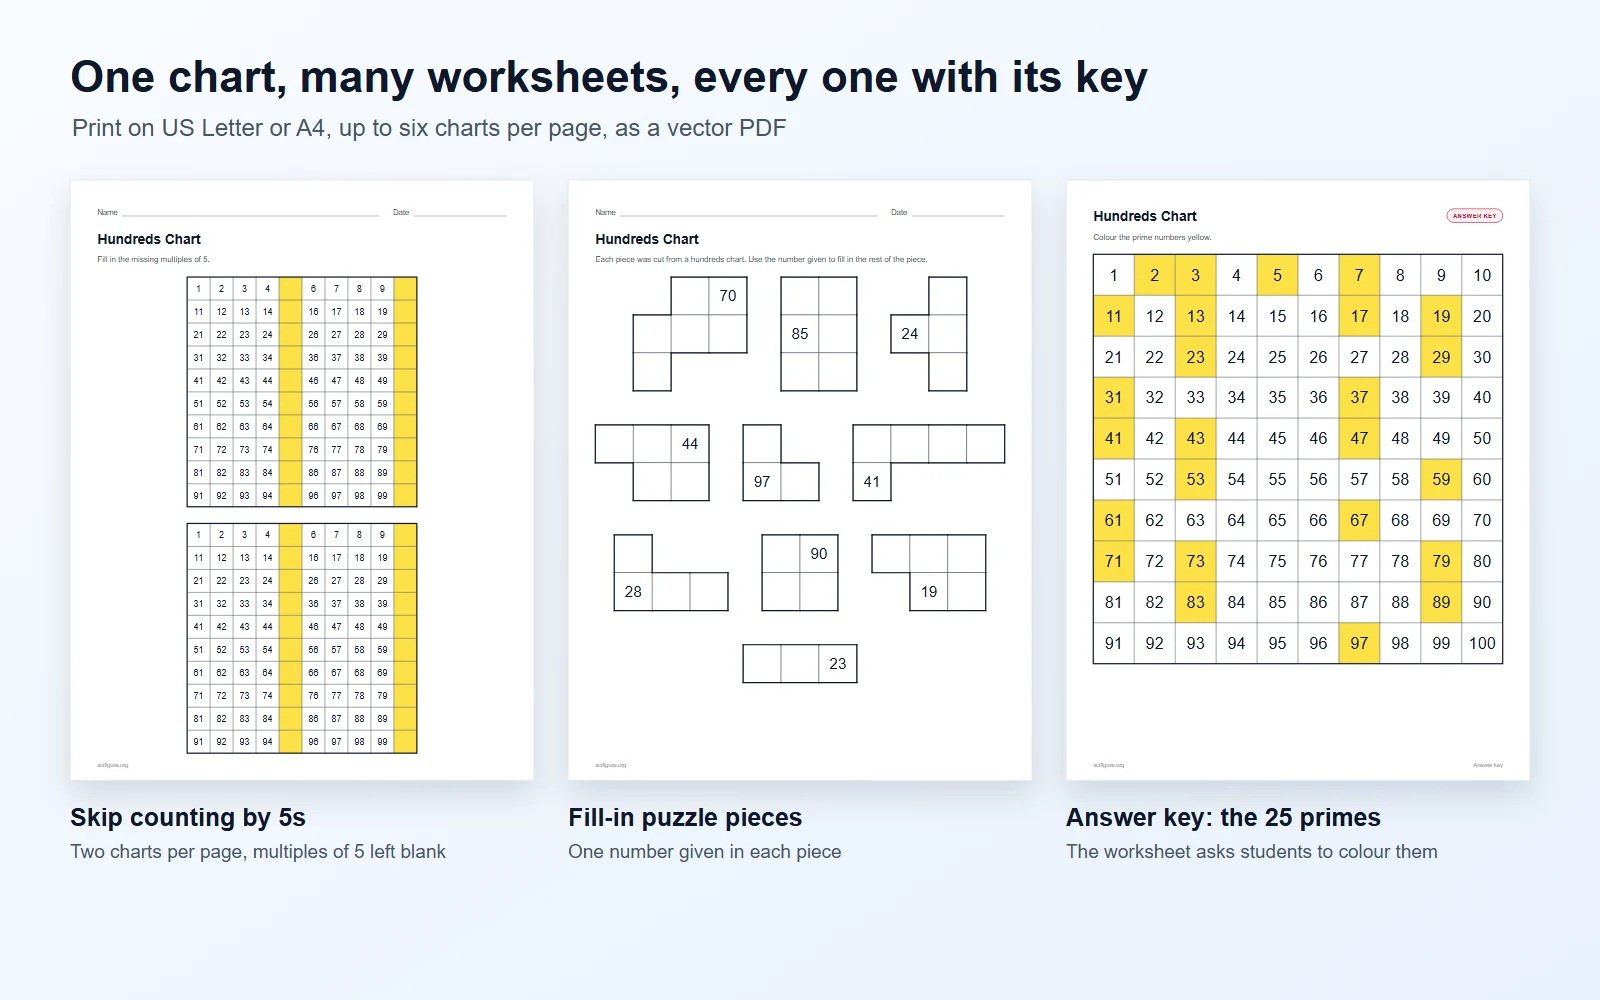
- Choose what students see under Activity: every number, missing numbers (10% to 90% left blank at random), a blank chart with a starting number, a hidden pattern such as the multiples of 5, or every other square.
- Shade up to three patterns, for example the multiples of 2 and of 3, as coloured squares or circled numbers. Set them to “Key only” and the worksheet asks students to do the colouring.
- Add a puzzle: thick cutting lines for a jigsaw, or separate fill-in pieces with one number given in each.
- Under Page, choose Letter or A4, one, two, four or six charts per sheet, and up to 20 pages. Each chart can get its own missing numbers, so neighbours cannot copy.
- Download the PDF (worksheets first, answer keys after), print straight from the page, or save the chart as a PNG or SVG for slides and digital lessons.
Blank, empty and fill-in hundreds charts
An empty 100s chart is only as hard as the clues left in it. Remove clues gradually and the same grid carries a child from copying numbers to reasoning about them.
- Start with a blank chart that keeps the first column (1, 11, 21 … 91). Students fill each row by counting on from its first number.
- Move to random missing numbers at 25%, then 50%. With the first number always shown, every gap can be worked out from its neighbours or from the number above it.
- A fully blank hundreds chart with only “1” in the corner tests whether students know the structure, not just the counting sequence.
- Hide a pattern instead of random squares: leaving the multiples of 5 or 10 blank turns the chart into skip-counting practice.
- Every fill-in chart gets a matching answer key, with the missing numbers printed in red so marking takes seconds. Press “New set of missing numbers” for a fresh version of the same worksheet.
Hundreds chart activities by grade
The chart earns its place in several US Common Core standards. These are the activities that line up with each one.
- Kindergarten, K.CC.A.1 and K.CC.A.2: count to 100 by ones and by tens, and count forward from any number. Point along a full chart, then use a blank chart with the first column shown.
- Grade 1, 1.NBT.A.1: count to 120 starting at any number below 120 and read and write the numerals. The 1–120 chart is made for this standard, because it carries the familiar pattern past 100.
- Grade 1, 1.NBT.C.5: find 10 more or 10 less than a two-digit number without counting. On the chart that is one row down or up; puzzle pieces practise exactly this move.
- Grade 2, 2.NBT.A.2: count within 1000 and skip-count by 5s, 10s and 100s. Use the 101–200 chart and the 10 to 1000 by tens chart, and hide the multiples of 5.
- Grade 3, 3.OA.D.9: identify arithmetic patterns and explain them. Shade the multiples of 4, then of 8, and ask why every multiple of 8 is also shaded for 4.
- Grade 4, 4.OA.B.4: decide whether a number from 1 to 100 is prime or composite and find multiples. The Sieve of Eratosthenes below is the standard activity.
- Grade 4, 4.NF.C.6: use decimal notation for fractions with denominator 100. A hundredths chart shows 0.35 as 35 of 100 squares.
Skip counting and number patterns on a 100s grid
Shade a pattern and the chart shows the arithmetic behind it. These are the shapes students should find on a standard 1–100 chart, and the counts the status line under the chart reports.
- Multiples of 2: five whole columns, every second one, 50 numbers in all. Even and odd alternate across every row.
- Multiples of 5: two whole columns, the fives and the tens, 20 numbers. Multiples of 10: the last column alone.
- Multiples of 3: 33 numbers in diagonal stripes running down to the left, because going down a row and back one square adds 9, a multiple of 3.
- Multiples of 9: 9, 18, 27 … 81 fill one diagonal, and 90 and 99 start the next. On a 0–99 chart the ten multiples from 9 to 90 fill a single diagonal corner to corner.
- Multiples of 11: 11, 22 … 99 run down and to the right. On a 0–99 chart they join 0 on the main diagonal.
- Square numbers: 1, 4, 9 … 100, ten in all. The gaps between them are the odd numbers 3, 5, 7, 9 and so on.
- Prime numbers: 25 of them below 100. Two patterns at once, such as the multiples of 2 and 3, split the squares they share, and those turn out to be the multiples of 6.
1–100, 0–99 or a 120 chart: which one to print
- 1–100 is the classic hundreds chart. It matches counting from one, ends on a round 100, and is what most textbooks print.
- 0–99 keeps each decade in one row and includes zero, which matters when the chart is later linked to a number line or to place-value blocks. It stops at 99, so it is a “number grid to 99” rather than to 100.
- A 120 chart (1 to 120 in twelve rows) matches the grade 1 standard to count to 120 and lets students read and write numbers such as 105 and 117 with the pattern they already know.
- 101–200 and the by-tens chart (10, 20 … 1000) extend the same grid to the second-grade skip-counting and three-digit work.
- A bottom-up chart puts 1 in the bottom row so that moving up means more, as on a graph. Bay-Williams and Fletcher argued for it in Teaching Children Mathematics in 2017, while a 2023 study found first graders counted by tens more often with the usual top-down layout. Try both with your class; the maker draws either.
Hundreds chart puzzles
Puzzles take the chart apart so students have to rebuild its structure from what they know about +1 and +10.
- Cut-apart jigsaw: the full chart prints with thick cutting lines that split it into pieces of about the size you choose. Students cut, shuffle and reassemble, and the numbers on each edge tell them where it fits.
- Fill-in pieces: up to 16 irregular pieces from the chart, each with one number given. From 34 in one square, the square below must be 44 and the one to its left 33.
- Larger pieces are easier because each holds more of the pattern; pieces of three or four squares with one number given are a good challenge for grade 1.
- Press “Cut a new puzzle” for a different cut. With “A different chart each time” switched on, every page gets its own pieces.
Hundredths chart for decimals and percentages
Set the range to 0.01–1.00 and every square is one hundredth of the whole, which ties decimals, fractions and percentages to one picture.
- Each square is 0.01, 1/100 or 1%. A full row is 0.1, a tenth; the whole grid is 1.
- Shading 35 squares shows 0.35, 35/100 and 35% at once. Shade 0.4 beside it and the 40 squares show why 0.4 is the larger number, even though 4 is less than 35.
- Use the blank hundredths chart for students to shade and label, or a missing-numbers version to practise counting in hundredths across a tenth (0.09, 0.10, 0.11).
- Numbers keep two decimal places throughout, so 0.10 prints as 0.10 rather than 0.1 and the place value stays visible.
Printing hundreds chart worksheets
- Print at 100% or “Actual size”. One chart on US Letter gives squares three quarters of an inch wide (54 points), large enough for small hands and counters.
- Two charts per page suit a starter and an exit ticket; four or six give each student practice charts or a set of cards to cut apart.
- Use Ink saver for light grey lines, or the Circle style for patterns, which survives a black-and-white photocopier better than pale shading.
- Print on card stock and laminate a full chart for a reusable dry-erase hundreds chart, or slip it into a page protector.
- The PDF is vector, so it prints sharp at any size and the text is selectable. The SVG opens in Illustrator, Inkscape or PowerPoint for further editing.
An interactive, digital hundreds chart
On screen the chart doubles as a digital number grid: click any number to colour it or blank it, which is quick to do on an interactive whiteboard in front of the class.
- Choose “Colour it”, pick a colour and click numbers as the class finds them, or switch to “Blank it” and hide numbers for a quick “what’s missing?” game.
- As a 1–100 number board it tracks numbers picked in a raffle, a bingo-style game or a 100-square fundraiser: click each number as it is called.
- Clicked colours and blanks also print, so a chart prepared on screen becomes a worksheet.
- Export the chart as PNG for Google Slides, Seesaw or a learning platform, where students can drag shapes onto it.
Frequently asked questions
Is this hundreds chart maker free?
Yes. There is no sign-up and no limit on charts, pages or downloads, and every export is free. It runs entirely in your browser, and your last chart is saved on your own device so it is still there when you come back.
How do I print a blank hundreds chart?
Choose the Blank chart activity, or set Numbers shown to Blank chart. You can leave in the first number, the first column or the top row as a starting point, or nothing at all. Then download the PDF, which includes an answer key with every number filled in.
How do I make a missing numbers worksheet with an answer key?
Pick Missing numbers, set how much is left blank with the slider, and keep “Always show the first number” on. The PDF puts the worksheet pages first and the answer keys after, with the missing numbers in red. “New set of missing numbers” gives a fresh version.
What is the difference between a 0–99 chart and a 1–100 chart?
On a 0–99 chart each row holds one decade, 30 to 39 for example, so the tens digit matches the row. On a 1–100 chart each row runs from 31 to 40, so the last number in every row belongs to the next decade. The 1–100 chart is more common; the 0–99 chart is often preferred for teaching place value.
What is a 120 chart?
A hundreds chart extended to 120, in twelve rows of ten. It supports the grade 1 Common Core standard to count to 120 from any number, and shows that the pattern of the first hundred carries on past 100. Choose 1–120 under Numbers.
How many prime numbers are on a hundreds chart?
There are 25 primes between 1 and 100: 2, 3, 5, 7, 11, 13, 17, 19, 23, 29, 31, 37, 41, 43, 47, 53, 59, 61, 67, 71, 73, 79, 83, 89 and 97. The number 1 is neither prime nor composite. The Colour the primes activity makes a worksheet whose answer key shades all 25.
What pattern do the multiples of 9 make on a hundreds chart?
A diagonal running down and to the left: 9, 18, 27, 36, 45, 54, 63, 72 and 81 sit on one diagonal, and 90 and 99 begin the next. Each step goes down one row (add 10) and left one square (take away 1), which adds 9. On a 0–99 chart, 9 to 90 fill one corner-to-corner diagonal exactly.
Can I make a hundredths chart for decimals?
Yes. Choose the 0.01–1.00 range and the grid counts in hundredths, keeping two decimal places throughout, so a row is a tenth and the whole grid is 1. It works with every activity, including blank and missing-number versions.
Can I fit several hundreds charts on one page?
Yes: one, two, four or six charts per page on US Letter or A4, and up to 20 pages. With “A different chart each time” on, every chart gets its own missing numbers or puzzle, and the answer key pages follow in the same order.
How do hundreds chart puzzles work?
Choose Cut-apart jigsaw for a full chart with thick cutting lines that students cut out and reassemble, or Fill-in pieces for separate pieces of the chart, each with one number given, that students complete using +1 across and +10 down. Both come with an answer key.
Can I use it as an interactive or digital hundreds chart?
Yes. In the Chart view, click any number to colour it or to blank it out, which works well projected on a whiteboard. Clear clicks resets the board, and the PNG and SVG exports drop the chart into slides or a learning platform.
Can I start at another number or count by 2s, 5s or 10s?
Yes. Type any first number and step under Numbers: start at 2 and count by 2 for a chart of even numbers, or start at 10 and count by 10 to reach 1000. Negative numbers and decimals with up to three places work too.
Can I make a bottom-up hundreds chart?
Yes. Under Numbers, choose to put the first number at the bottom. The chart then counts upward, so moving up a row adds ten. Every activity, highlight and puzzle works the same way in either direction.
Can I edit the chart after downloading it?
The PDF keeps its text as real, selectable text and opens in any PDF editor. For full editing, download the SVG and open it in Illustrator, Inkscape, Affinity Designer or PowerPoint, where every line and number is a separate object.
Related tools
Number Line Generator
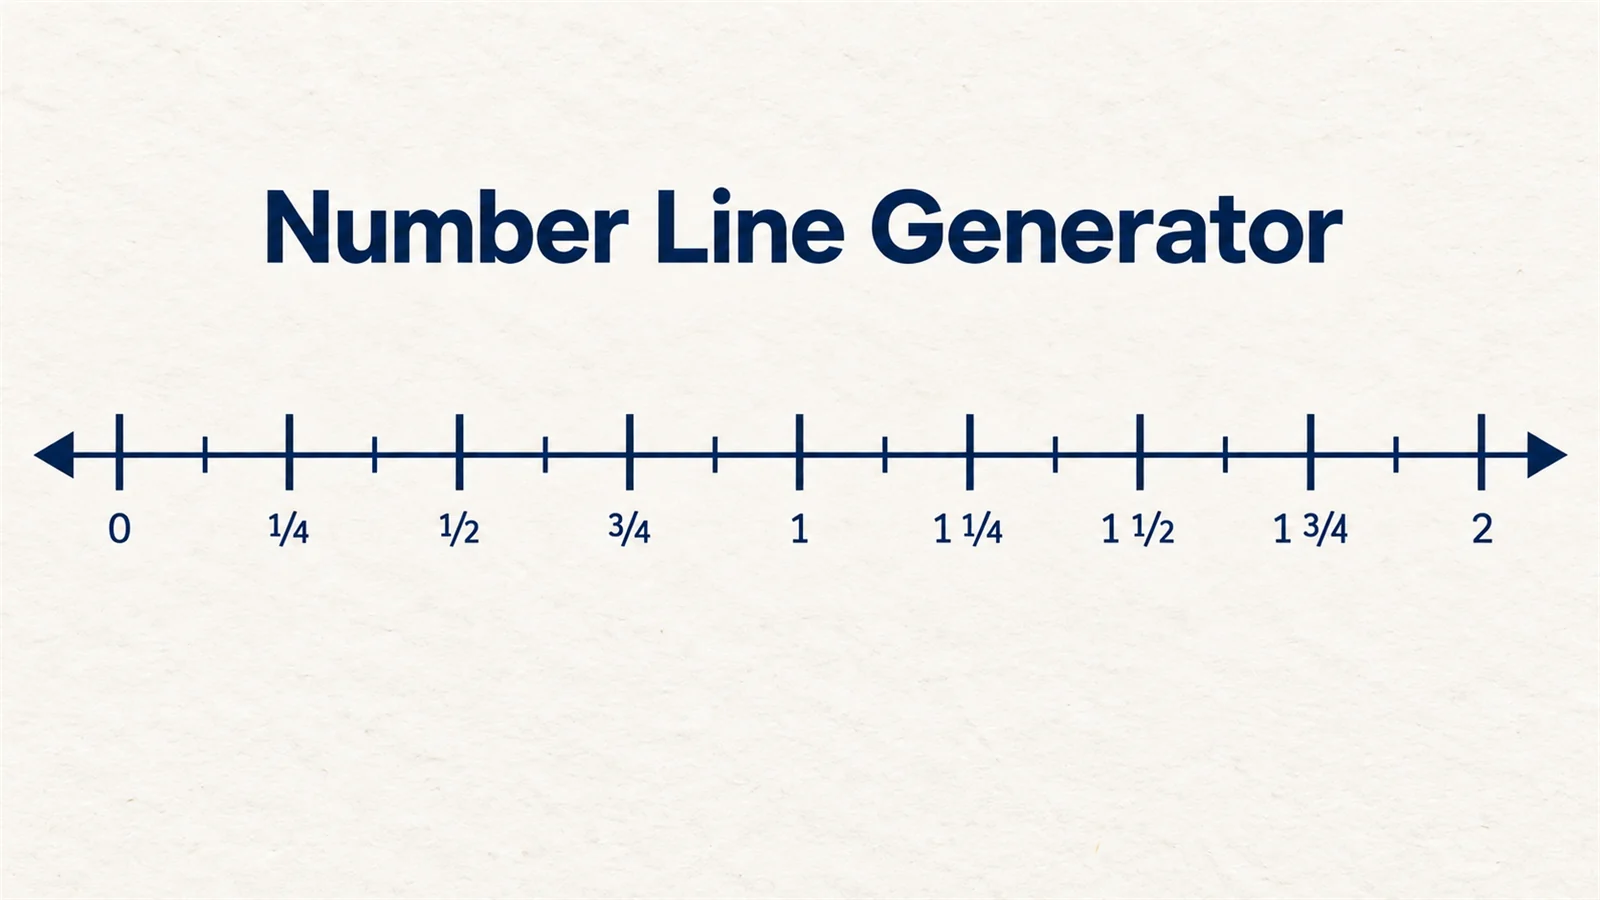
The same counting on a single line, with fractions, points and shaded inequalities.
Coordinate Plane Generator
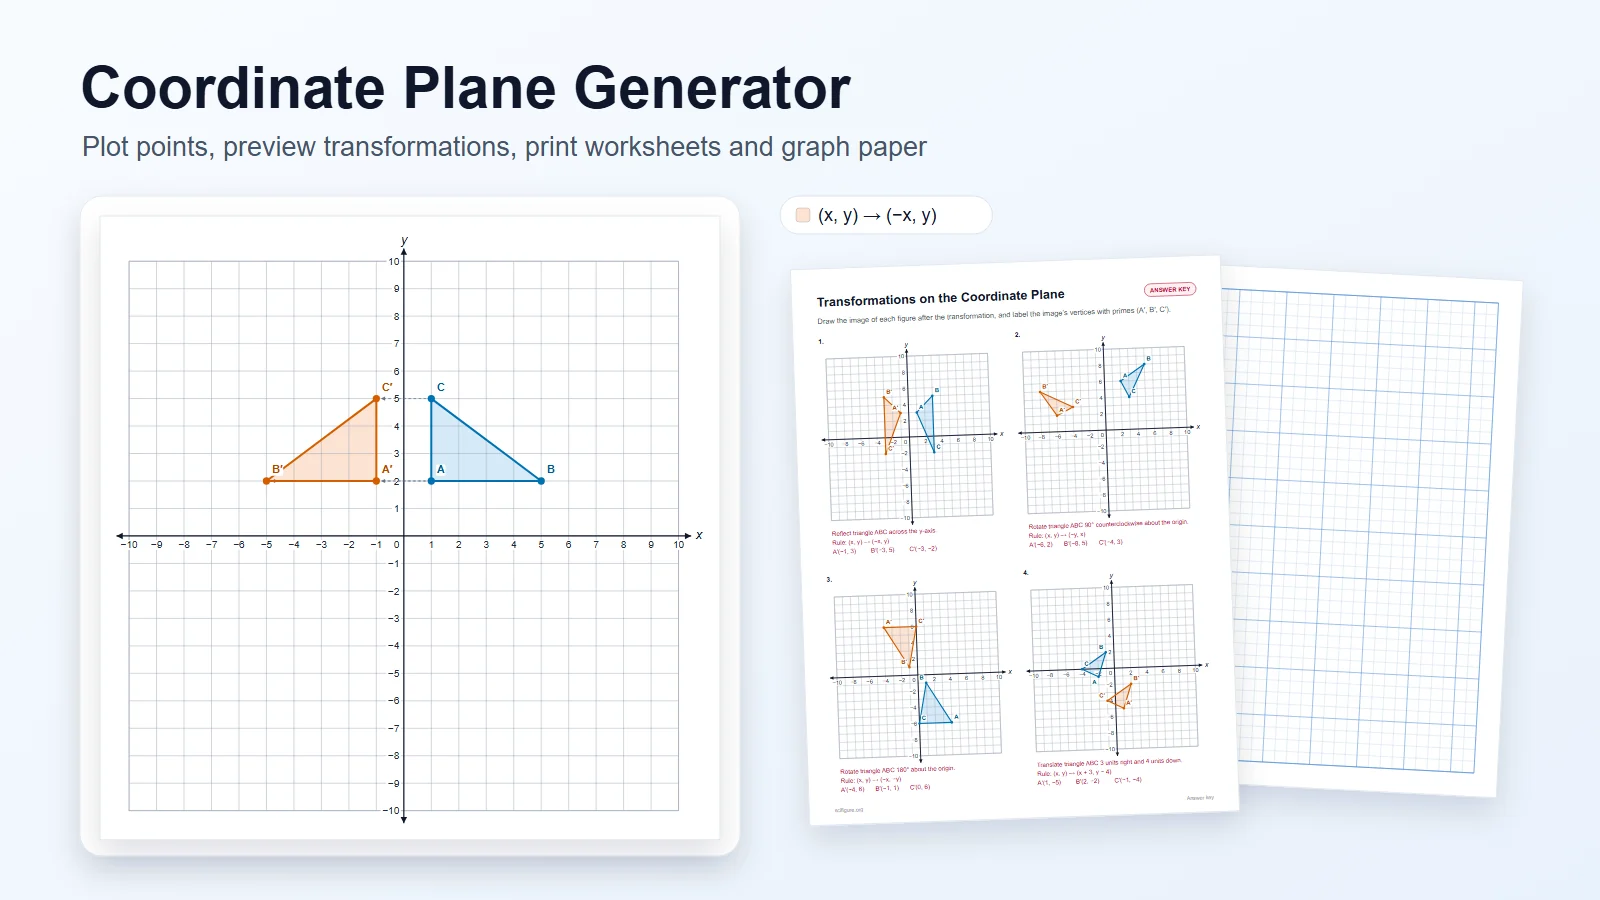
Printable coordinate grids with plotted points, transformations and answer keys.
Tree Diagram Maker
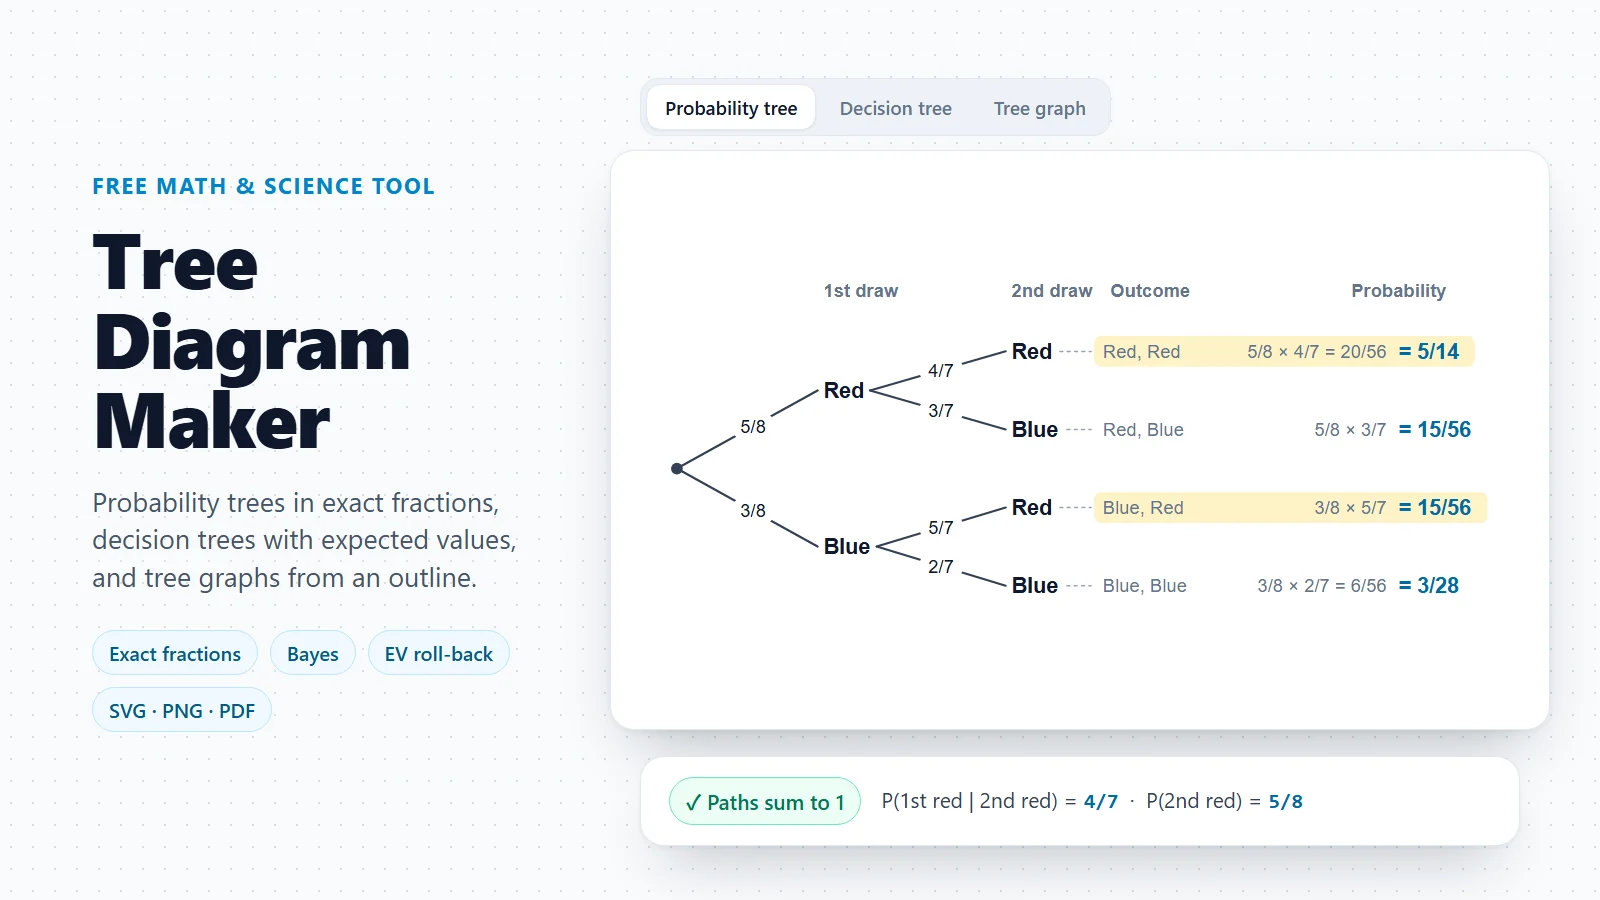
Draw probability trees for picking numbers, flipping coins and rolling dice.
Stem and Leaf Plot Generator
Split data into tens and ones, with the five-number summary beside it.
Bar Chart Generator
Turn a class tally or survey into a clean, labelled bar chart.
More free tools for the classroom
Number lines, coordinate grids, Punnett squares, food webs and diagram makers, free to use and print.
Browse the free toolsLast checked: November 8, 2026. Sources: Common Core: Kindergarten Counting and Cardinality; Common Core: Grade 1 Number and Operations in Base Ten; Grade 2 Number and Operations in Base Ten; Grade 3 Operations and Algebraic Thinking; Grade 4 Operations and Algebraic Thinking; Grade 4 Number and Operations: Fractions; OEIS A000040, the prime numbers; Wagner, Osana & Navarrete-Ulloa, School Science and Mathematics (2023).