
Free chemistry tool
Particle diagram generator for states of matter
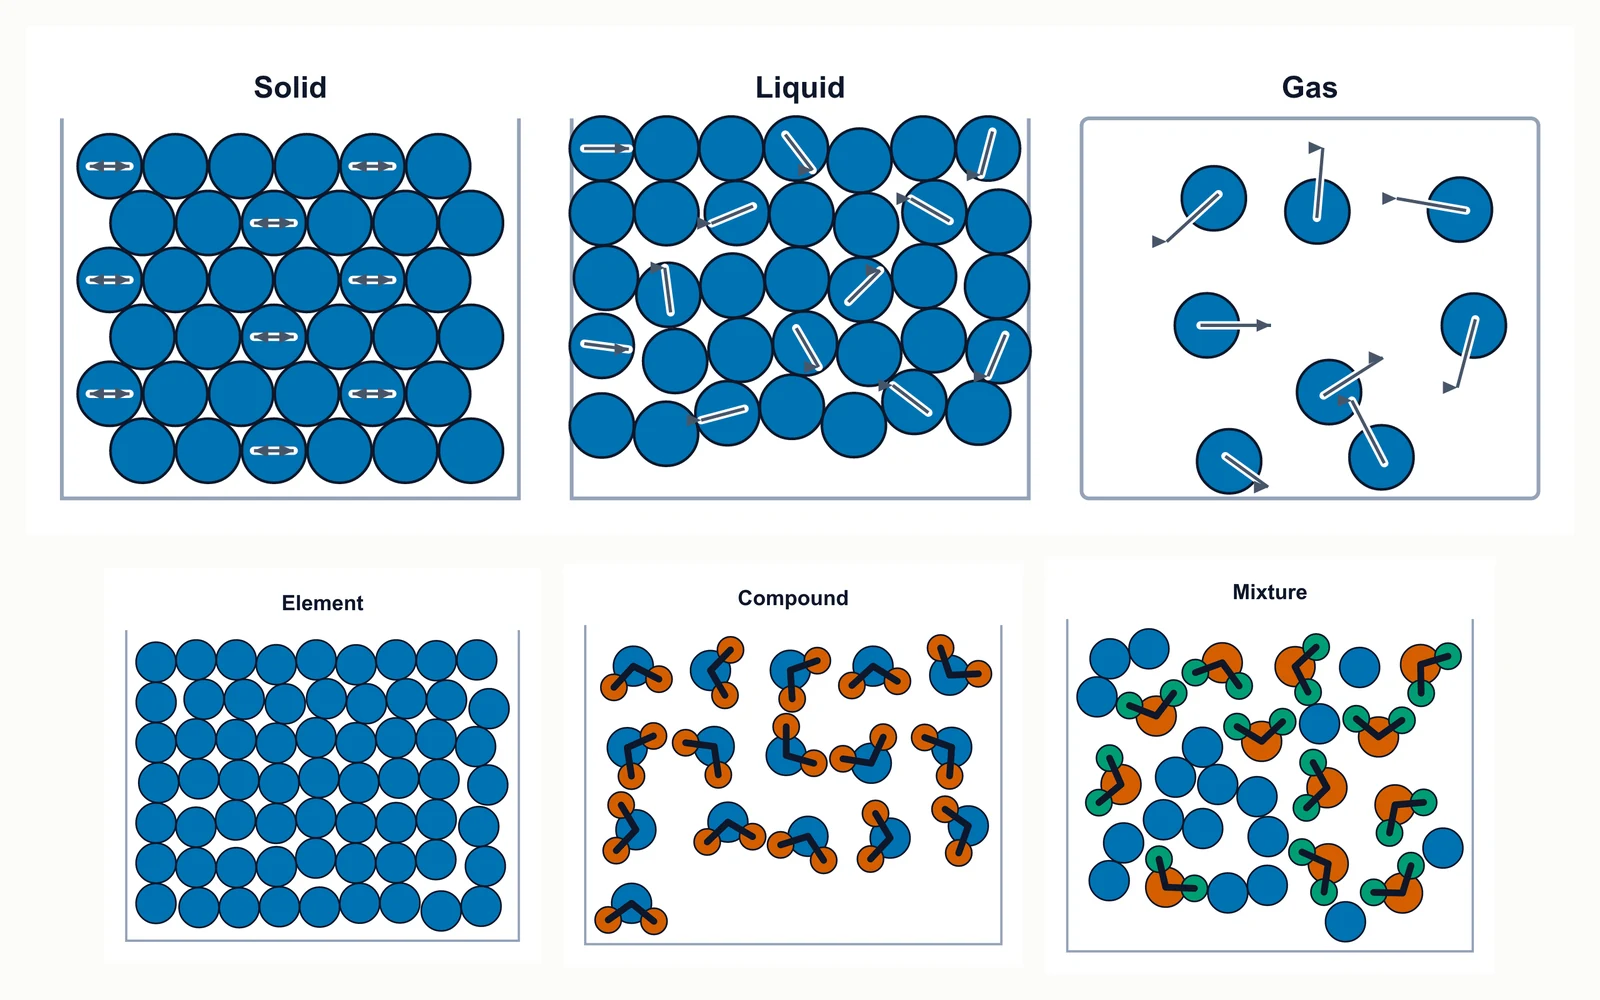
Pick a state and what the substance is made of, and this particle diagram generator draws it: a solid as a regular lattice, a liquid as a disordered close pack, a gas as widely spaced particles. Draw all three side by side in boxes of identical size, switch between element, compound and mixture, and download a PNG or an editable SVG.
Solid, liquid and gas in three panels of identical size, so the difference you see is the spacing rather than the box.
One kind of atom, not bonded — a metal or a noble gas.
The liquid and gas panels are filled from this to the right density — the gas gets about a quarter as many, in the same size box.
The three panels always keep their labels, otherwise the figure does not say which is which.
Gives a new random arrangement at the same density. A solid always comes back as a regular lattice, because that is what a solid is.
What a particle diagram has to show
A particle diagram is the simple model of matter: circles for particles, and the arrangement carries all the meaning. Marks are awarded for the arrangement, the spacing and the movement, so those three are what the tool gets right.
- A solid: particles touching, in a regular repeating pattern, all the same way up. They vibrate about fixed positions and cannot swap places, which is why a solid keeps its shape.
- A liquid: particles still touching, so the density is almost the same as the solid, but the arrangement is irregular and they slide past each other. That is why a liquid flows and takes the shape of its container while keeping a surface.
- A gas: particles far apart with mostly empty space between them, moving quickly in random directions. That is why a gas can be compressed and fills its container completely.
- The commonest lost mark is a liquid drawn with gaps between the particles. A liquid is only a few per cent less dense than the solid — the difference is the disorder, not the spacing.
- The second commonest is a solid drawn with random spacing. If the pattern is not regular, the diagram is a liquid.
Element, compound or mixture
The second thing a particle diagram is asked to show is what the substance is made of. Two independent questions decide it: are the particles single atoms or bonded groups, and is there one kind of particle or more than one?
- An element: one kind of atom only. It may be unbonded, like a metal or a noble gas, or bonded into identical molecules, like oxygen or chlorine. Both count as elements.
- A molecular element is the case students lose marks on. O₂ is two atoms bonded together, but both atoms are the same, so it is an element, not a compound. The tool draws both atoms in a pair the same colour for exactly this reason.
- A compound: two or more elements chemically bonded in a fixed ratio, and every particle in the diagram is identical. If the particles differ from each other, it is not a compound.
- A mixture: more than one kind of particle, jumbled together and not bonded to each other, in no fixed ratio. A mixture of elements, a mixture of compounds, and an element mixed with a compound are all mixtures.
- Colour means element here. Two circles of the same colour are the same element; a bond line between two circles means a chemical bond, not just contact.
Why the three panels share one box
The usual exam figure is a solid, a liquid and a gas next to each other. That comparison only works if the three containers are the same size.
- Draw a gas in a bigger box than the solid and the figure says nothing: a reader cannot tell whether the gaps grew or the box did.
- The comparison view sizes the box from the solid, then draws the liquid and the gas inside that same box. The number of particles in it is what changes.
- A liquid gets roughly the same number as the solid, because a liquid is nearly as dense. A gas gets about a quarter as many, which is already generous — the real ratio is closer to a thousandth, and no diagram can show that to scale.
- The container itself differs by state, on purpose. A gas is drawn in a sealed box because it fills its container; a solid and a liquid sit in an open-topped vessel, so the liquid can have a surface.
- Turn the movement arrows on to show the third part of the model: short double-headed marks for vibration in a solid, curved arrows for sliding in a liquid, long straight arrows in random directions for a gas.
Using the diagrams in a worksheet
The same figure is usually wanted twice: once complete, and once with something removed for students to supply.
- Turn the caption off and the panel labels on for a figure students annotate themselves.
- Turn the panel labels off in single-state mode and draw three separate figures, then ask students to name each state from the arrangement alone.
- Export the PNG at full size for a document or slide, or the SVG to edit the labels in Illustrator, Inkscape, or PowerPoint.
- "Rearrange the particles" gives a new random arrangement at the same density, so each group can get a different-looking version of the same question. A solid always comes back as a regular lattice, because otherwise it would not be a solid.
- The colours are the Okabe-Ito palette, which stays distinguishable for every common form of colour blindness, and the figure still reads correctly printed in greyscale because the shapes and the bonds carry the meaning too.
Frequently asked questions
Is this particle diagram generator free?
Yes. It runs entirely in your browser, needs no account, and exports PNG and SVG without a watermark. Nothing you enter is uploaded to a server.
What is a particle diagram?
A simple model that draws every particle in a substance as a circle, so that the arrangement, the spacing and the movement can be compared between states. It is the standard way states of matter, and the difference between elements, compounds and mixtures, are shown in school chemistry.
How do you draw a particle diagram of a solid, a liquid and a gas?
The solid is a regular lattice of touching particles. The liquid has the same touching particles but no regular pattern. The gas has a few particles far apart with empty space between them. Use the comparison view and all three are drawn for you in boxes of the same size, which is what makes the spacing difference meaningful.
Should a liquid have gaps between its particles?
No, and this is the most common mistake. Water is only about ten per cent less dense as a liquid than as ice, so the particles in a liquid are still touching. What changes between solid and liquid is the order, not the spacing: the liquid particles are jumbled and can slide past one another. Leave visible gaps and you have drawn a gas.
How do I show the difference between an element, a compound and a mixture?
By the particles themselves. One colour of circle means one element. Identical particles each made of two or more colours bonded together means a compound. More than one kind of particle, unbonded and in no fixed ratio, means a mixture. Pick the case from the list and the tool applies those rules for you.
Is oxygen gas an element or a compound?
An element. O₂ is two atoms chemically bonded, which makes it a molecule, but both atoms are oxygen, so only one element is present. A compound needs at least two different elements. Choose "Element (molecules)" for this case: the tool draws bonded pairs in a single colour, which is what makes it read as an element.
Are the diagrams to scale?
The arrangement is right; the gas spacing is not, and no printed diagram can make it so. At room temperature and pressure a gas is around a thousand times less dense than its liquid, so a truthful gas panel next to a solid panel would be almost empty. The tool draws a gas about four times less dense, which is the usual textbook compromise and still shows the point.
Can I draw a diagram for a change of state?
Draw the two states you need and put them side by side. Use the comparison view for the full solid to liquid to gas sequence, or single-state mode twice — for example a solid and a liquid at the same particle size — to illustrate melting. The tool draws arrangements rather than animating the transition between them.
Related tools
Chemistry Diagram Generator
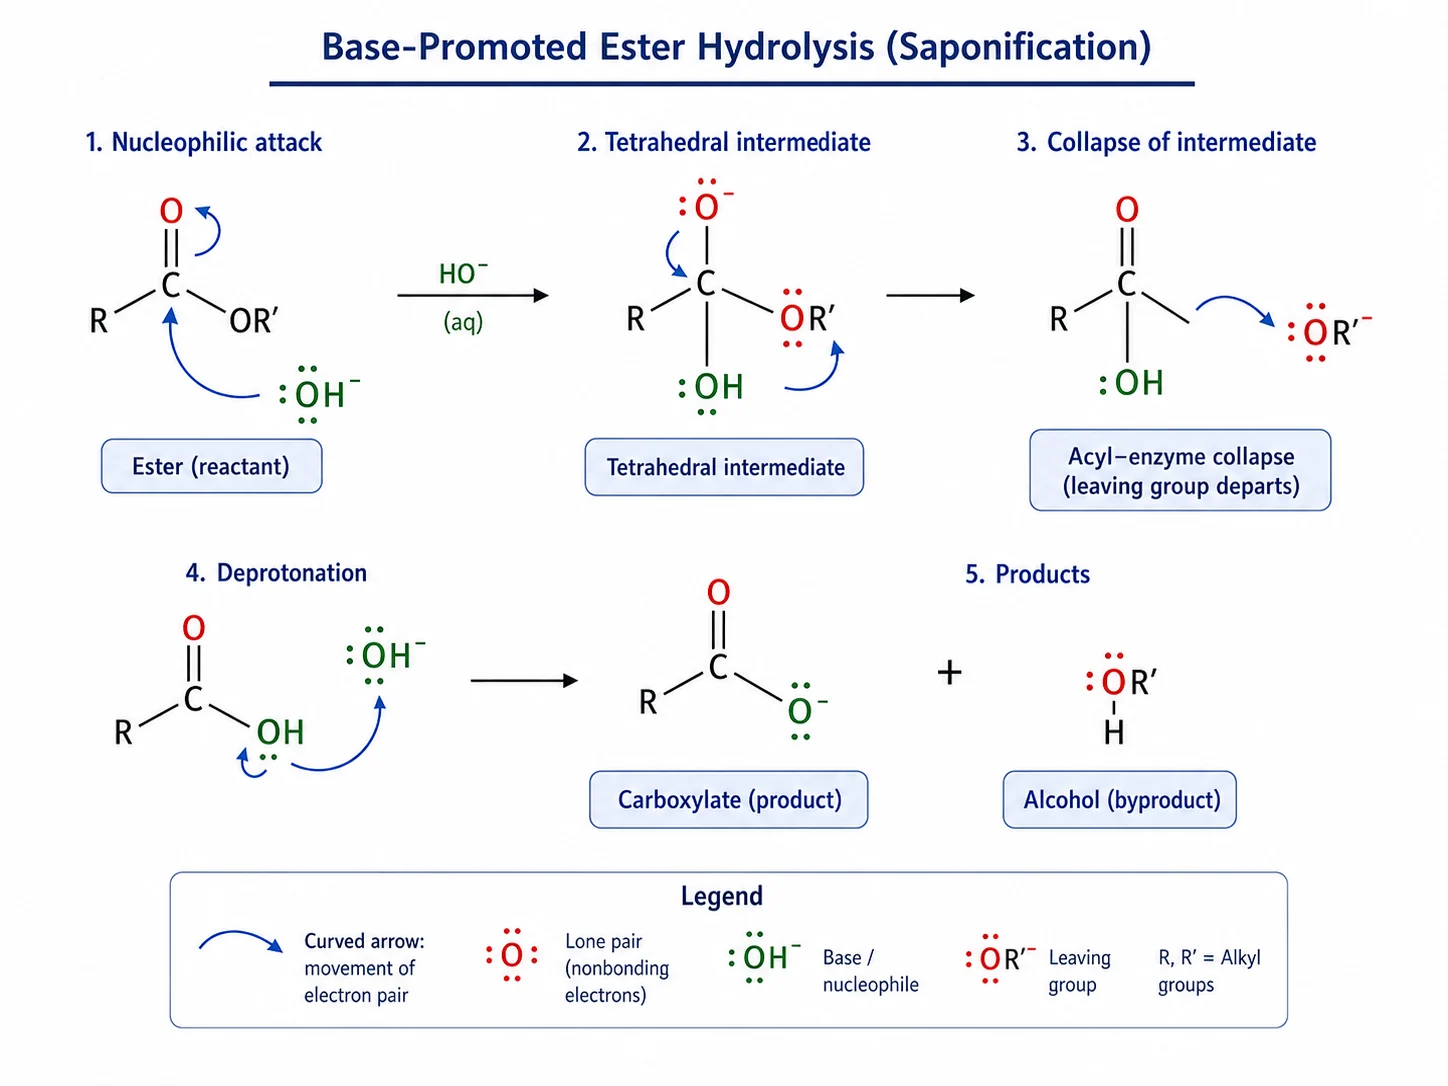
Generate labelled chemistry diagrams and apparatus figures from a description.
Lewis Dot Structure Generator
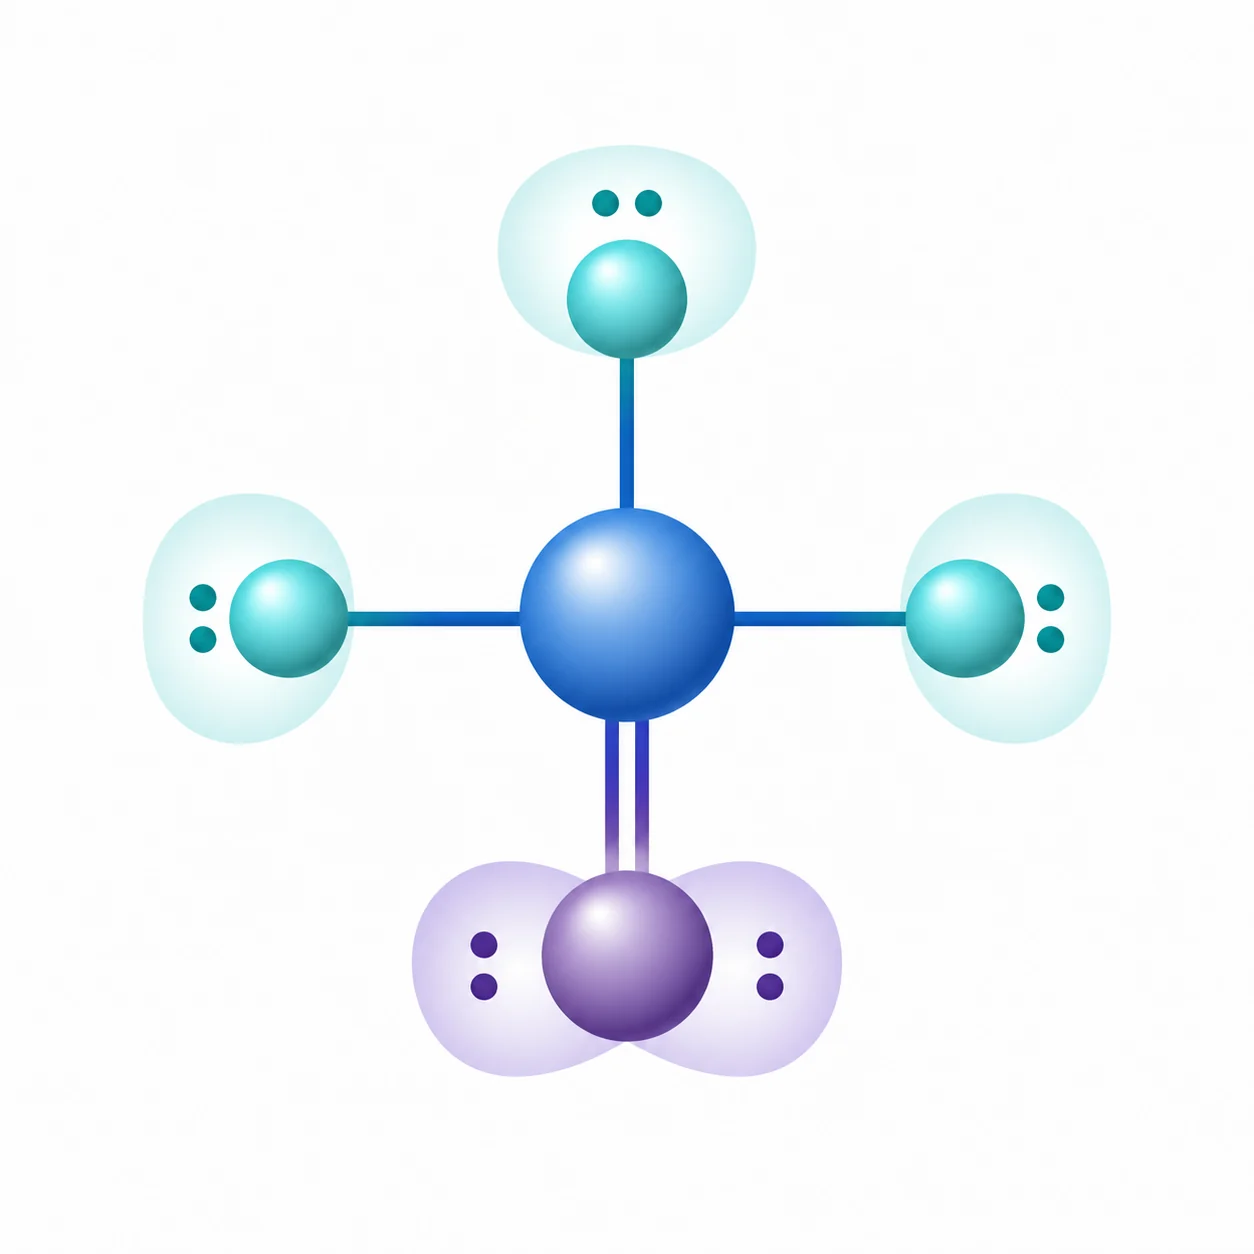
Draw Lewis dot structures with bonding pairs and lone pairs worked out.
Molecular Orbital Diagram
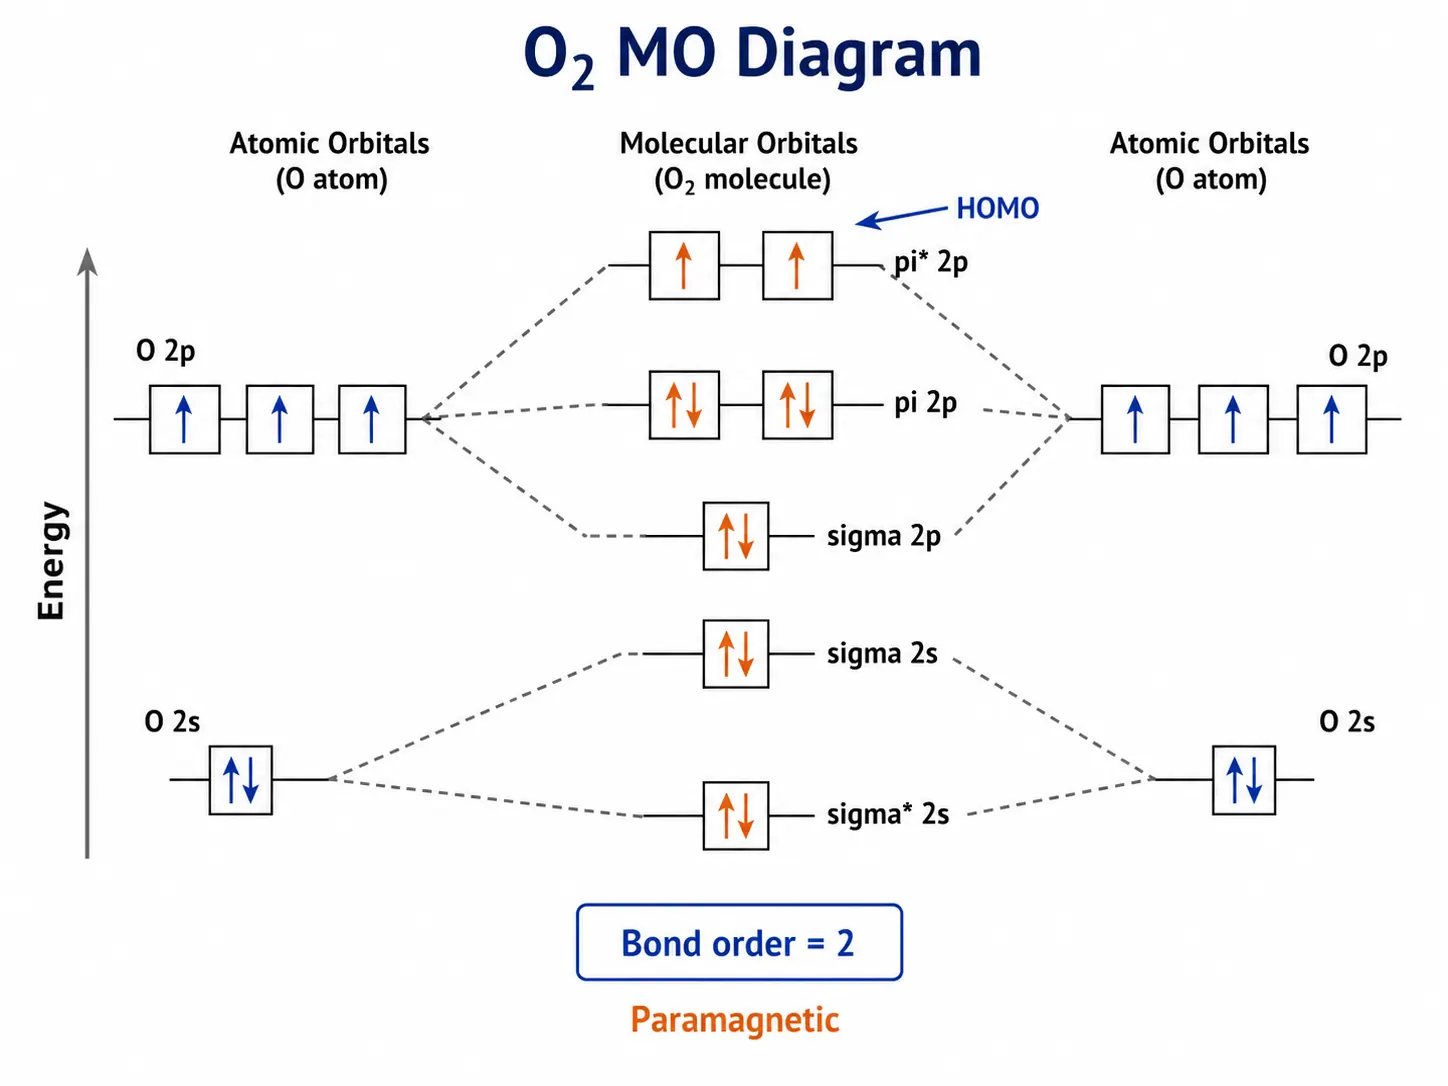
Build molecular orbital energy diagrams with bonding and antibonding levels.
ChemDraw Alternative
Free browser tools that cover what a ChemDraw licence is usually bought for.
Need a labelled diagram rather than particles?
SciFigure AI draws labelled chemistry and biology diagrams, worksheets, and publication-ready figures from a description.
Explore the diagram generatorsLast checked: September 28, 2026. Sources: Royal Society of Chemistry: teaching the particle model; Okabe & Ito, colour-blind safe palette.