Generate a labeled solar system diagram with the Sun, the eight planets in order, and their orbits, or a blank version for students to label, plus its answer key. Add the asteroid belt, the Kuiper Belt, and dwarf planets, compare planet sizes, or lay out a solar system chart, then download a clean figure for worksheets, slides, and revision.
Labeled, numbered or blank8 planets in orderMatching answer key
Checked against NASA planet data
Worksheet + answer key pairs
Print-ready PNG
AI Solar System Diagram Generator
Describe the layout and what to label, or pick a blank worksheet from the Labels menu.
523 / 2000 characters
Generate a publication-ready PNG from your description.
Preview
Solar System Diagram Example Previews
Target aspect ratio: 16:9
Sample previews. Describe your diagram to generate your own solar system figure.
Labeled and Blank Solar System Diagram Examples
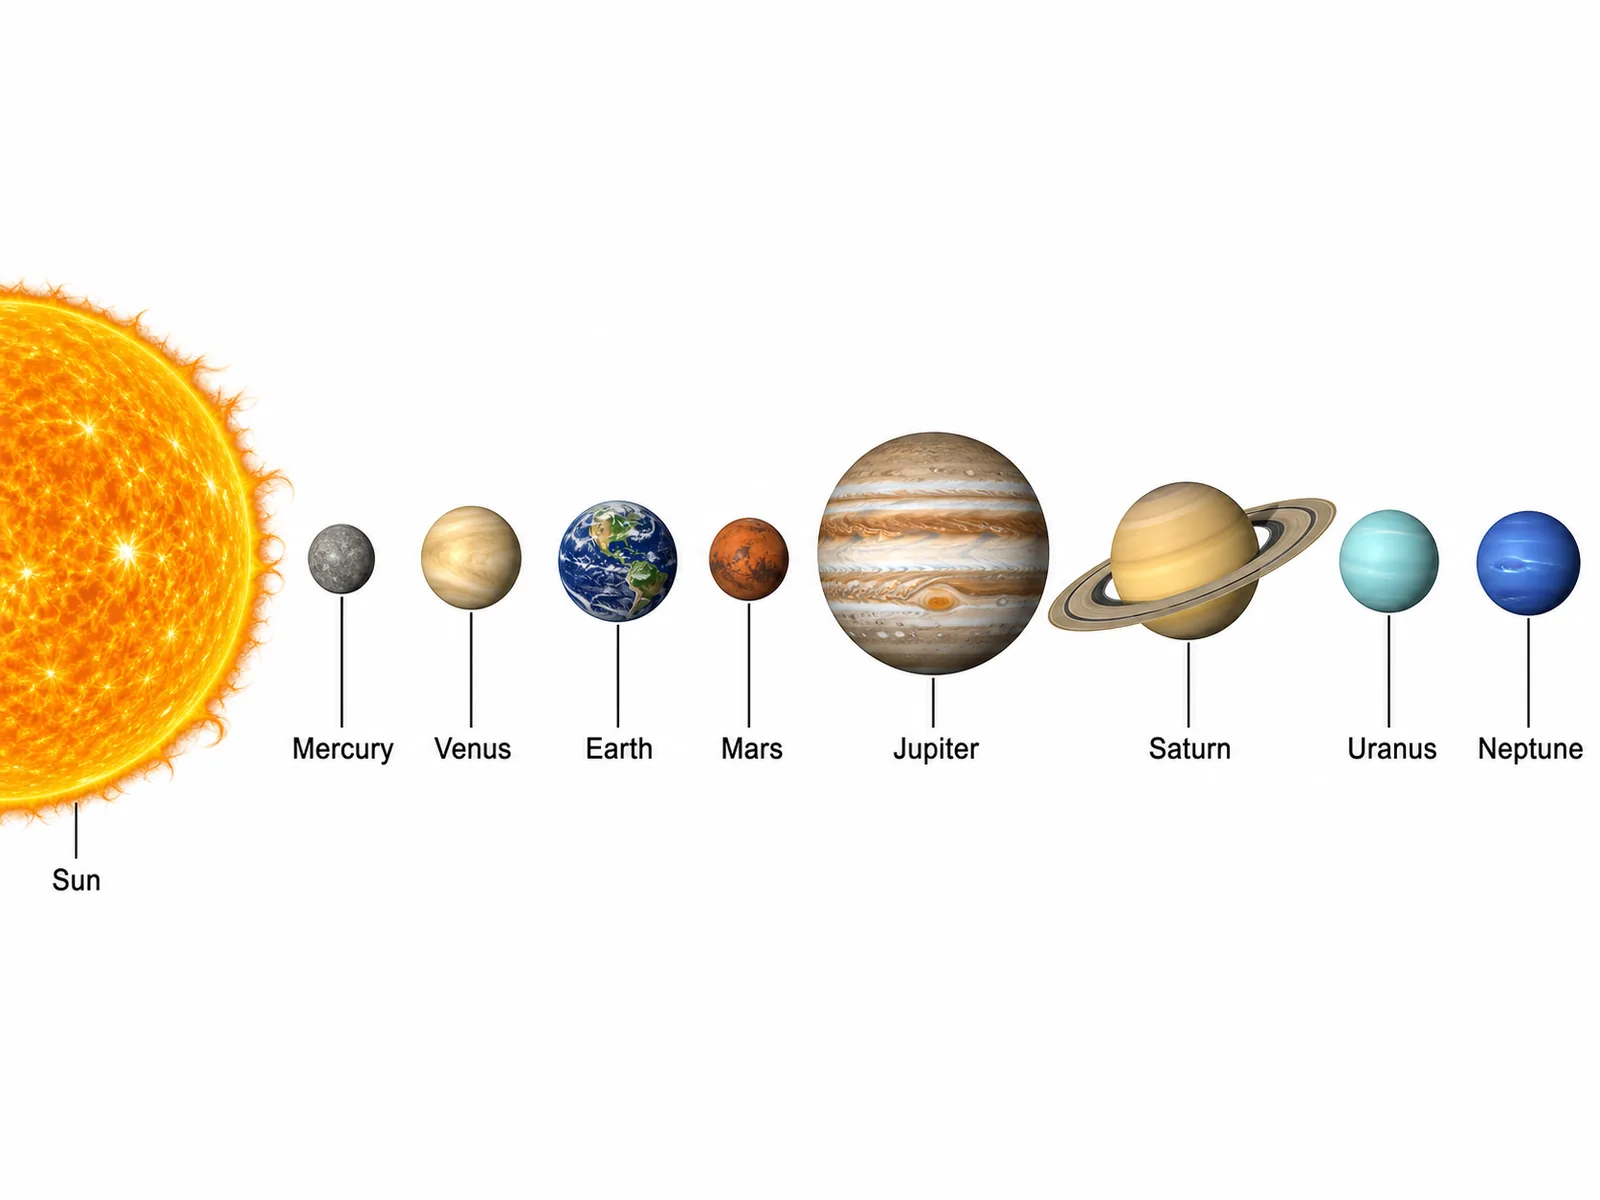
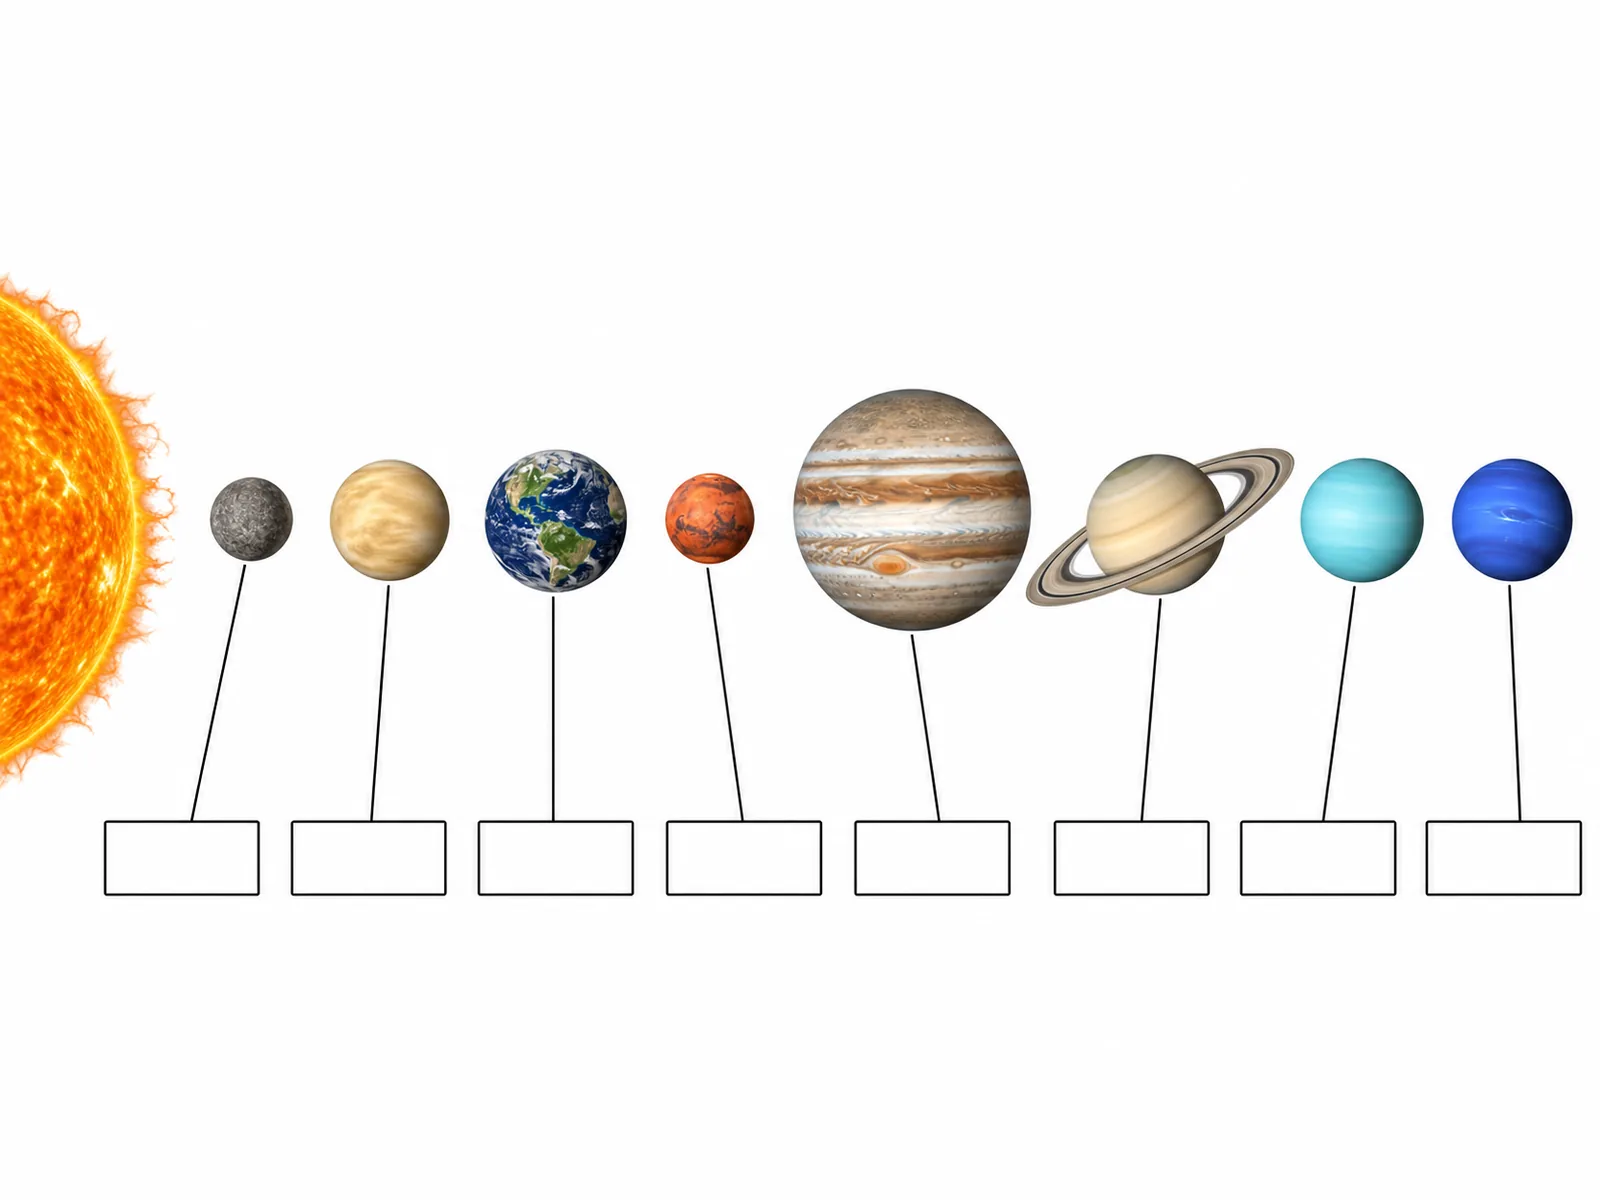
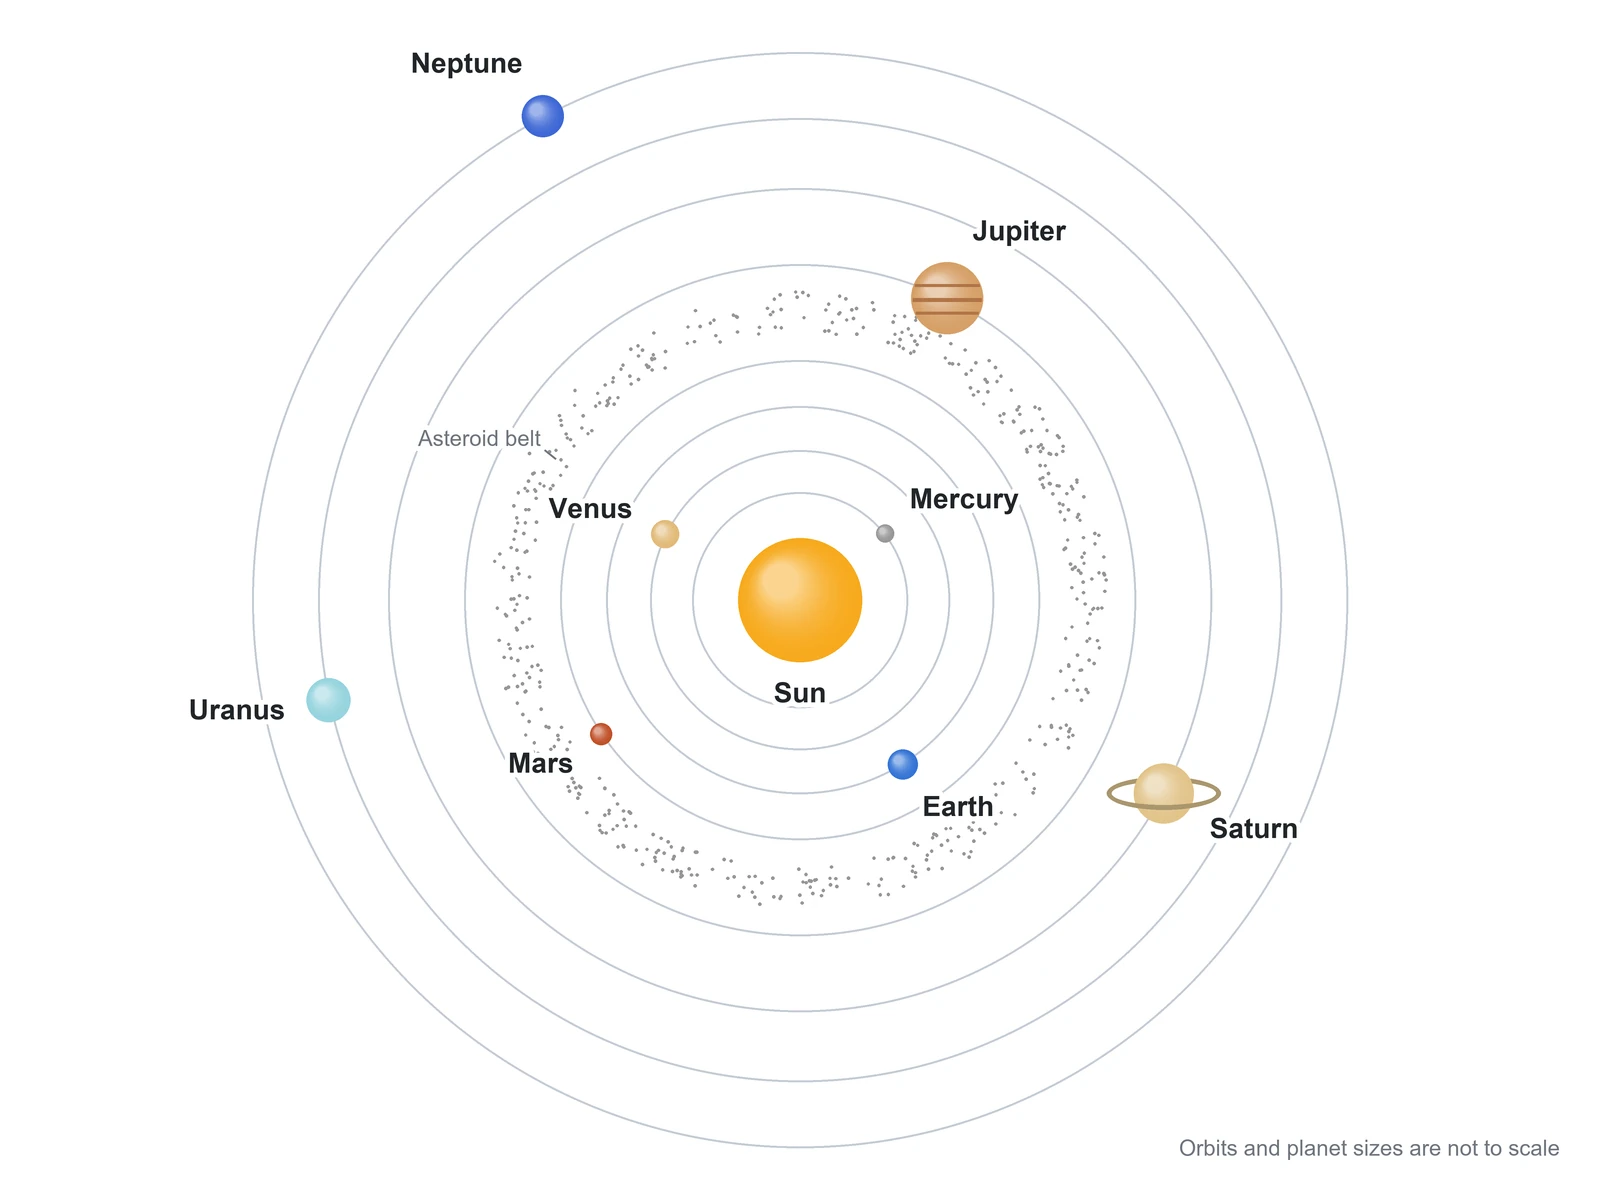
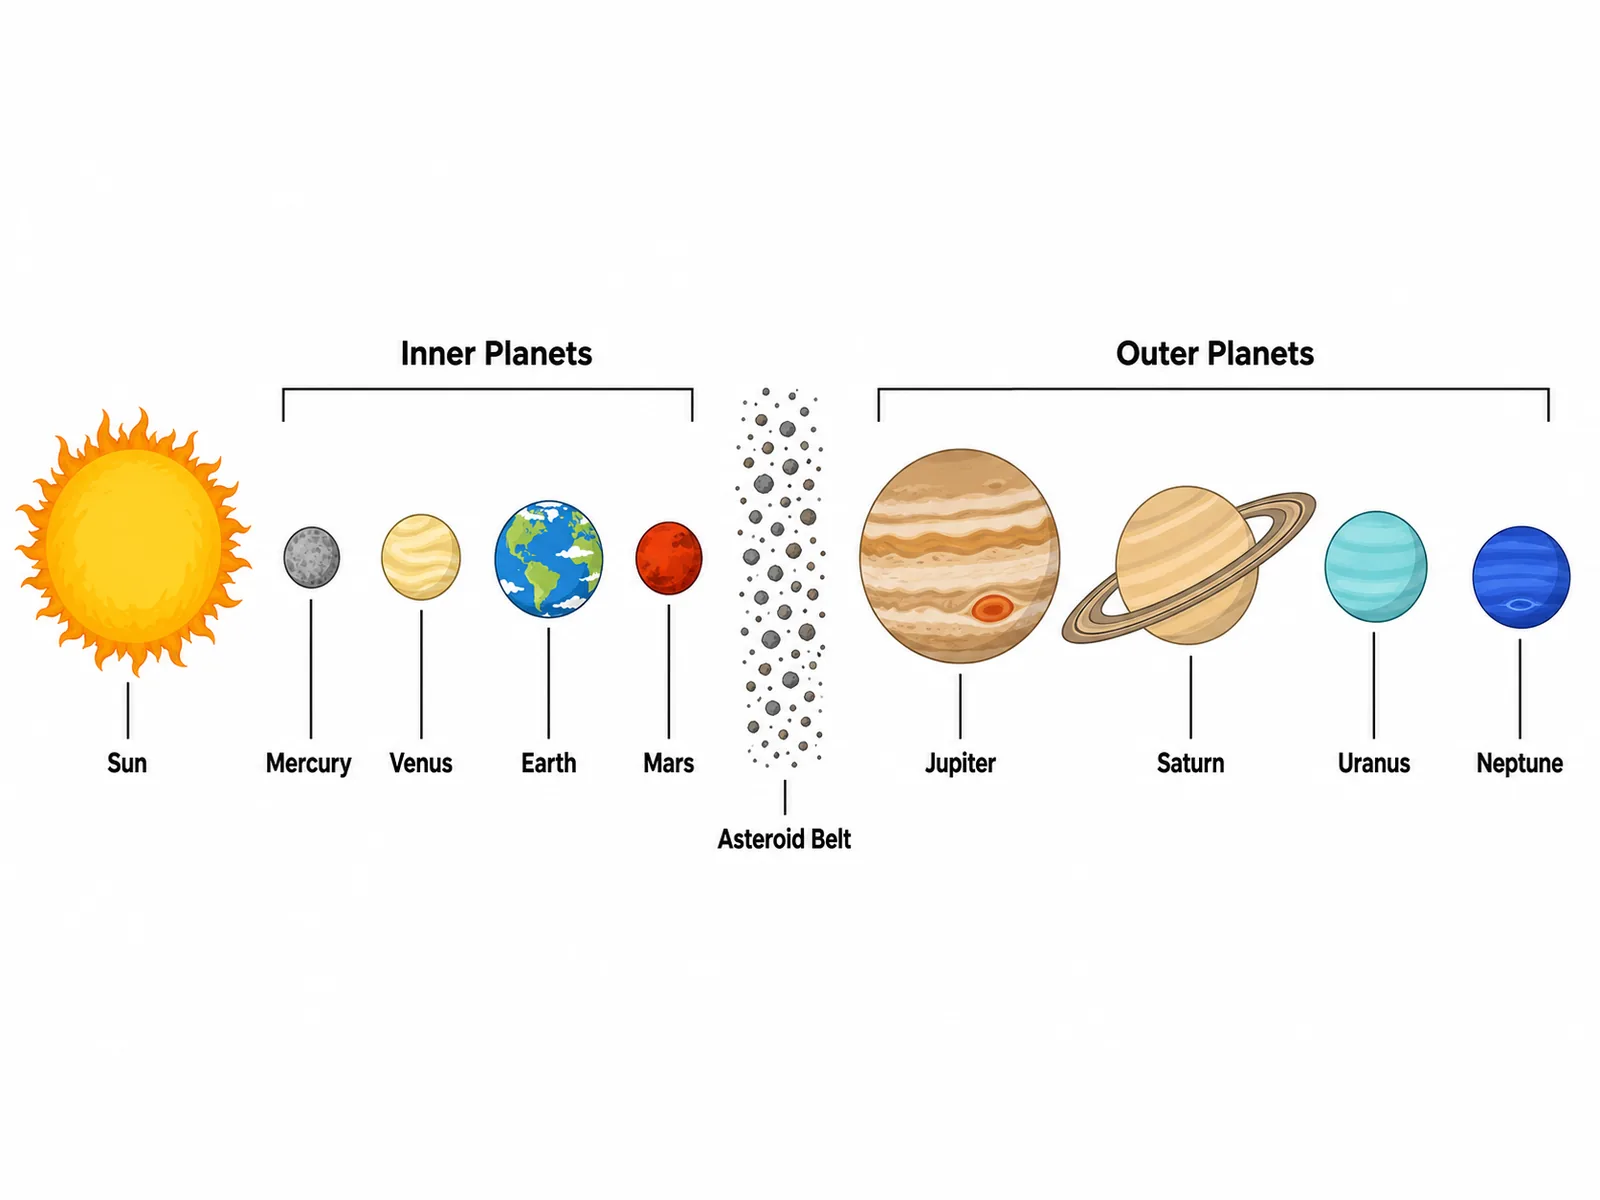
A labeled solar system diagram, a blank worksheet with empty answer boxes, the inner and outer planets on either side of the asteroid belt, the planets numbered in order, and an unlabeled version for coloring or a quiz.
Prompt
Create a labeled solar system orbit diagram seen from above, on a white background. Put the Sun at the centre and draw eight thin grey concentric orbits, one planet on each, in order from the Sun: Mercury, Venus, Earth, Mars, Jupiter, Saturn, Uranus, Neptune. Place the planets at different points around their orbits, with Jupiter the largest, broad rings on Saturn only, and Uranus and Neptune about the same size. Draw the asteroid belt as a ring of small grey dots between the orbits of Mars and Jupiter, labeled "Asteroid belt". Label the Sun and every planet in bold sans-serif text beside it, and add a small grey note in a corner reading "Orbits and planet sizes are not to scale".
Use this example
Prompt
Create a labeled solar system diagram on a white background. Draw the Sun as a large, glowing orange disc cut off by the left edge of the page and the eight planets in one horizontal row to its right, in order: grey Mercury, cream Venus, blue and green Earth, rust-red Mars, banded Jupiter with its Great Red Spot, pale gold Saturn with broad rings, pale cyan Uranus and deep blue Neptune. Keep the sizes in the right order, with Jupiter the largest, Uranus and Neptune about the same size and Mercury the smallest, and give broad rings to Saturn only. Drop a thin vertical leader line from each planet to its name in readable sans-serif text below the row, and label the Sun under its edge.
Planets in a rowElementary
Use this example
Prompt
Create a blank solar system diagram worksheet for students to label. Draw the Sun as a large glowing disc cut off by the left edge of a white page and the eight planets in one row to its right, in order from the Sun, with Jupiter the largest, broad rings on Saturn only, and Uranus and Neptune about the same size. Draw one thin leader line from each planet down to an empty rectangular answer box, eight boxes in a row along the bottom, and put no planet names, no key and no word bank anywhere on the image.
Blank worksheetPlanets in a rowElementary
Use this example
Prompt
Create an inner vs outer planets diagram on a white background. Draw the Sun on the left and the eight planets in one row in order. Group Mercury, Venus, Earth and Mars under a bracket titled "Inner Planets", draw the asteroid belt as a vertical band of small grey rocks between Mars and Jupiter labeled "Asteroid Belt", and group Jupiter, Saturn, Uranus and Neptune under a bracket titled "Outer Planets". Name the Sun and every planet below it with a thin leader line, keep Jupiter the largest and Uranus slightly larger than Neptune, and give broad rings to Saturn only.
Inner vs outer planets
Use this example
Prompt
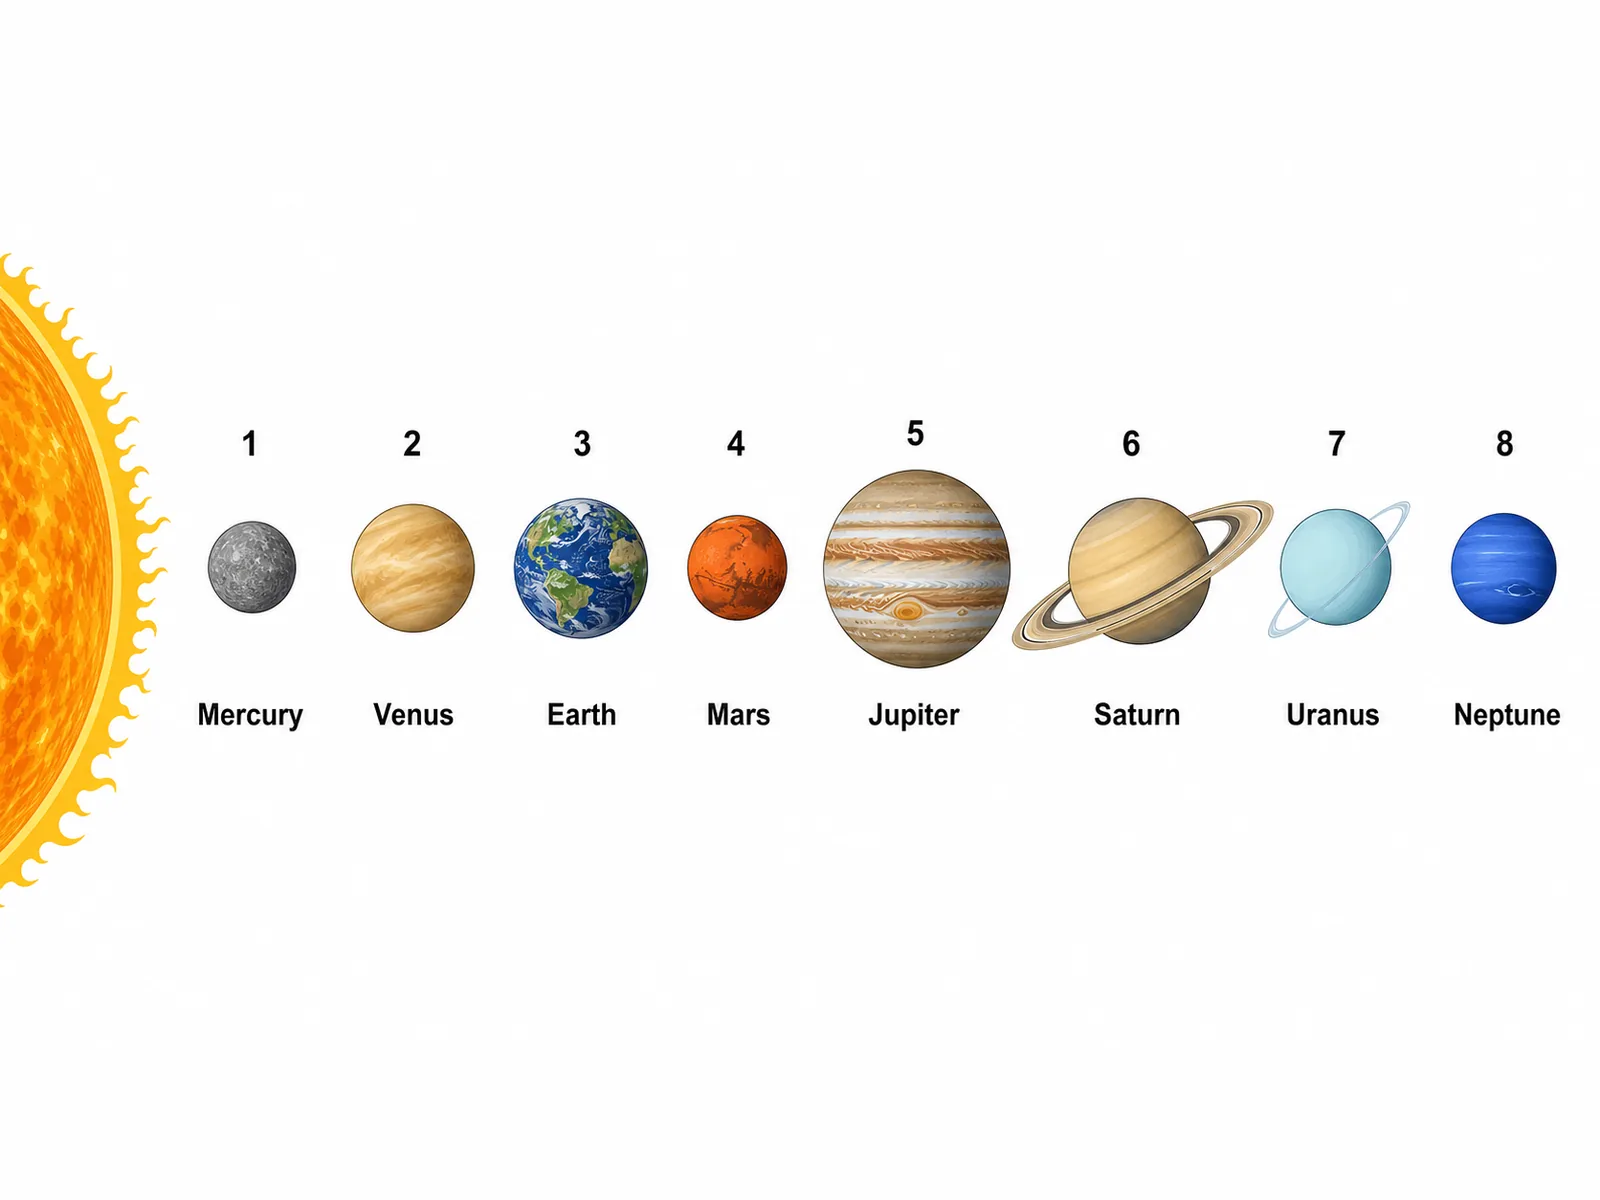
Create a planets-in-order diagram on a white background. Draw the edge of the Sun along the left side of the page and the eight planets in one row to its right, in order. Put a large bold number above each planet, 1 to 8 from Mercury to Neptune, and its name below it in bold sans-serif text. Give Saturn broad, bright rings and Uranus one thin, faint ring tilted almost upright, keep Jupiter the largest and Uranus slightly larger than Neptune, and add no other text.
Planets in a rowElementary
Use this example
Prompt
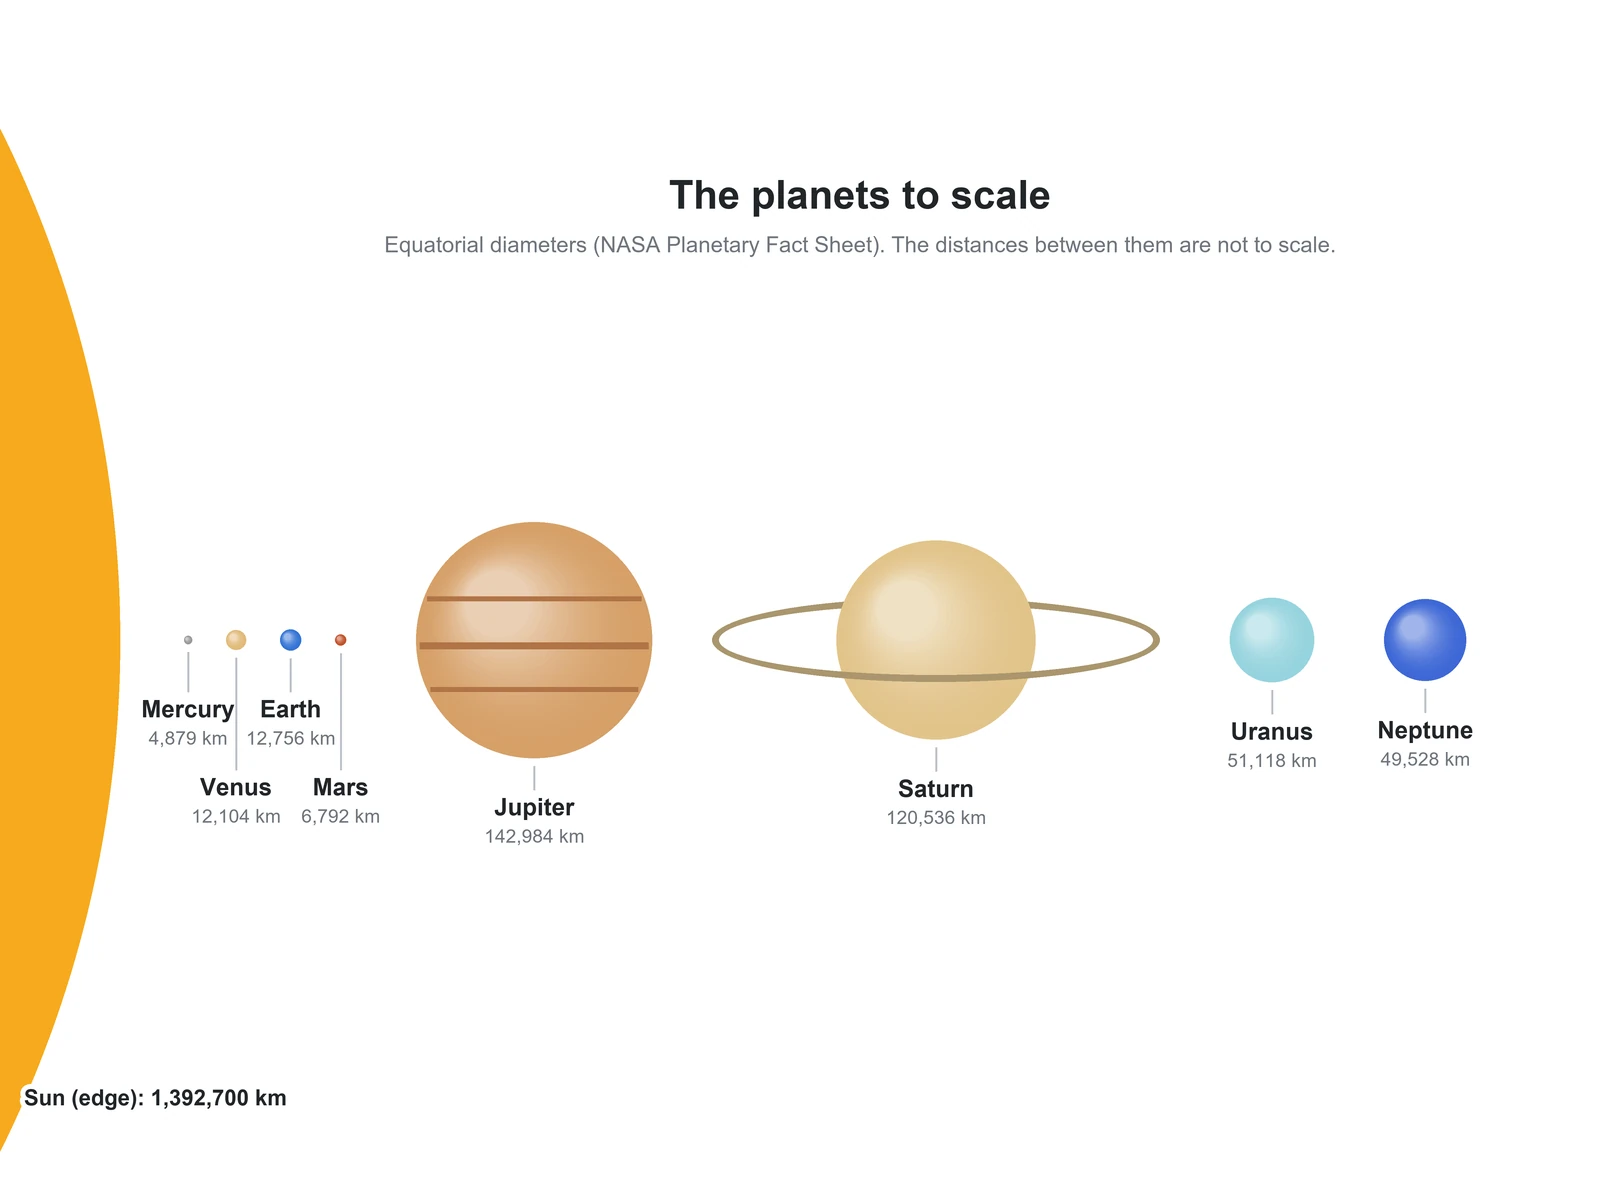
Create a planet size comparison drawn to scale on a white background, titled "The planets to scale". Draw a large curved orange edge of the Sun along the left side, then the eight planets side by side on one centre line in order from the Sun, each at its true relative size: Mercury 4,879 km, Venus 12,104 km, Earth 12,756 km, Mars 6,792 km, Jupiter 142,984 km with soft bands, Saturn 120,536 km with a thin tilted ring, Uranus 51,118 km and Neptune 49,528 km. Under each planet write its name in bold and its diameter in grey, staggering the labels of the four small inner planets on two rows so they do not overlap, and add a subtitle saying the diameters are to scale but the distances between the planets are not.
Size comparisonHigh school
Use this example
How to make a labeled or blank solar system diagram
1
Pick the layout, level, and labels
Orbits from above, planets in a row, a size comparison, inner vs outer planets, belts and dwarf planets, a true distance scale, or a solar system chart. Set the level, then choose labeled, numbered with a key, a blank worksheet, or a worksheet with a word bank.
2
Generate the diagram
The generator draws eight planets in the right order with their sizes in the right order, rings on Saturn, the asteroid belt between Mars and Jupiter and a "Not to scale" note, then adds names, numbers, or empty blanks.
3
Make the answer key, check, and export
For a worksheet, make the answer key from the same result so the numbers match. Count the planets, check the order and the belts, then download the PNG.
A solar system diagram is a labeled drawing of our solar system: the Sun at the centre, the eight planets that orbit it, and usually their orbits, the asteroid belt, and a few smaller bodies. It is one of the first figures anyone meets in earth and space science, because it fixes the order of the planets and shows at a glance which are small and rocky and which are giants.
Our solar system diagram comes in several standard forms. An orbit diagram looks down on the solar system from above. A row diagram lines the planets up beside the Sun. A size comparison shows how the planets measure up against each other, and a solar system chart sets out facts for each planet in columns. In class each of these is used in two ways: labeled, as a reference or an answer key, and blank, as a worksheet for students to fill in. This page makes all of them from one description.
The eight planets in order from the Sun
Each planet has a feature that makes it easy to recognise on a diagram, and these are the details the generator keeps.
Mercury: the smallest planet and the closest to the Sun, grey and cratered like our Moon, with no moons and the most stretched orbit of the eight.
Venus: almost Earth’s size, hidden under pale yellow clouds of sulfuric acid in a thick carbon dioxide atmosphere, and the hottest planet, at a mean 464 °C.
Earth: the only planet known to have liquid water on its surface and life, with one large Moon about a quarter of its width.
Mars: about half Earth’s width, rust-red from iron oxide in its dust, with polar ice caps and two small moons, Phobos and Deimos.
Jupiter: the largest planet, more than 11 Earths across, with cloud bands and the Great Red Spot, a storm larger than Earth.
Saturn: the second largest, famous for its broad, bright rings of ice and rock, and the least dense planet.
Uranus: a pale cyan ice giant tipped on its side, with an axial tilt of about 98 degrees, so it rolls around the Sun.
Neptune: a deep blue ice giant, the farthest planet at about 30 AU, taking about 164 years to go once around the Sun.
Inner planets vs outer planets
The asteroid belt divides the planets into two families. Most worksheets ask students to sort them, and a labeled diagram makes the split obvious.
Inner planets (Mercury, Venus, Earth, Mars) are the terrestrial planets: small, dense worlds of rock and metal with solid surfaces. They have no rings, and between them only three moons: Earth’s one and Mars’s two.
Outer planets (Jupiter, Saturn, Uranus, Neptune) are the giant planets. They have no solid surface, all four have rings, and each has many moons. Saturn has the most known moons.
Gas giants: Jupiter and Saturn are made mostly of hydrogen and helium, like the Sun.
Ice giants: Uranus and Neptune are smaller and contain more water, ammonia, and methane; methane in their atmospheres absorbs red light, which is why they look blue.
Why the split exists: in the young solar system it was too hot near the Sun for ices to freeze, so only rock and metal could clump into planets there. Farther out, beyond what astronomers call the frost line, ice added extra solid material, and the planets that formed grew large enough to hold on to hydrogen and helium gas.
Orbits: what a labeled orbit diagram should show
An orbit diagram is the classic solar system chart for a classroom wall. The orbits look like simple circles, but a few rules are worth getting right.
Each orbit is an ellipse with the Sun slightly off-centre, but for the planets the ellipses are so close to circles that drawing circles is fine. Mercury’s orbit is the most stretched; Venus’s is the most circular.
All eight planets orbit in the same direction and nearly in the same plane, so a side view of the solar system is almost flat. Mercury’s orbit is the most tilted, at 7 degrees to Earth’s.
The orbits get farther apart as you move out. Mercury, Venus, Earth, and Mars all fit within about 1.5 AU of the Sun; Jupiter is at 5.2 AU, Saturn at 9.6, Uranus at 19.2, and Neptune at 30.2.
Planets farther out move more slowly and have much longer paths, so a year gets longer outward: 88 days for Mercury, 365 for Earth, almost 12 years for Jupiter, and about 164 years for Neptune.
Because the outer orbits are so much wider, orbit diagrams squeeze them in. That is why a labeled orbit diagram should always carry a "Not to scale" note.
The asteroid belt, the Kuiper Belt, and the Oort Cloud
Three regions of small bodies appear on fuller diagrams. They are easy to put in the wrong place, so here is where each one belongs.
The main asteroid belt lies between Mars and Jupiter. It holds an estimated 1.1 to 1.9 million rocky asteroids wider than 1 km, plus many smaller ones, yet their combined mass is less than our Moon’s. Spacecraft cross it without trouble, because the asteroids are far apart.
The Kuiper Belt is a thick, doughnut-shaped region of icy bodies beyond Neptune. NASA puts its inner edge at Neptune’s orbit, about 30 AU from the Sun, and the end of its main region around 50 AU. Pluto was the first Kuiper Belt object found, in 1930.
The Oort Cloud is a vast, roughly spherical shell of icy, comet-like bodies surrounding the whole solar system. NASA describes it as extending from about 5,000 to 100,000 AU. It is far too distant to draw in proportion, so diagrams show it as an inset or an arrow pointing off the page.
Dwarf planets, and why Pluto was reclassified in 2006
In 2006 the International Astronomical Union defined a planet as a body that orbits the Sun, is massive enough for its own gravity to make it nearly round, and has cleared the neighborhood around its orbit of other objects of similar size. A dwarf planet passes the first two tests but not the third.
Pluto, discovered in 1930 and long counted as the ninth planet, became a dwarf planet under that definition, because it shares its region with the other icy bodies of the Kuiper Belt. NASA lists five recognized dwarf planets, in order from the Sun: Ceres, the only one in the inner solar system, which orbits in the asteroid belt; Pluto, Haumea, and Makemake in the Kuiper Belt; and Eris, which travels well beyond it. Pluto is 2,376 km across, about two-thirds the width of Earth’s Moon, and its orbit is tilted 17 degrees to the planets’ plane.
Scale and distance: why every orbit diagram is wrong on purpose
No single picture can show the planets’ sizes and their distances at the same scale. Put Neptune’s orbit 50 cm from the Sun and Earth sits 1.7 cm from the Sun, the Sun shrinks to a dot about 0.15 mm wide, and Earth to about 1.4 thousandths of a millimeter: invisible. Enlarge the planets so they can be seen and their orbits would need to be kilometers apart.
So diagrams choose. An orbit diagram or row diagram keeps the order and squeezes the distances. A size comparison keeps the sizes and drops the distances. A distance scale keeps the distances and shrinks the planets to dots. Each is honest if it says which it has done, which is why the generator adds a scale note to every layout.
OpenStax Astronomy’s one-billion scale model: the Sun is a ball about 1.4 m across, and Earth a 1.3 cm marble 150 m away.
At the same scale, Jupiter is a 14 cm ball about 780 m from the Sun, and Neptune a 5 cm ball 4.5 km away.
Light from the Sun reaches Earth in a little over 8 minutes and Neptune in about four hours.
Planet sizes compared
A size comparison is the one view where the planets can be drawn correctly against each other. These are the relationships a correct one shows.
Largest to smallest: Jupiter, Saturn, Uranus, Neptune, Earth, Venus, Mars, Mercury.
Jupiter is 11.2 times Earth’s width and Saturn 9.4 times. Uranus (4.0) is slightly wider than Neptune (3.9), although Neptune has more mass.
Venus is 95 percent of Earth’s width, so the two look like twins. Mars is about half of Earth, and Mercury just over a third.
The Sun is about 109 Earths across and about 10 Jupiters across, and it holds 99.8 percent of the mass of the whole solar system.
Pluto, 2,376 km across, is smaller than Earth’s Moon (3,475 km). Mercury, 4,879 km across, is smaller than Jupiter’s moon Ganymede and Saturn’s moon Titan.
Labels to use on a blank solar system diagram, by level
The number of labels should match the class. These are the sets the level menu uses when your description does not list its own.
Elementary: the Sun and the eight planets, nine labels in large text.
Middle school: the Sun, the eight planets, Earth’s Moon, the asteroid belt, and brackets for the inner and outer planets.
High school: adds the Kuiper Belt, the dwarf planets Ceres and Pluto, the groups terrestrial planets, gas giants, and ice giants, and each planet’s distance in AU.
Intro astronomy: adds the time for one orbit, Haumea, Makemake, and Eris, and an inset for the Oort Cloud.
Any level: a clean unlabeled drawing for coloring, a quiz read aloud, or a slide background.
Using a solar system worksheet in class
Start blank, end labeled: hand out the blank worksheet, then show the answer key made from the same result so every number matches.
Order first, facts second: have students number the planets from the Sun before they write the names.
Sort the families: use the inner vs outer layout to sort rocky planets from giants, then gas giants from ice giants.
Two views of scale: pair a size comparison with the distance scale so students see that each one leaves something out.
Build the chart: give students a blank solar system chart and the NASA fact sheet, and have them fill in the distance, size, and orbit columns.
Word bank or not: include one for a scaffolded lesson and leave it out for a test. It is alphabetical, so its order gives nothing away.
How the solar system formed
The solar system formed about 4.6 billion years ago from a collapsing cloud of gas and dust. Most of the material fell to the centre and became the Sun, which is why the Sun holds 99.8 percent of the mass. The rest flattened into a spinning disk, which is why the planets orbit in the same direction and nearly in one plane today. Within the disk, grains stuck together into larger and larger bodies, and the biggest swept up their surroundings to become the planets. The asteroid belt and the Kuiper Belt are leftovers from that time, material that never came together into a planet.
Most common mistakes on a solar system diagram
These are the errors image models, and many printed posters, make most often. Check each one before a diagram goes into graded work.
MistakeCorrect
MistakeNine planets, with Pluto in line after Neptune
CorrectEight planets; Pluto is a dwarf planet in the Kuiper Belt, smaller than the Moon
MistakeUranus and Neptune swapped, or Venus and Mercury
MistakeThe asteroid belt between Earth and Mars, or past Jupiter
CorrectThe main asteroid belt lies between Mars and Jupiter
MistakeSaturn-style rings on Jupiter, Uranus, or an inner planet
CorrectAll four giants have rings, but only Saturn’s are broad and bright; inner planets have none
MistakeNeptune drawn bigger than Uranus, or Mars as big as Earth
CorrectUranus is slightly wider than Neptune; Mars is about half Earth’s width
MistakeA Sun no bigger than Jupiter
CorrectThe Sun is about 10 Jupiters and 109 Earths across
MistakeEvenly spaced orbits with no scale note
CorrectThe gaps widen outward (Mars 1.5 AU, Jupiter 5.2 AU, Neptune 30 AU); say "Not to scale"
MistakeOrbit arrows pointing different ways
CorrectEvery planet orbits the Sun in the same direction
MistakeThe Kuiper Belt between the giant planets, or the Oort Cloud as a ring beside Neptune
CorrectThe Kuiper Belt starts at Neptune’s orbit; the Oort Cloud is a distant shell thousands of AU out
Solar system chart: the eight planets in order
Values from NASA’s planetary fact sheet. Distance is the average distance from the Sun; size is the equatorial diameter, with Earth = 1 in brackets.
Planet
Type
Distance from the Sun
Diameter (Earth = 1)
One orbit
Mercury
Terrestrial (rocky)
57.9 million km (0.39 AU)
4,879 km (0.38)
88 days
Venus
Terrestrial (rocky)
108.2 million km (0.72 AU)
12,104 km (0.95)
225 days
Earth
Terrestrial (rocky)
149.6 million km (1 AU)
12,756 km (1)
365 days
Mars
Terrestrial (rocky)
228.0 million km (1.52 AU)
6,792 km (0.53)
687 days
Jupiter
Gas giant
778.5 million km (5.2 AU)
142,984 km (11.2)
11.9 years
Saturn
Gas giant
1,432 million km (9.6 AU)
120,536 km (9.4)
29.4 years
Uranus
Ice giant
2,867 million km (19.2 AU)
51,118 km (4.0)
84 years
Neptune
Ice giant
4,515 million km (30.2 AU)
49,528 km (3.9)
164 years
Solar System Diagram FAQ
At minimum, the Sun and the eight planets in order: Mercury, Venus, Earth, Mars, Jupiter, Saturn, Uranus, and Neptune, each named. Most school diagrams also draw each planet’s orbit, the asteroid belt between Mars and Jupiter, and Saturn’s rings, and many add Earth’s Moon, the Kuiper Belt beyond Neptune, and the dwarf planets Ceres and Pluto. A good diagram also says that it is not to scale, because no page can show the real sizes and distances together.
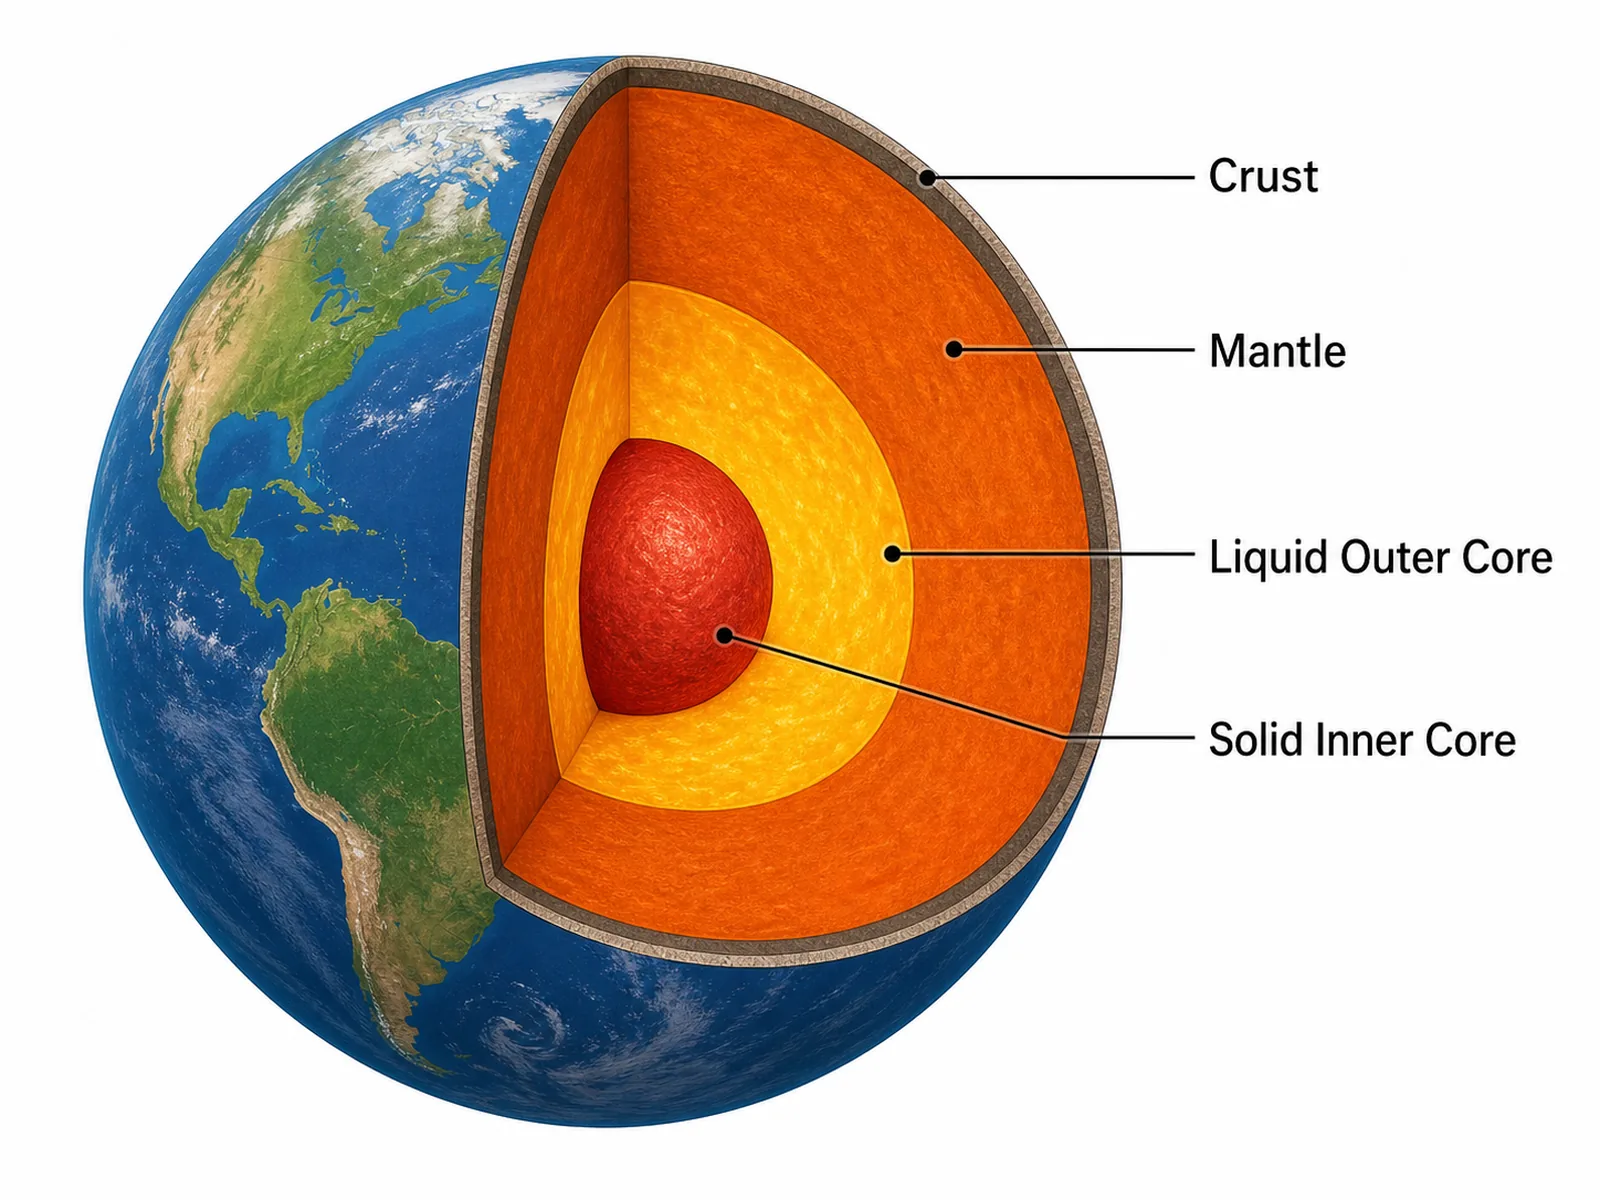
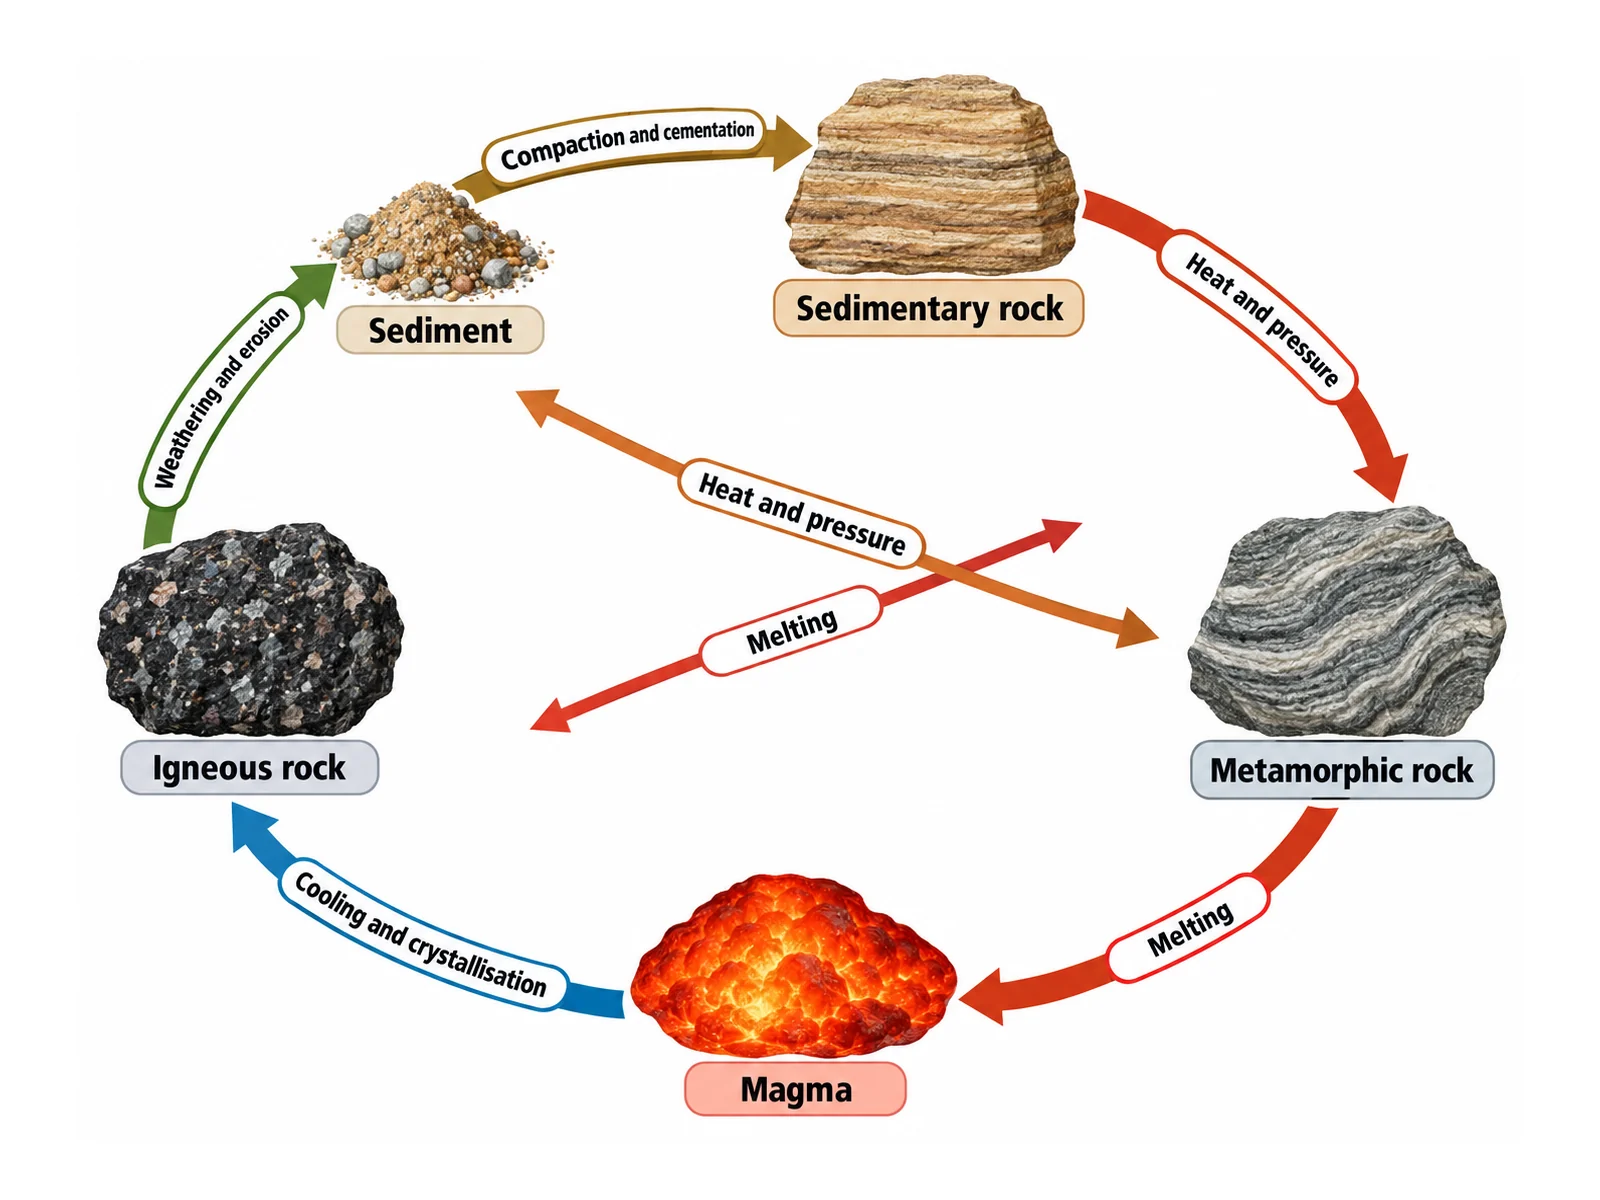
Generate earth science diagrams, cycles, blank labeling worksheets with matching answer keys, and revision-ready science figures with the same SciFigure AI workflow.