1
Upload your table
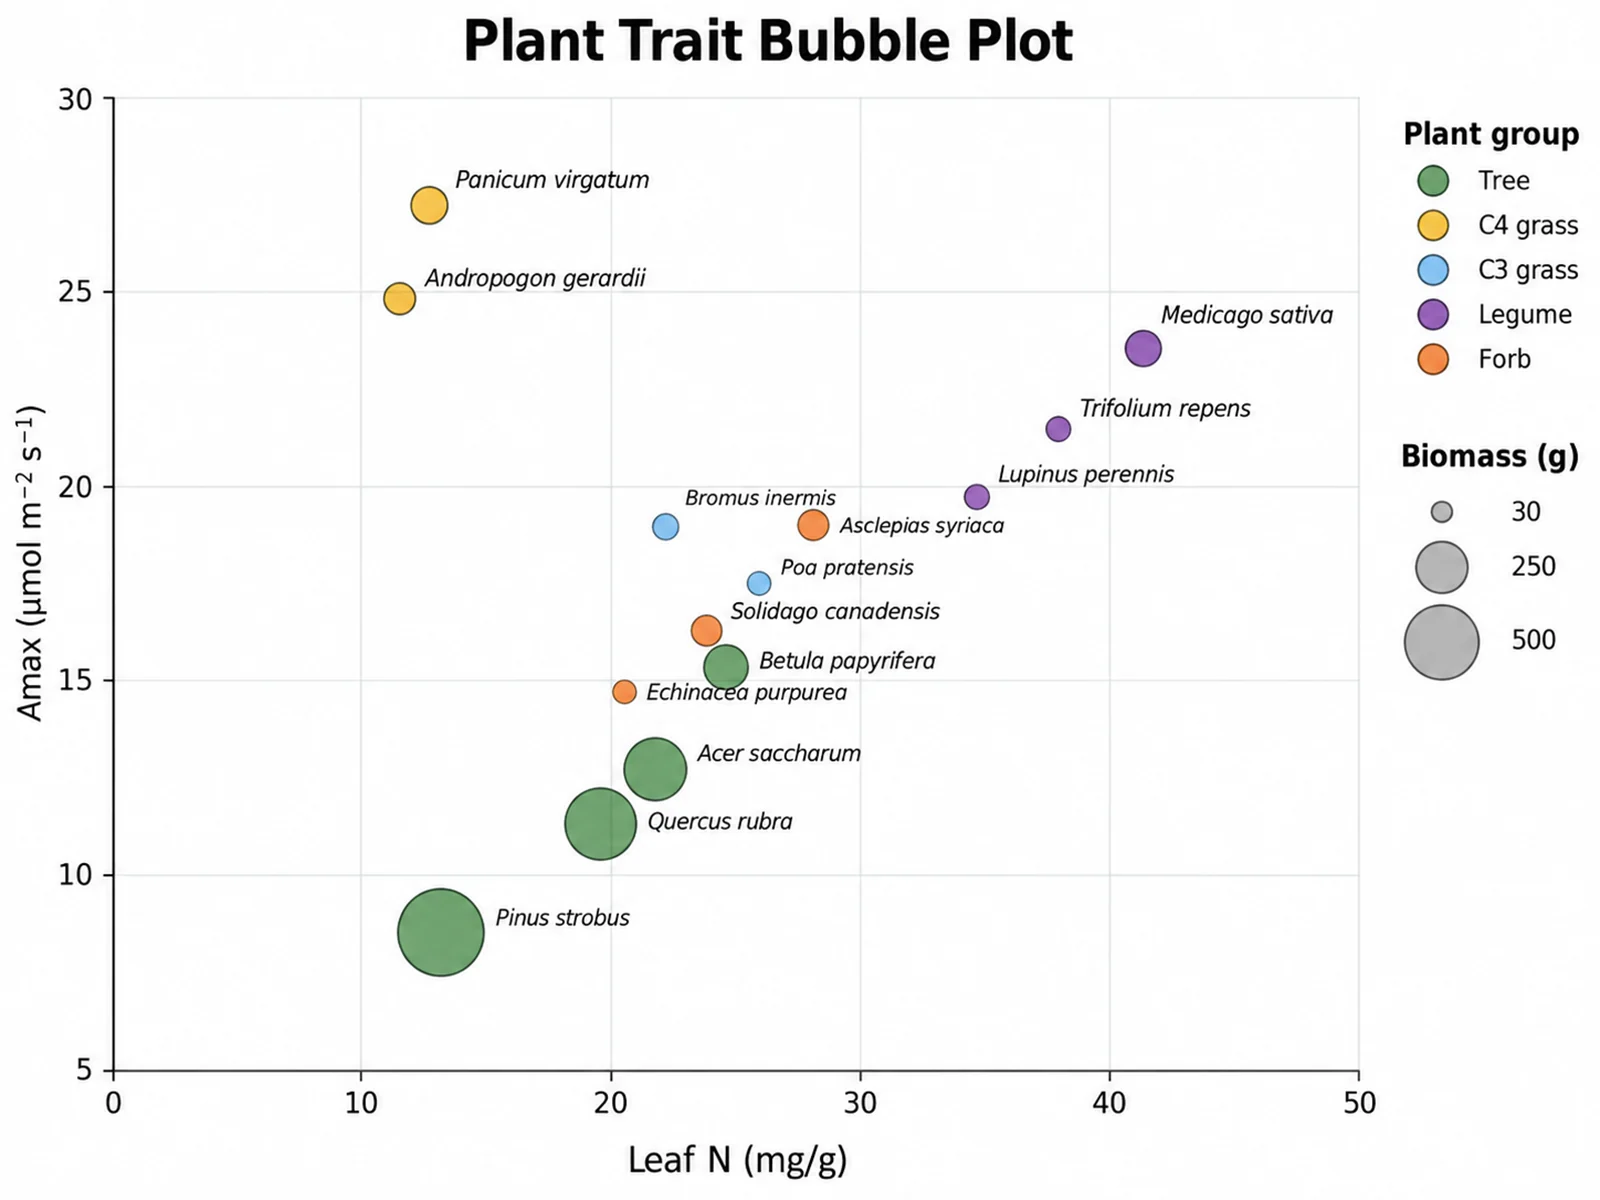
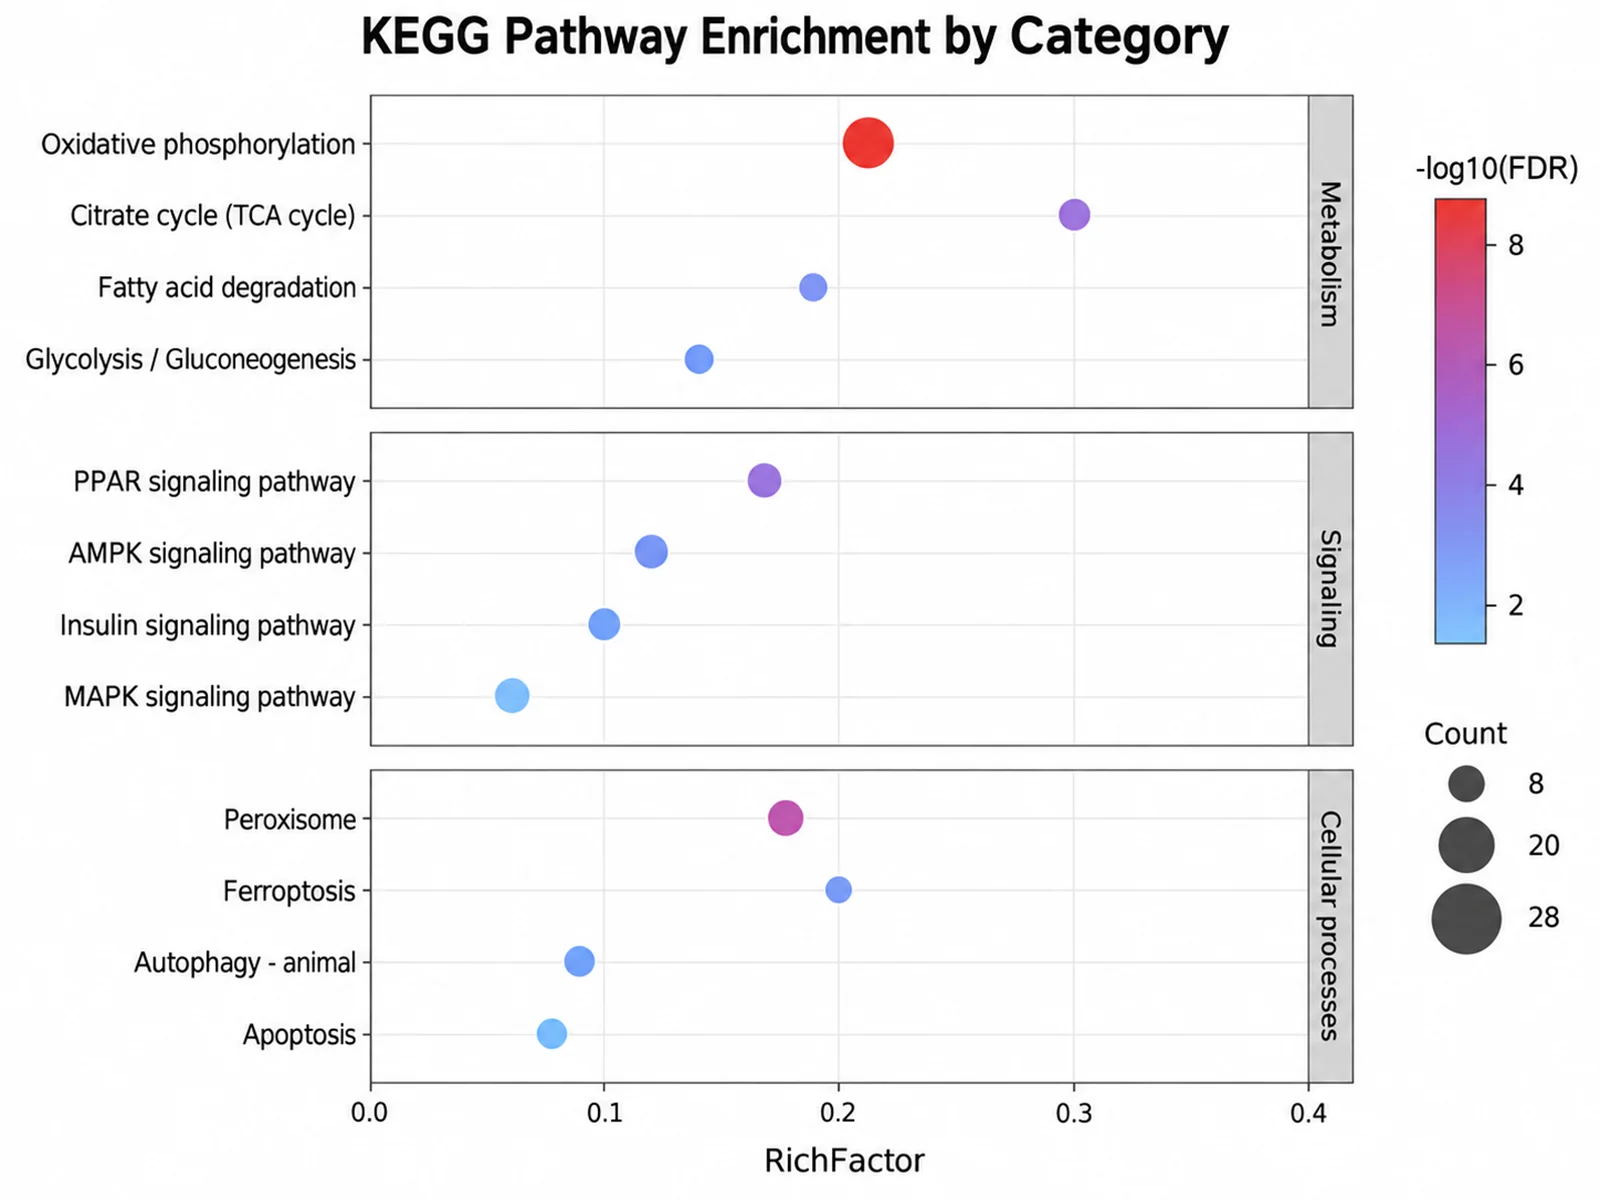
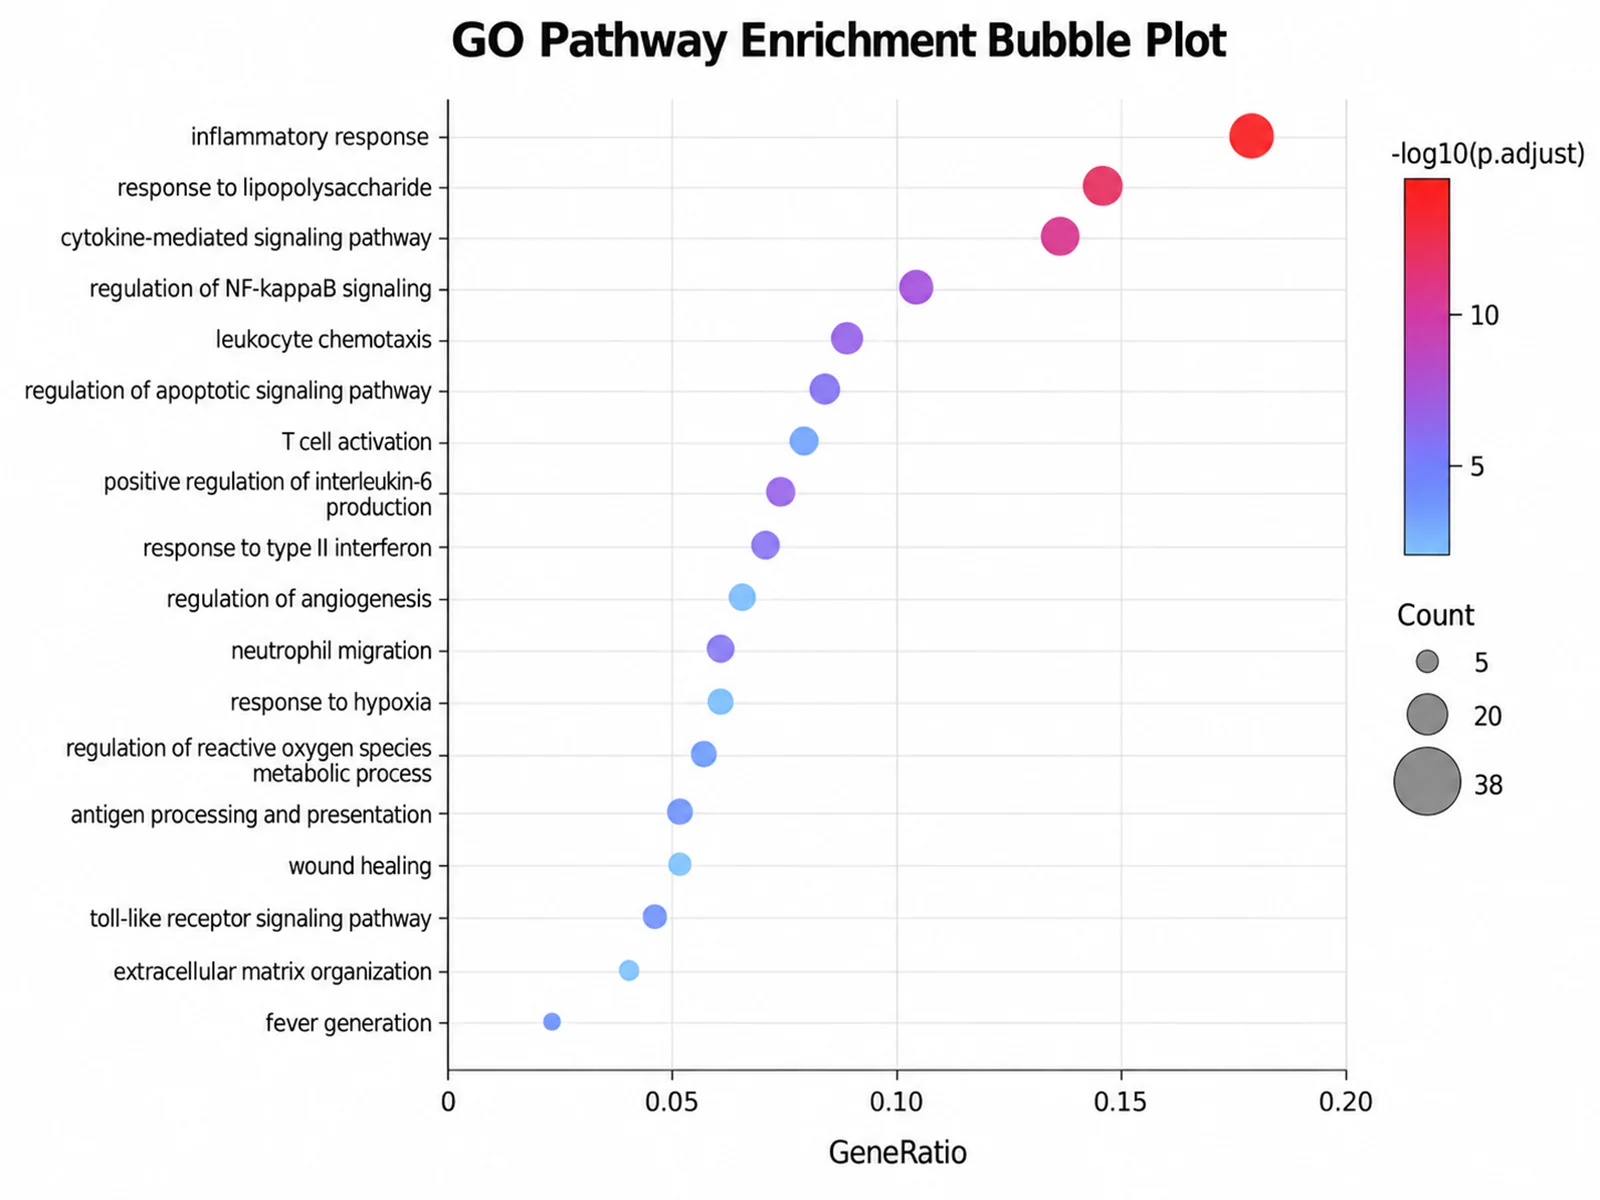
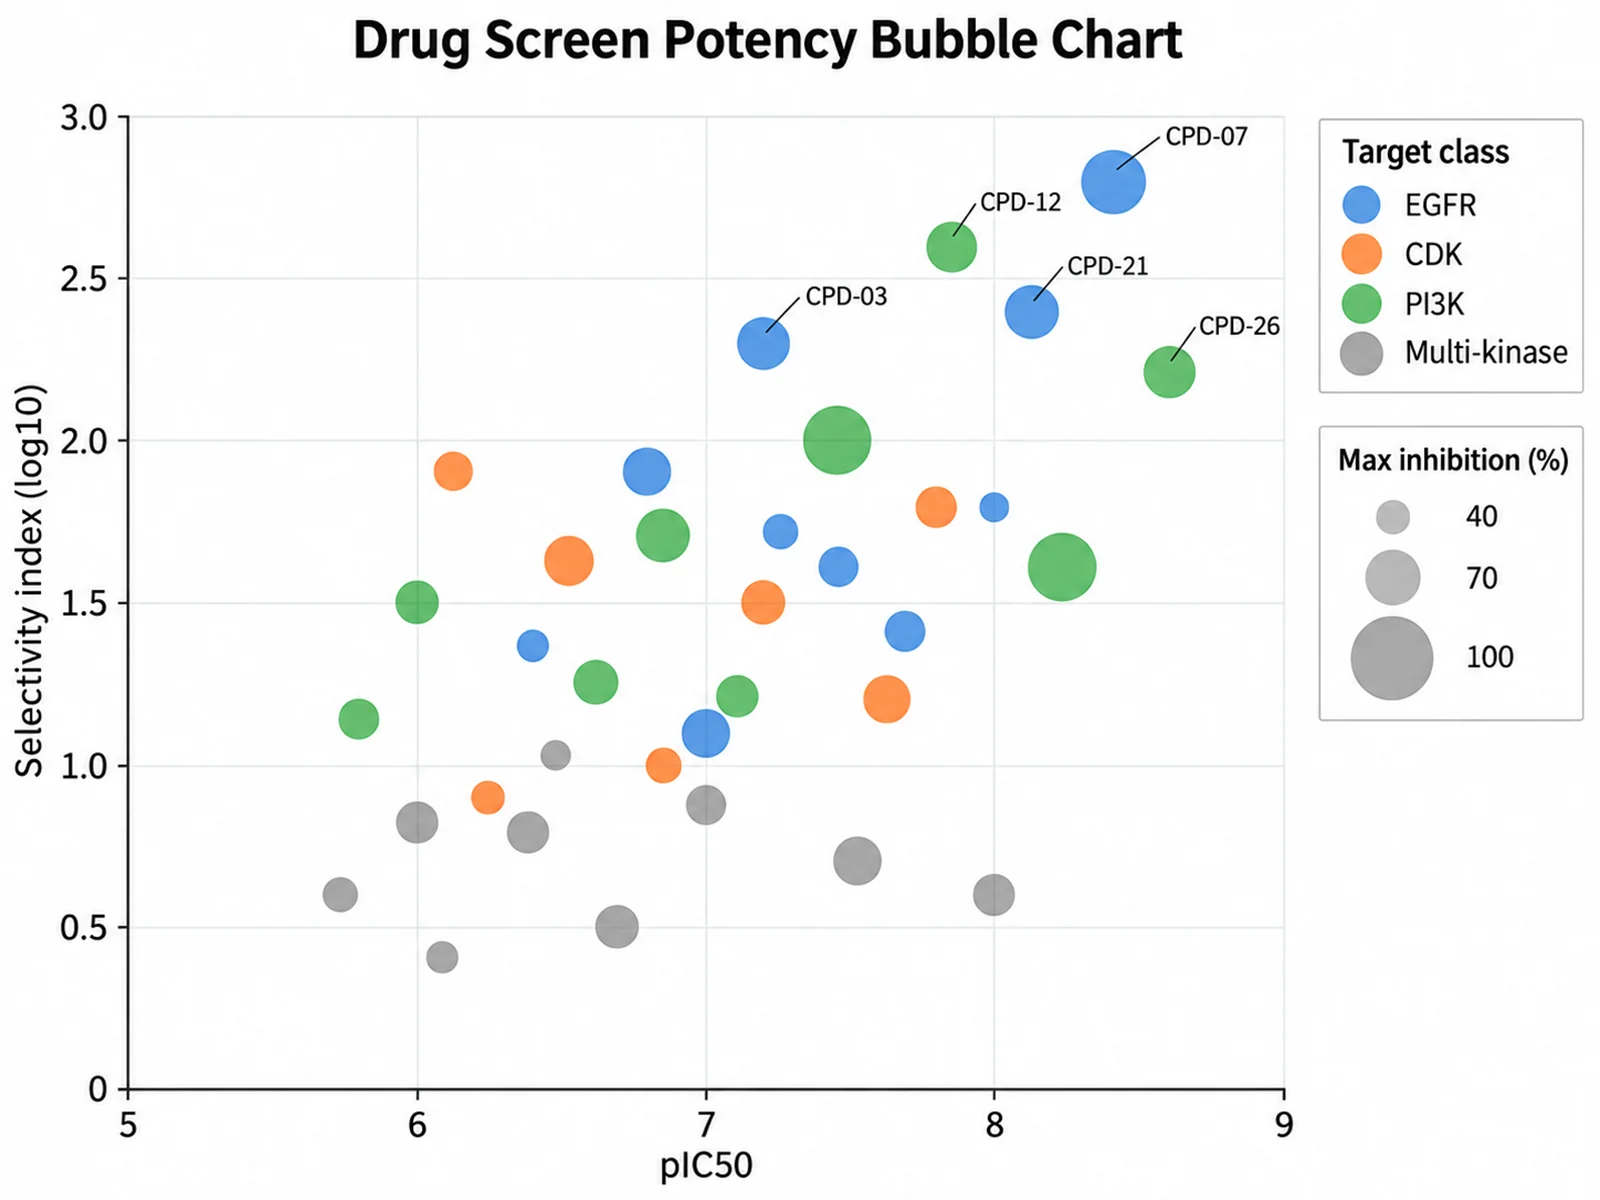
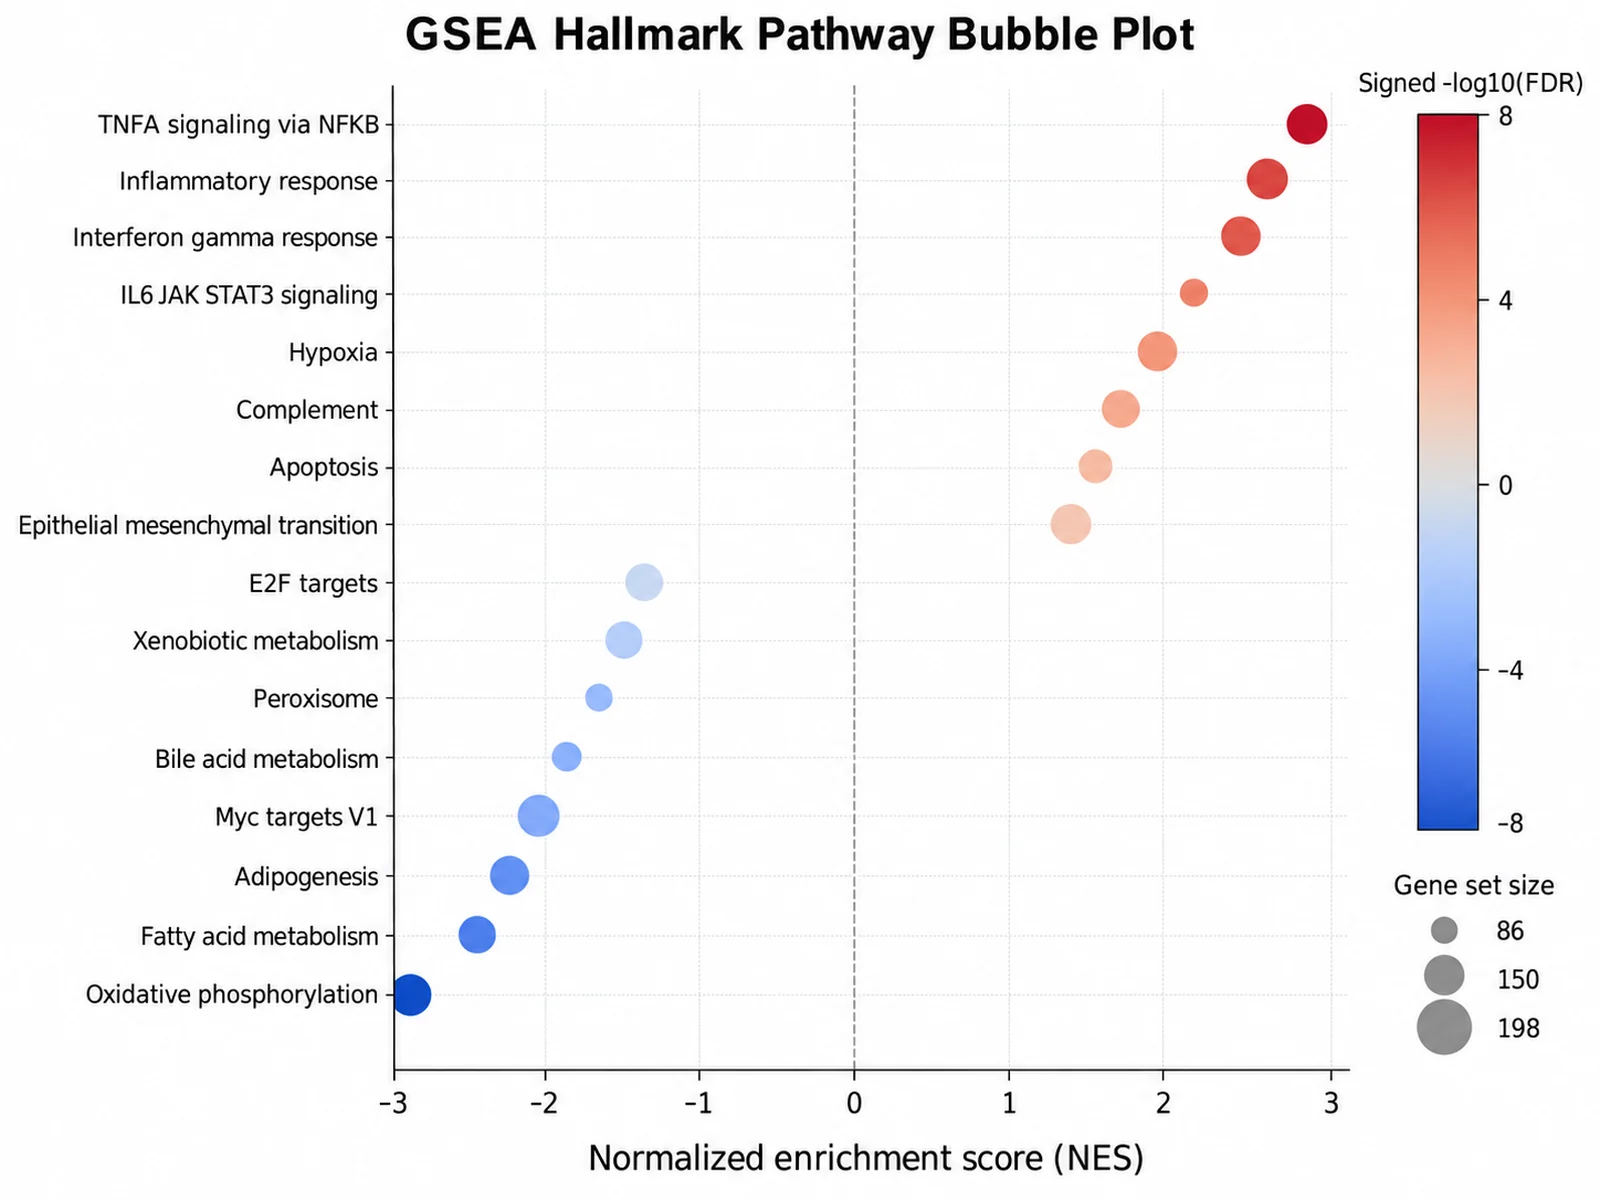
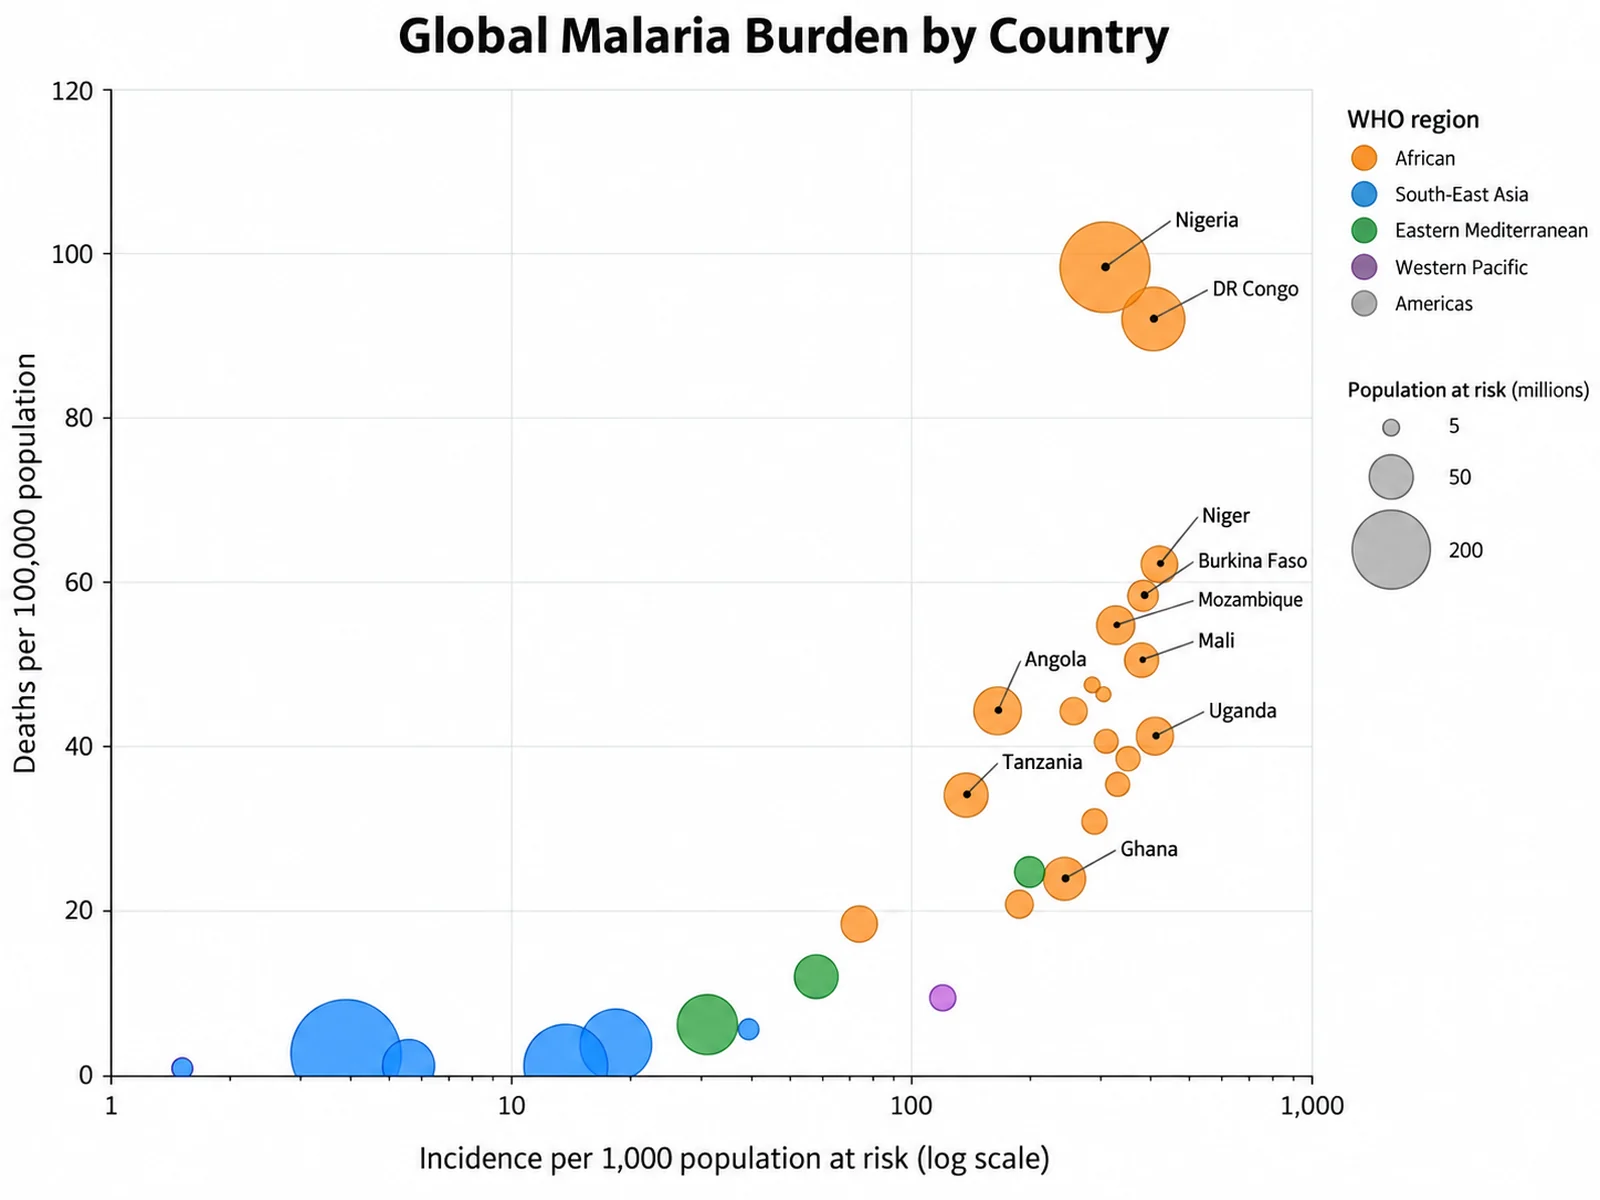
Add CSV, TSV, TXT, or Excel data. For enrichment, include term, gene ratio or rich factor, gene count, and adjusted p-value columns. For a numeric bubble graph, include x, y, and size columns.
2
Map columns and describe the chart
Confirm the x, y, size, label, and group roles, then describe term ordering, colors, labels, and log axes in plain language.
3
Generate, review & download
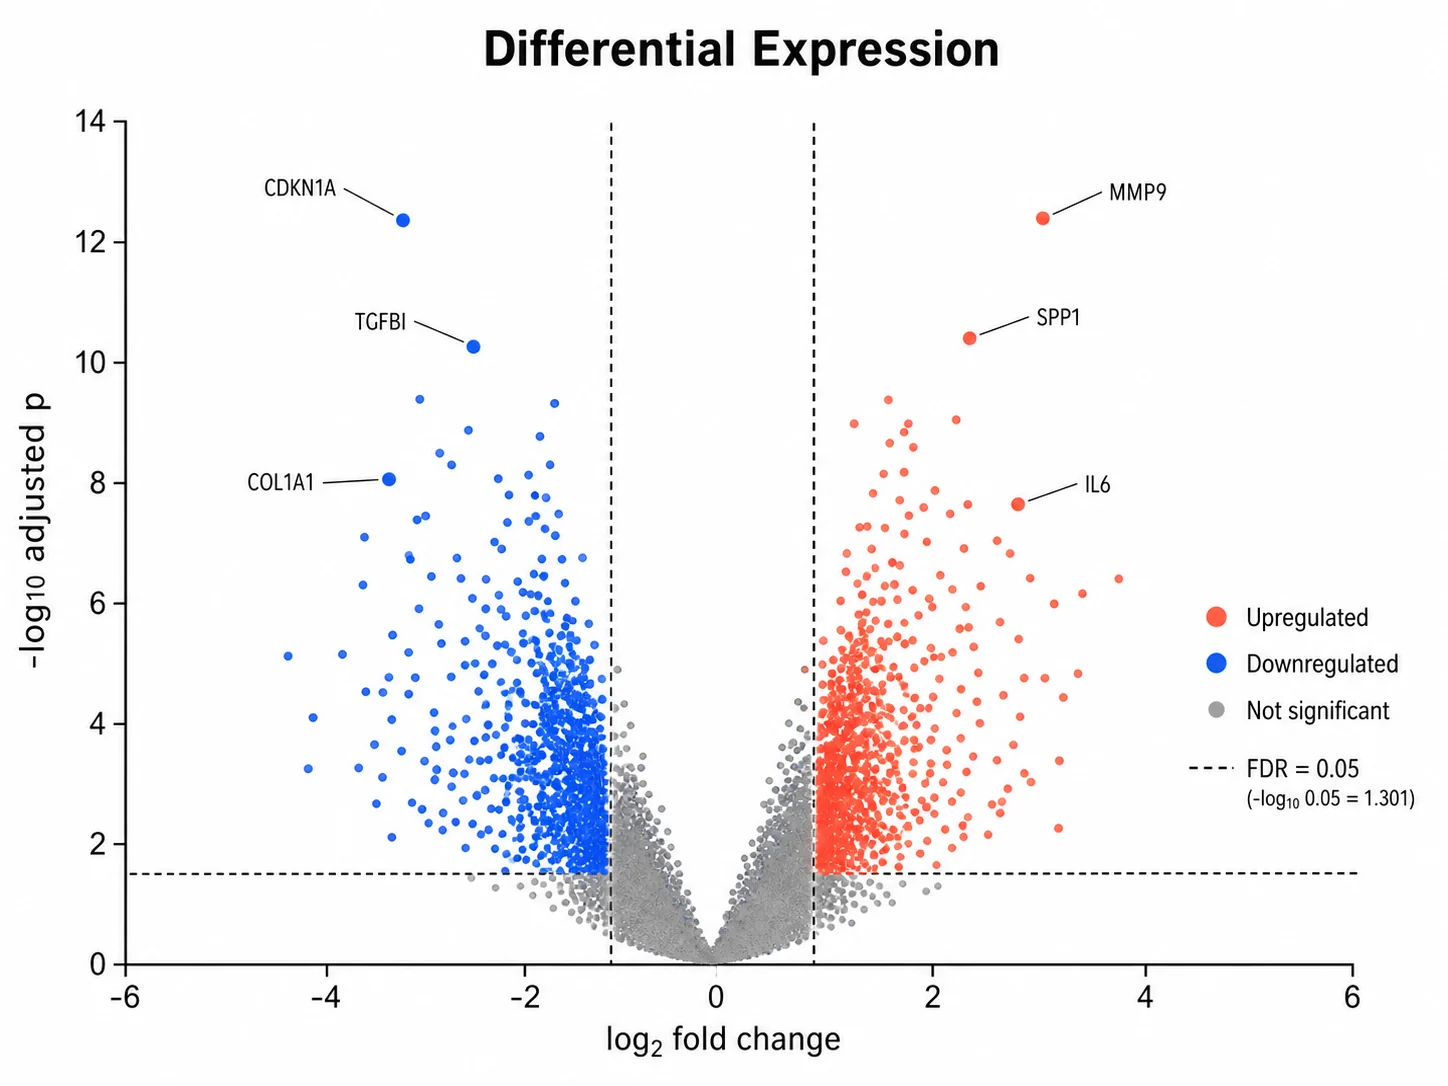
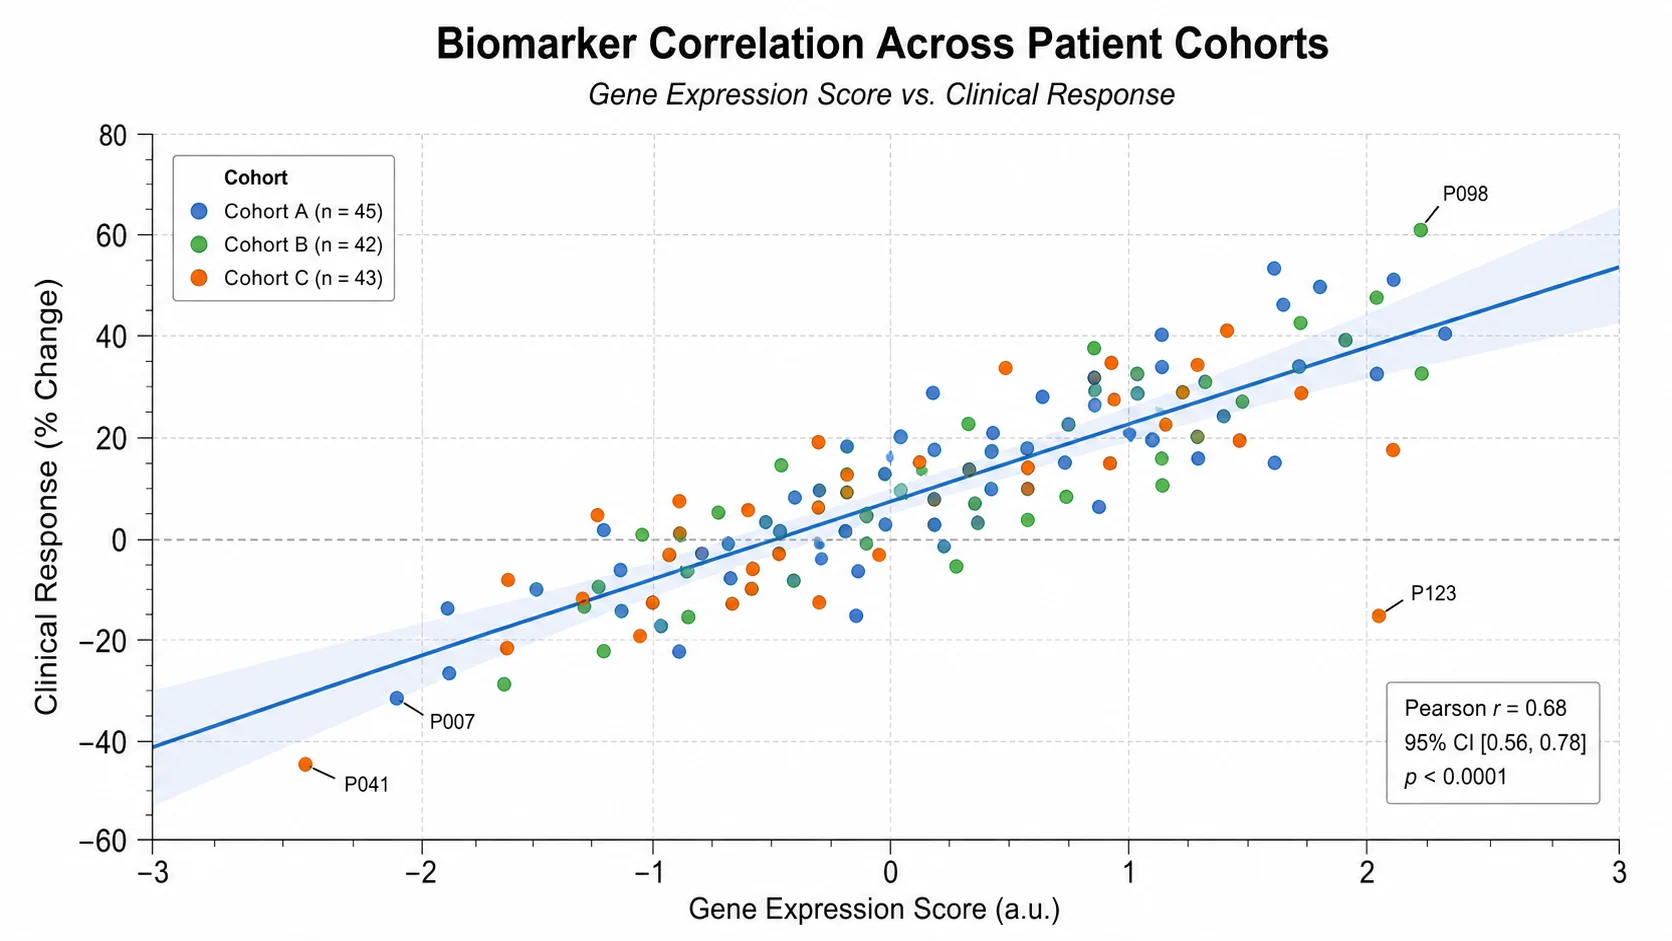
SciFigure computes bubble sizes and scales, draws the figure, and lets you download a PNG for manuscripts, posters, and slides.