
Free lab tool
96 well plate template you can edit and export
Click or drag to assign samples on a 96 well plate map, name each group, and export the layout as a PNG for your lab notebook, an SVG for a figure, or a CSV for your plate reader. Also covers 384, 48, 24, 12, and 6 well plates. Everything runs in your browser and nothing is uploaded.
Click a well to assign it, or drag to paint a block. Click a row letter or column number to fill the whole row or column. 0 of 96 wells filled.
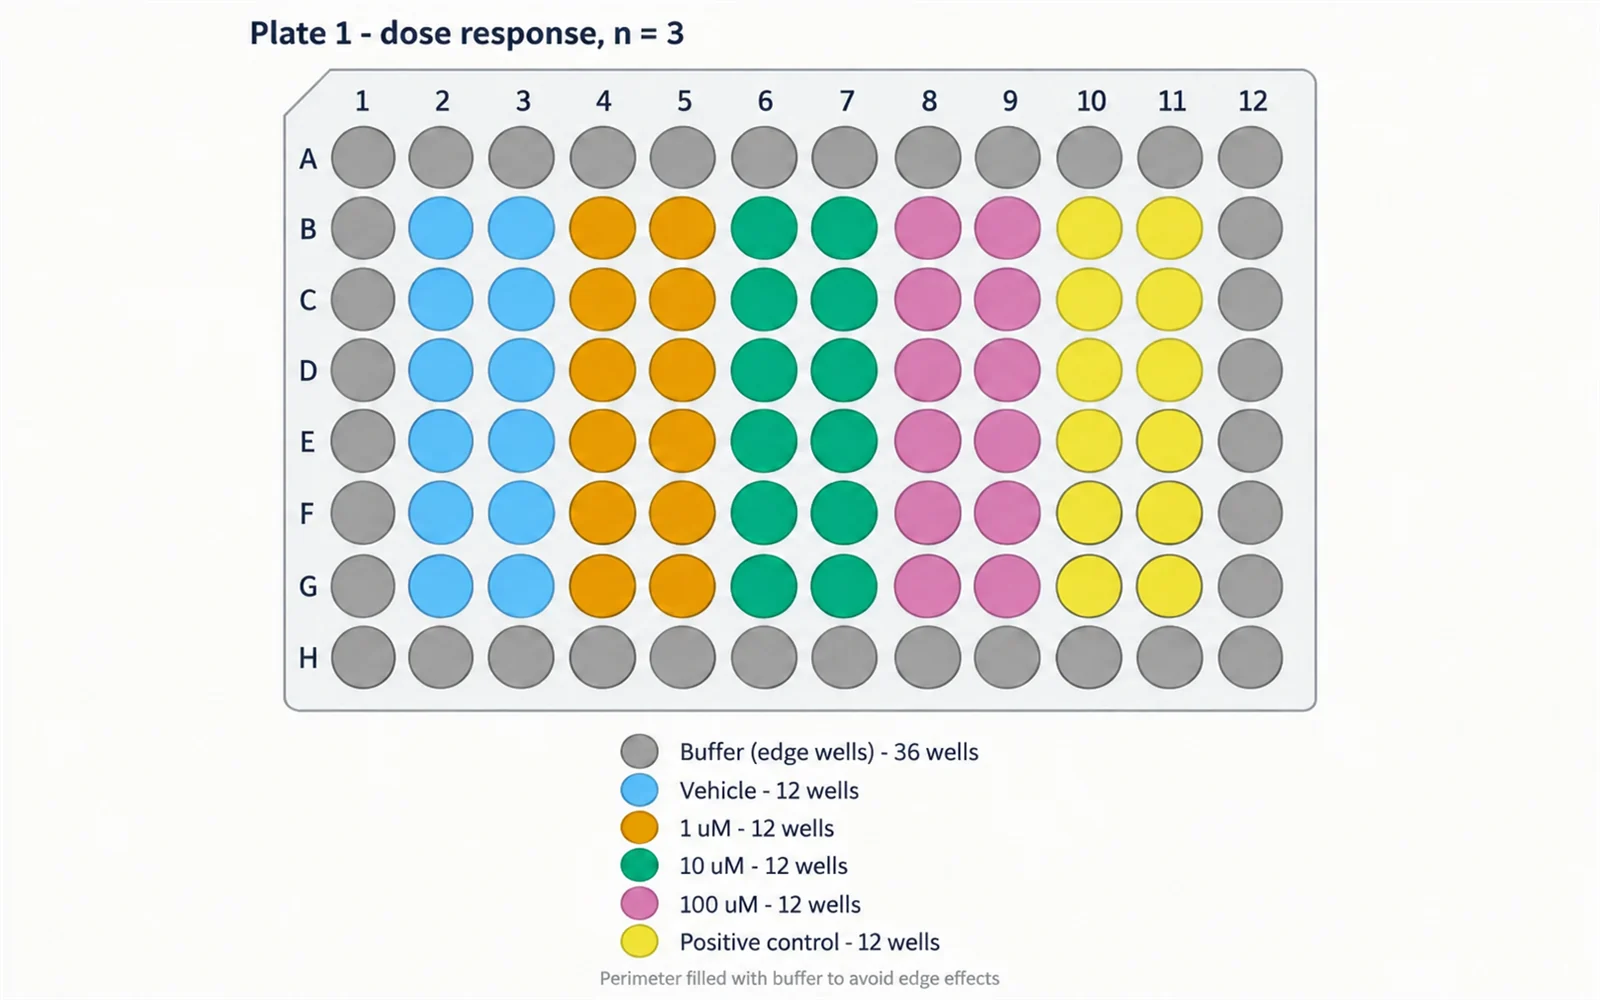
How to use the 96 well plate template
The plate above starts as an empty 96 well grid, eight rows lettered A to H and twelve columns numbered 1 to 12. Assign wells to named sample groups, and the tool keeps the counts and the well ranges for you.
- Pick the plate format. 96-well is the default; the same tool also draws 384, 48, 24, 12, and 6 well plates.
- Name your groups in the Samples panel. Add as many as you need, and rename them in place — the names appear in the legend and the CSV.
- Click a well to assign it, or press and drag to paint a whole block in one motion.
- Click a row letter or a column number to fill that entire row or column at once.
- Use Auto-fill to drop a fixed number of replicates into the next free wells, down columns or across rows.
- Select the eraser to clear wells instead of assigning them.
- Export the finished map: PNG for a notebook or slide, SVG for a figure you will edit later, Grid CSV that mirrors the plate shape, or List CSV with one row per filled well.
Well naming and plate formats
Microplate dimensions are standardised, which is why a plate map from one lab loads correctly on another lab’s reader. The ANSI/SLAS 1-2004 and 4-2004 standards fix the footprint and the well positions, so a 96 well plate is always 8 rows by 12 columns on a 9 mm centre-to-centre pitch, and a 384 well plate is 16 by 24 on a 4.5 mm pitch.
- Wells are named by row letter then column number, so A1 is the top-left well and H12 is the bottom-right well of a 96 well plate.
- On a 384 well plate the rows run A to P and the columns 1 to 24, so the last well is P24.
- 6-well: 2 × 3, 39.12 mm pitch. 12-well: 3 × 4, 26 mm. 24-well: 4 × 6, 19.3 mm. 48-well: 6 × 8, 13 mm.
- The bevelled corner drawn at A1 in the export matches the notched corner moulded into a real plate, which is how you check a plate is the right way round before reading it.
- Multichannel pipettes and most plate readers work down columns, so the default auto-fill order is A1, B1, C1 and on down column 1 before moving to column 2.
Designing a plate layout that survives analysis
A plate map is not only a record of what went where. Position effects are real, and a layout that ignores them can turn a plate artefact into an apparent treatment effect.
- Edge effects are the most common problem. Outer wells evaporate faster and sit at a different temperature, which shifts readings in row A, row H, column 1, and column 12. Many protocols fill the perimeter with buffer and use only the inner 60 wells.
- Randomise or at least stagger treatment positions across the plate rather than giving each treatment its own block. A treatment confined to one column cannot be separated from a column effect.
- Keep replicates of the same condition in different rows and columns where the design allows it.
- Reserve wells for controls before you place samples: a blank for background subtraction, a negative control, and a positive control on every plate, not only on the first plate of a run.
- Record the map at the time you pipette, not afterwards. Exporting the CSV alongside the raw reader output is what makes a result traceable months later.
Getting the layout into your analysis
The two CSV exports exist because plate software and statistics software want the same information in different shapes.
- Grid CSV reproduces the plate: a header row of column numbers, then one line per plate row. It pastes straight into a spreadsheet next to a reader export that uses the same shape.
- List CSV is long format, one line per filled well, with well, row, column, and sample columns. This is the shape R, Python, and most LIMS imports expect.
- Both exports use your group names verbatim, so keep them consistent with the sample names in your analysis script.
- The SVG export is plain vector output with real text, so labels stay editable in Illustrator, Inkscape, or PowerPoint if the map is going into a figure.
Frequently asked questions
Is this 96 well plate template free?
Yes. The plate editor runs entirely in your browser, needs no account, and has no watermark or export limit. Nothing you type is uploaded to a server.
How many wells does a 96 well plate have in each row?
Twelve. A 96 well plate is eight rows (A to H) by twelve columns (1 to 12). A 384 well plate is sixteen rows (A to P) by twenty-four columns.
Can I make a 384, 48, 24, 12, or 6 well plate map?
Yes. Pick the format above the grid and the tool redraws the plate with the correct rows, columns, and well naming. Switching format clears the current layout, so export first if you want to keep it.
Can I export the plate map to Excel?
Yes. Grid CSV keeps the plate shape, so it opens in Excel looking like the plate. List CSV gives one row per filled well with well, row, column, and sample columns, which suits pivot tables, R, and Python.
Can I print the template as a blank plate to fill in by hand?
Yes. Leave every well unassigned and export the PNG or SVG. You get a clean numbered grid with row letters, column numbers, and the A1 bevel, ready to print and annotate at the bench.
Why do people leave the outer wells of a 96 well plate empty?
Because of edge effects. Wells on the perimeter lose more liquid to evaporation and equilibrate to a different temperature than inner wells, which biases readings. A common mitigation is to fill the outer ring with buffer or medium and place samples only in the inner 60 wells.
Does the layout save if I close the tab?
No. The layout lives only in the page while it is open, because nothing is sent to a server. Export the PNG, SVG, or CSV before you leave, and keep the CSV with your raw data.
Related tools
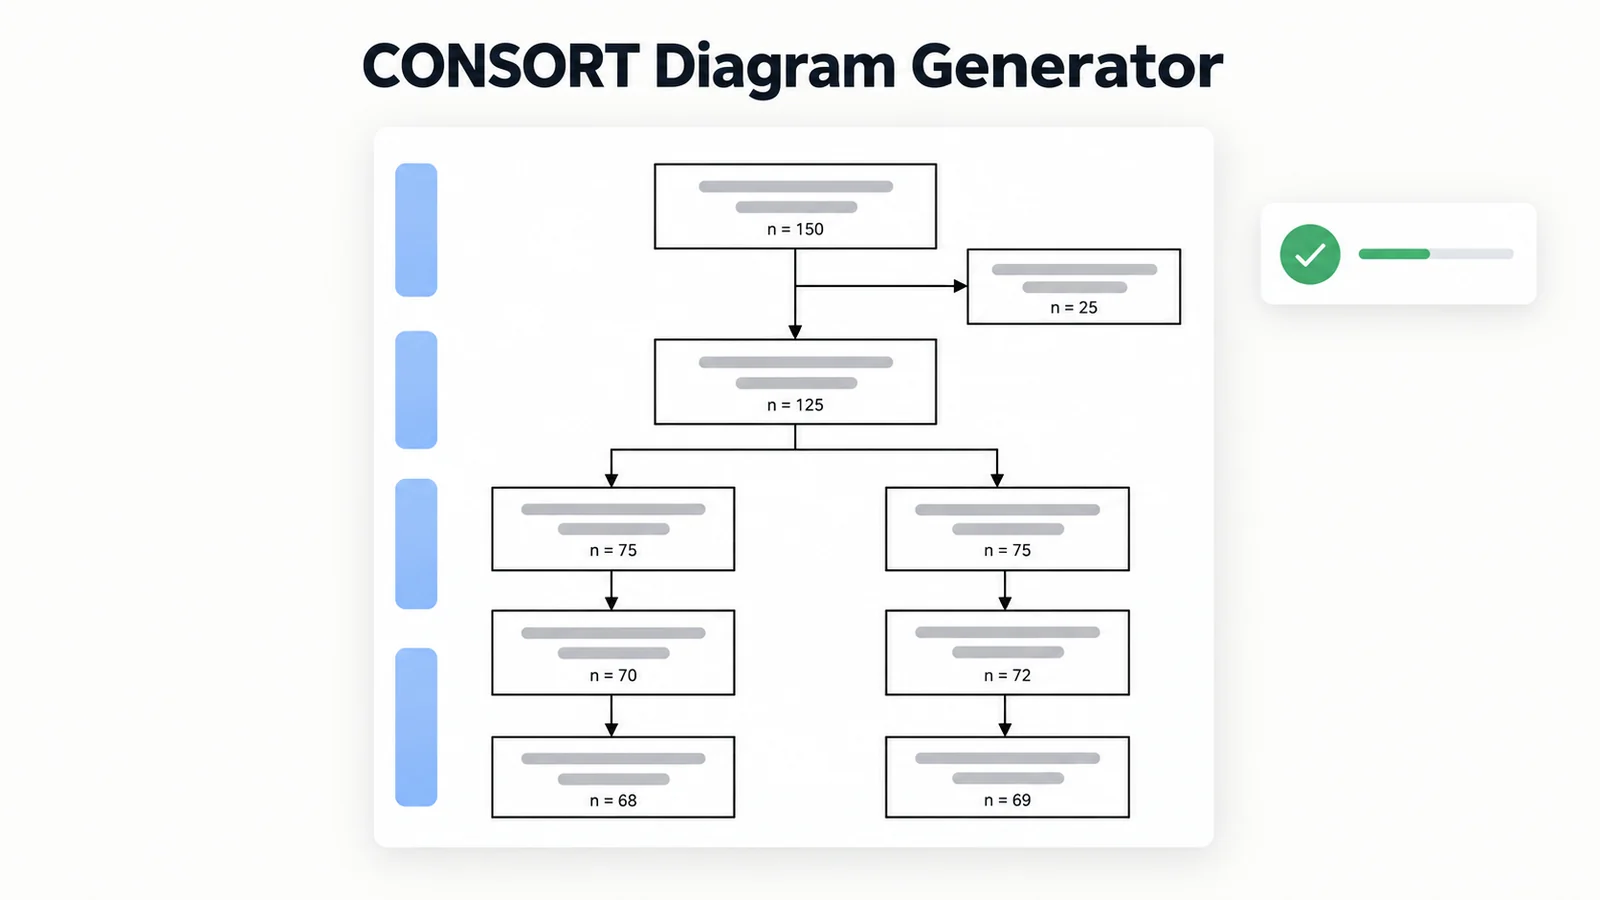
CONSORT Diagram Generator
Build a CONSORT participant flow diagram for a randomised trial and export it.
Journal Figure Requirements
Compare figure size, resolution, and format rules across 14 publishers.
Image DPI Checker
Check whether a figure meets a journal DPI requirement at its print width.
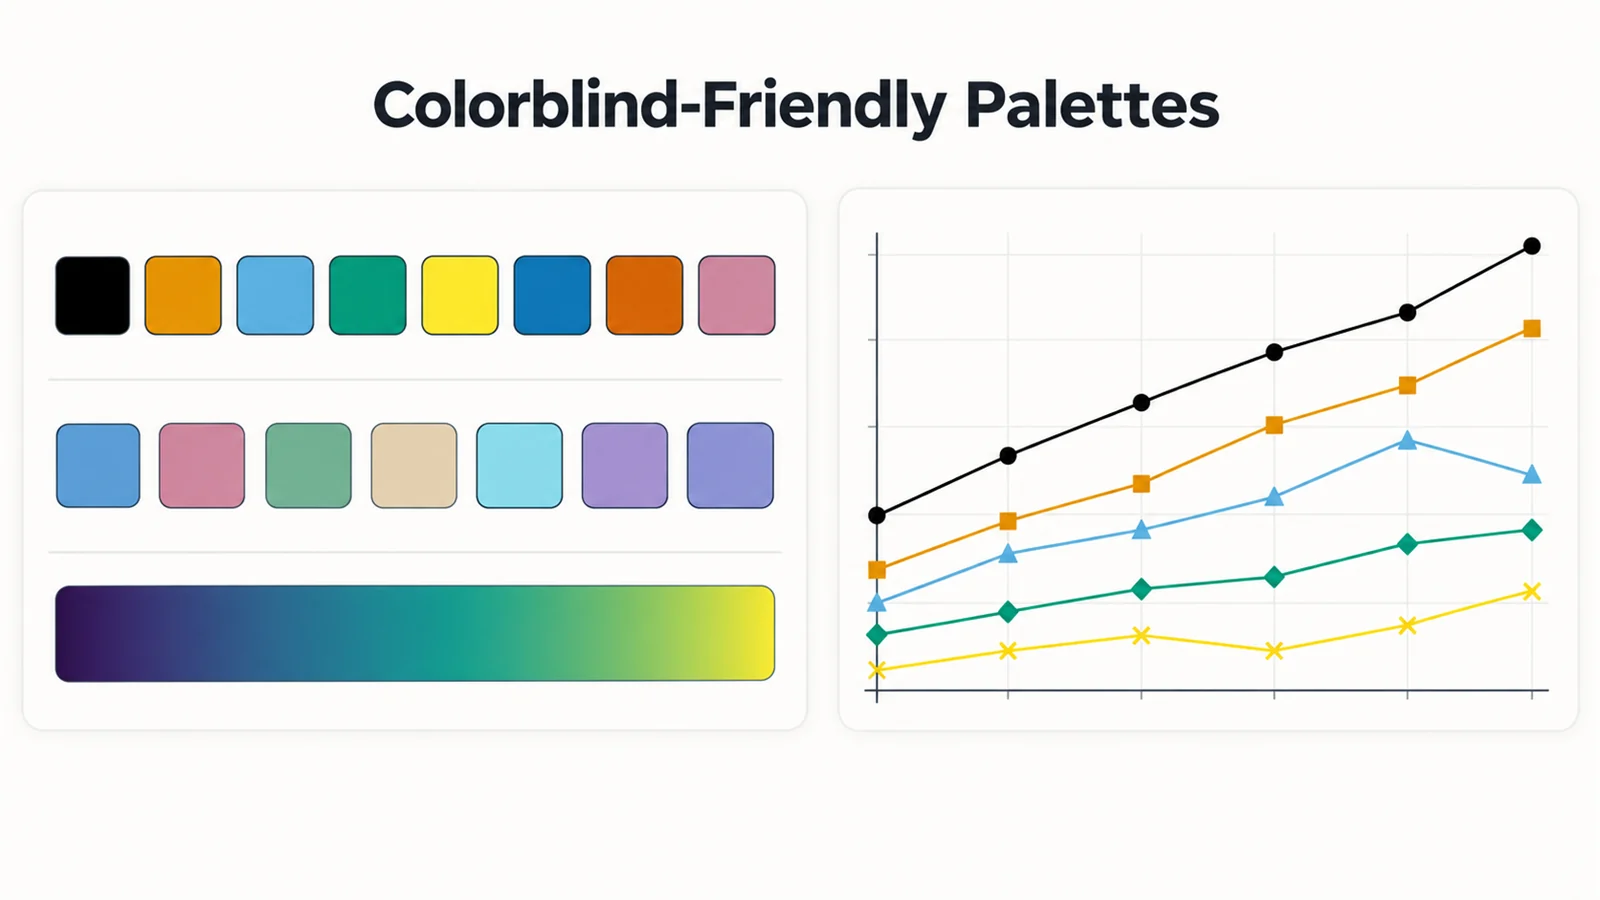
Colorblind-Friendly Palettes
Okabe-Ito and other colorblind-safe palettes with HEX and code snippets.
Need the figure as well as the layout?
SciFigure AI turns experimental designs, workflows, and results into publication-ready figures for papers, posters, and slides.
Explore the AI figure toolsLast checked: September 20, 2026. Sources: ANSI/SLAS 1-2004: Footprint Dimensions; ANSI/SLAS 4-2004: Well Positions; Okabe & Ito, colour-blind safe palette.