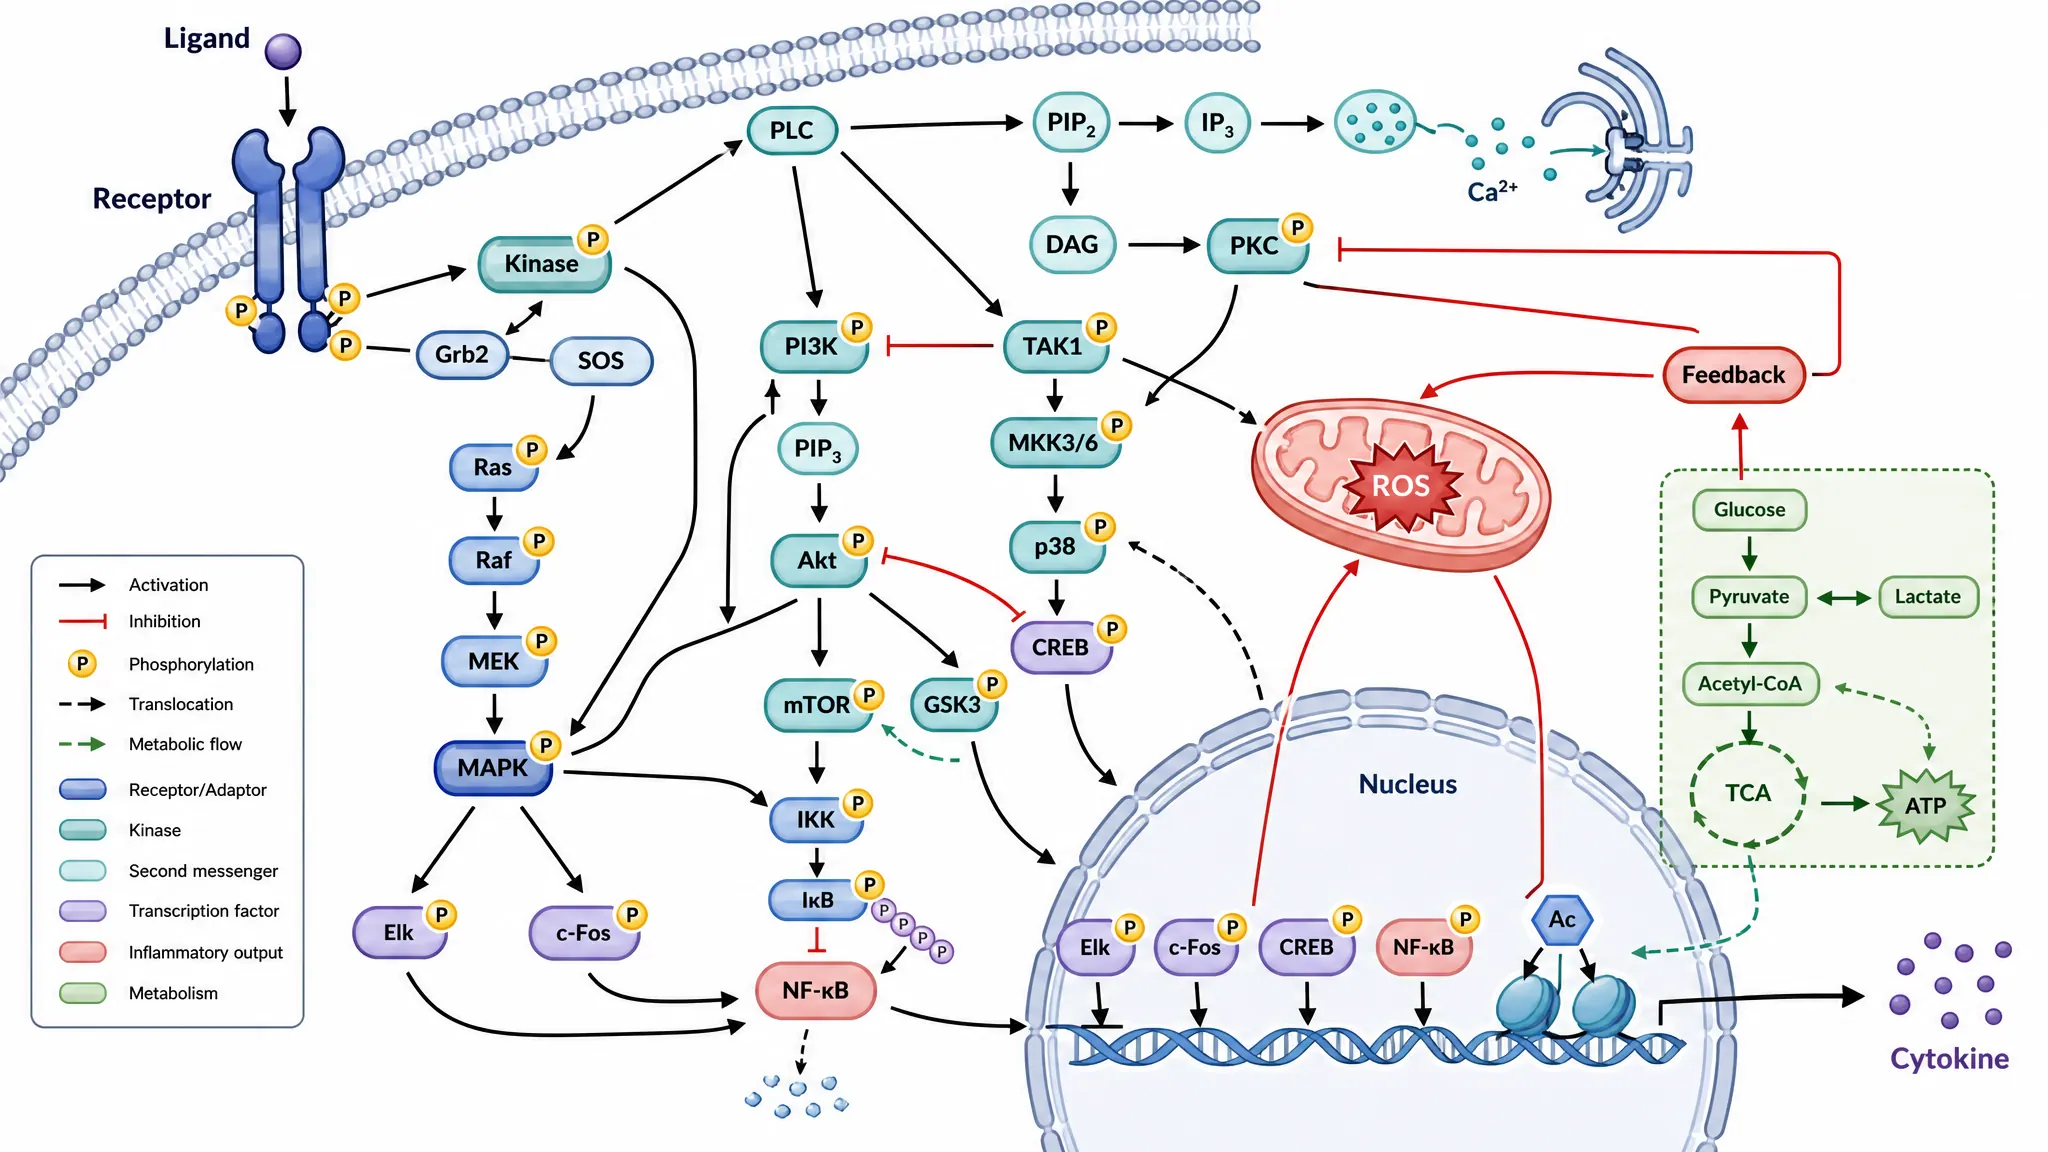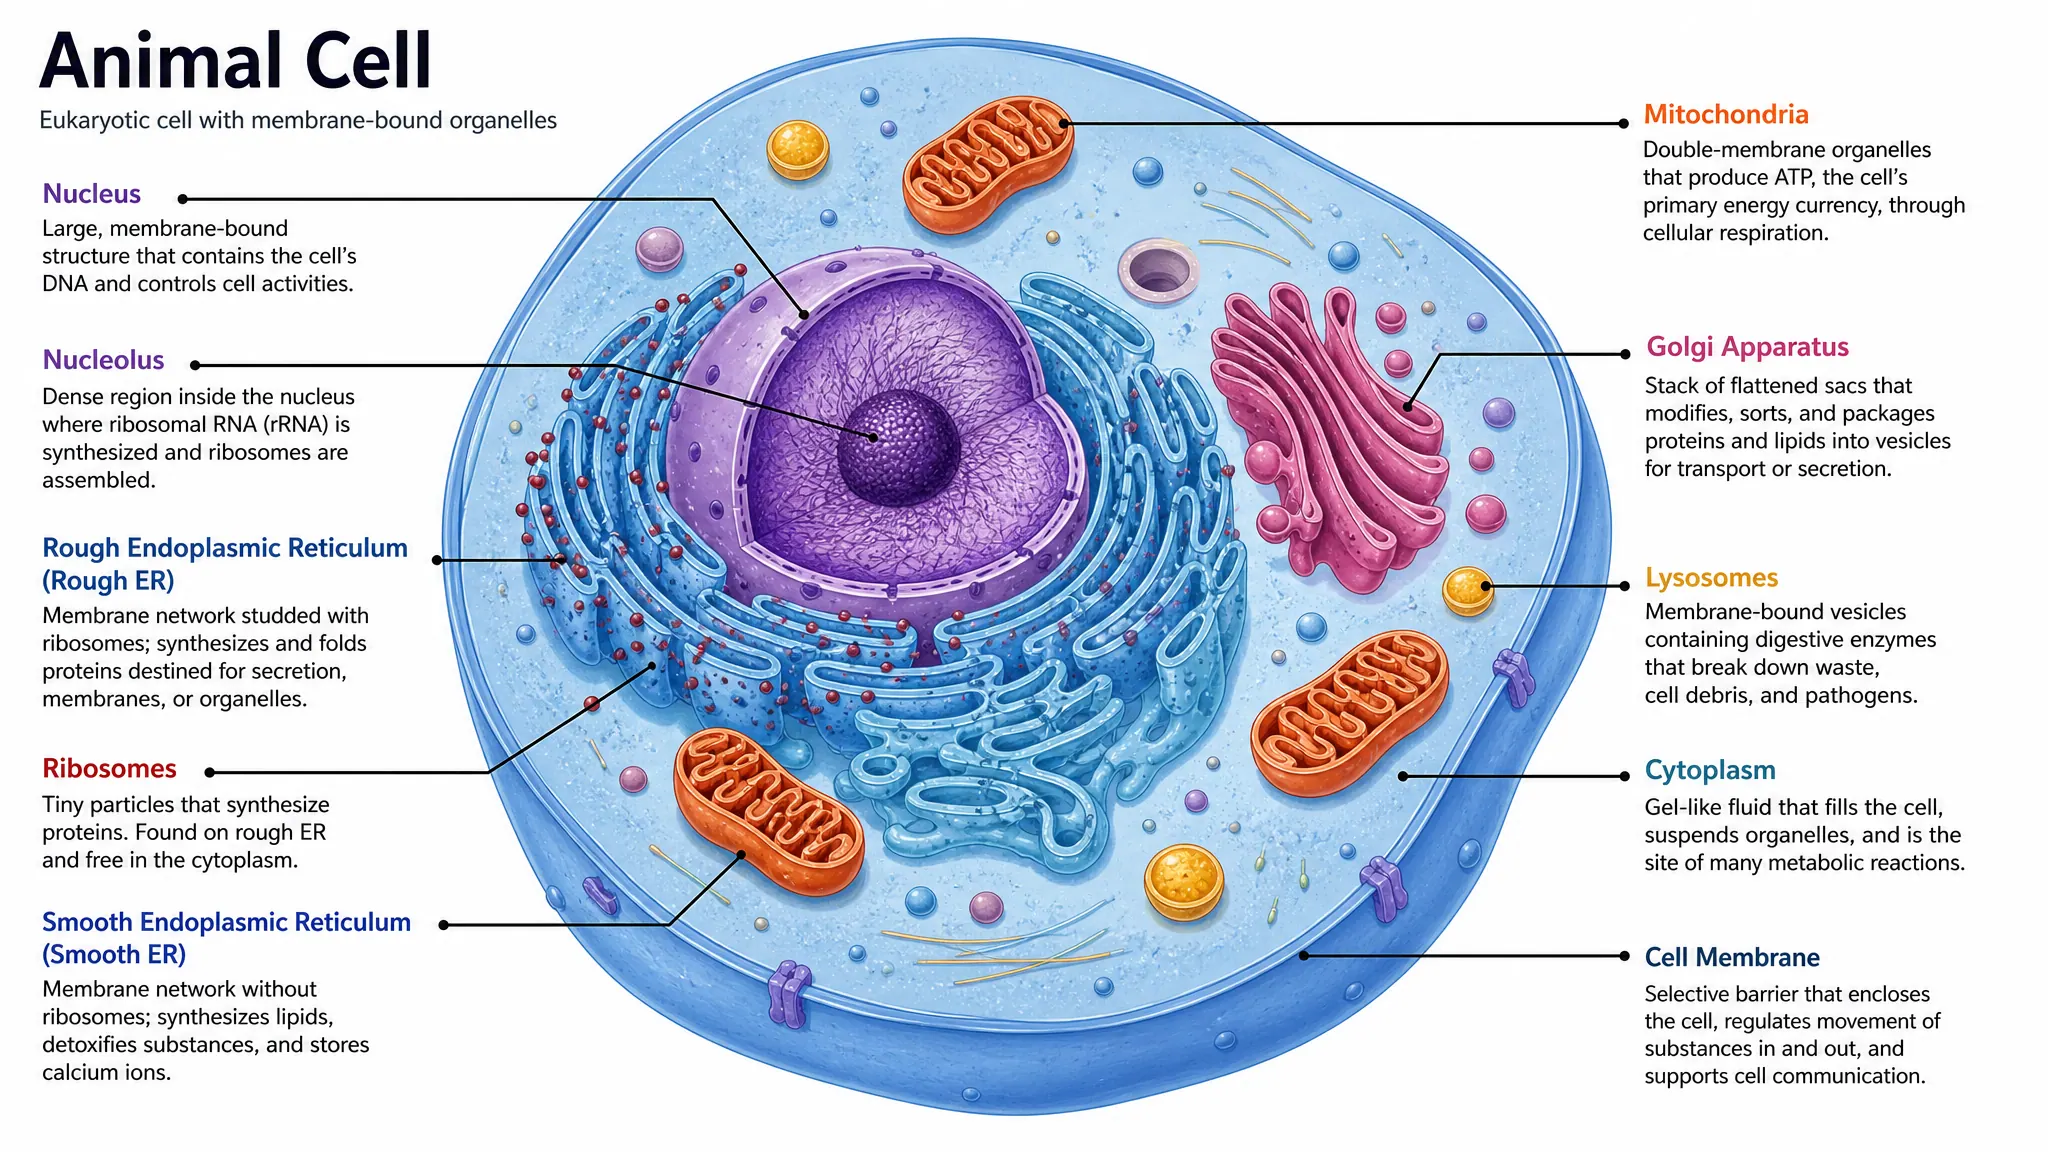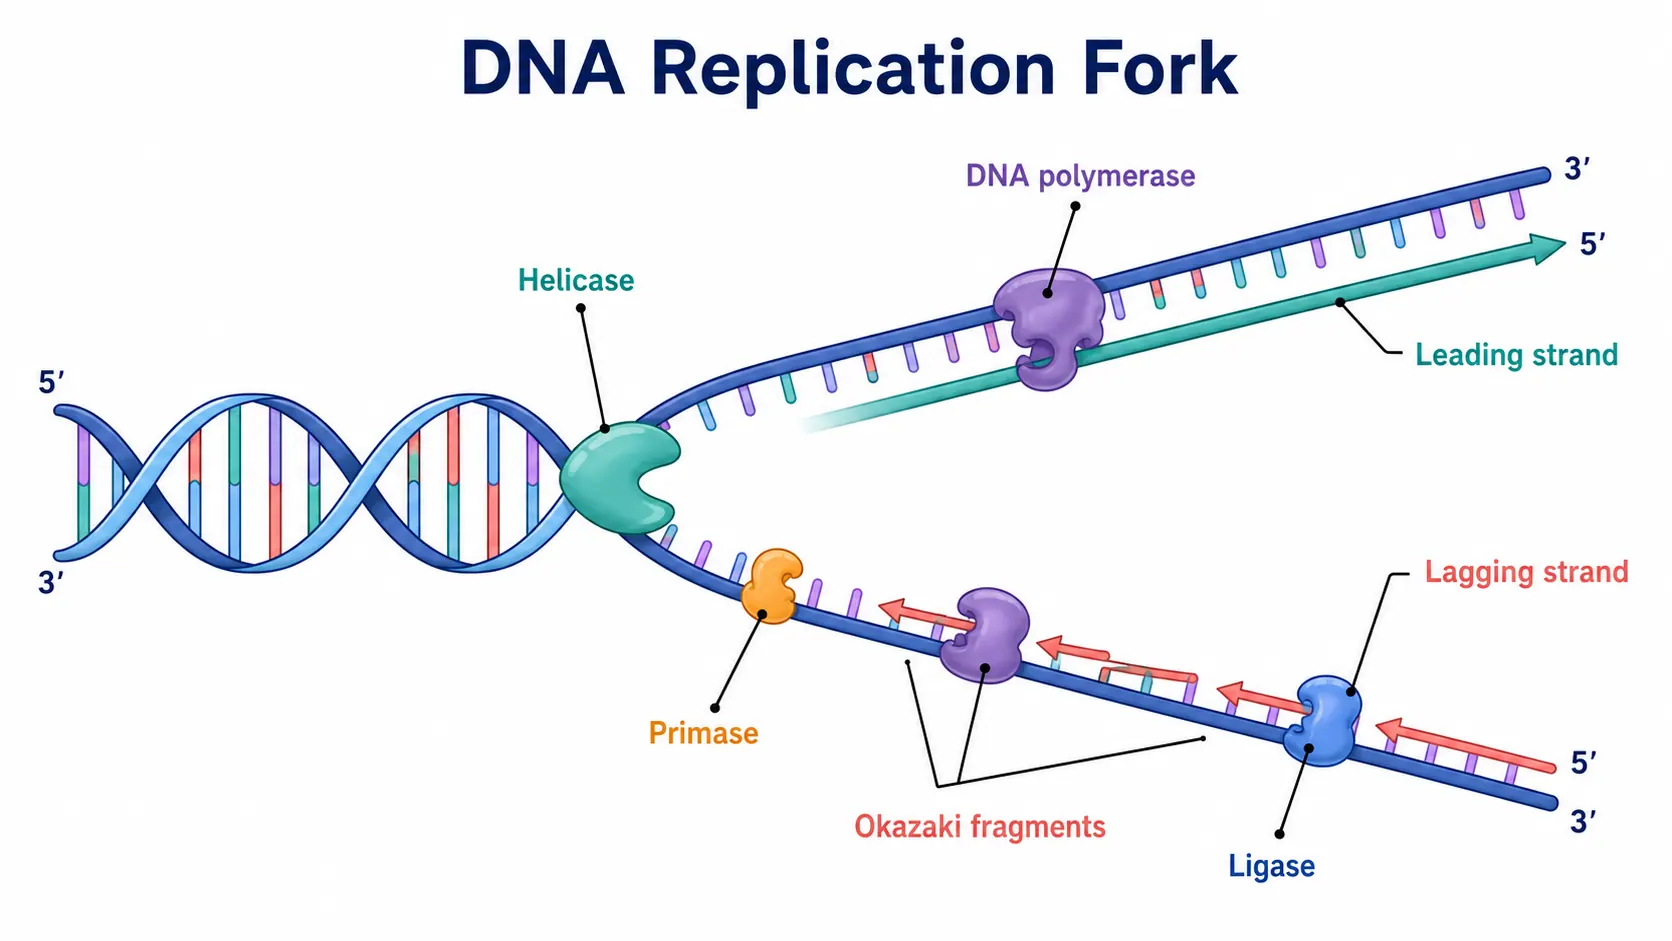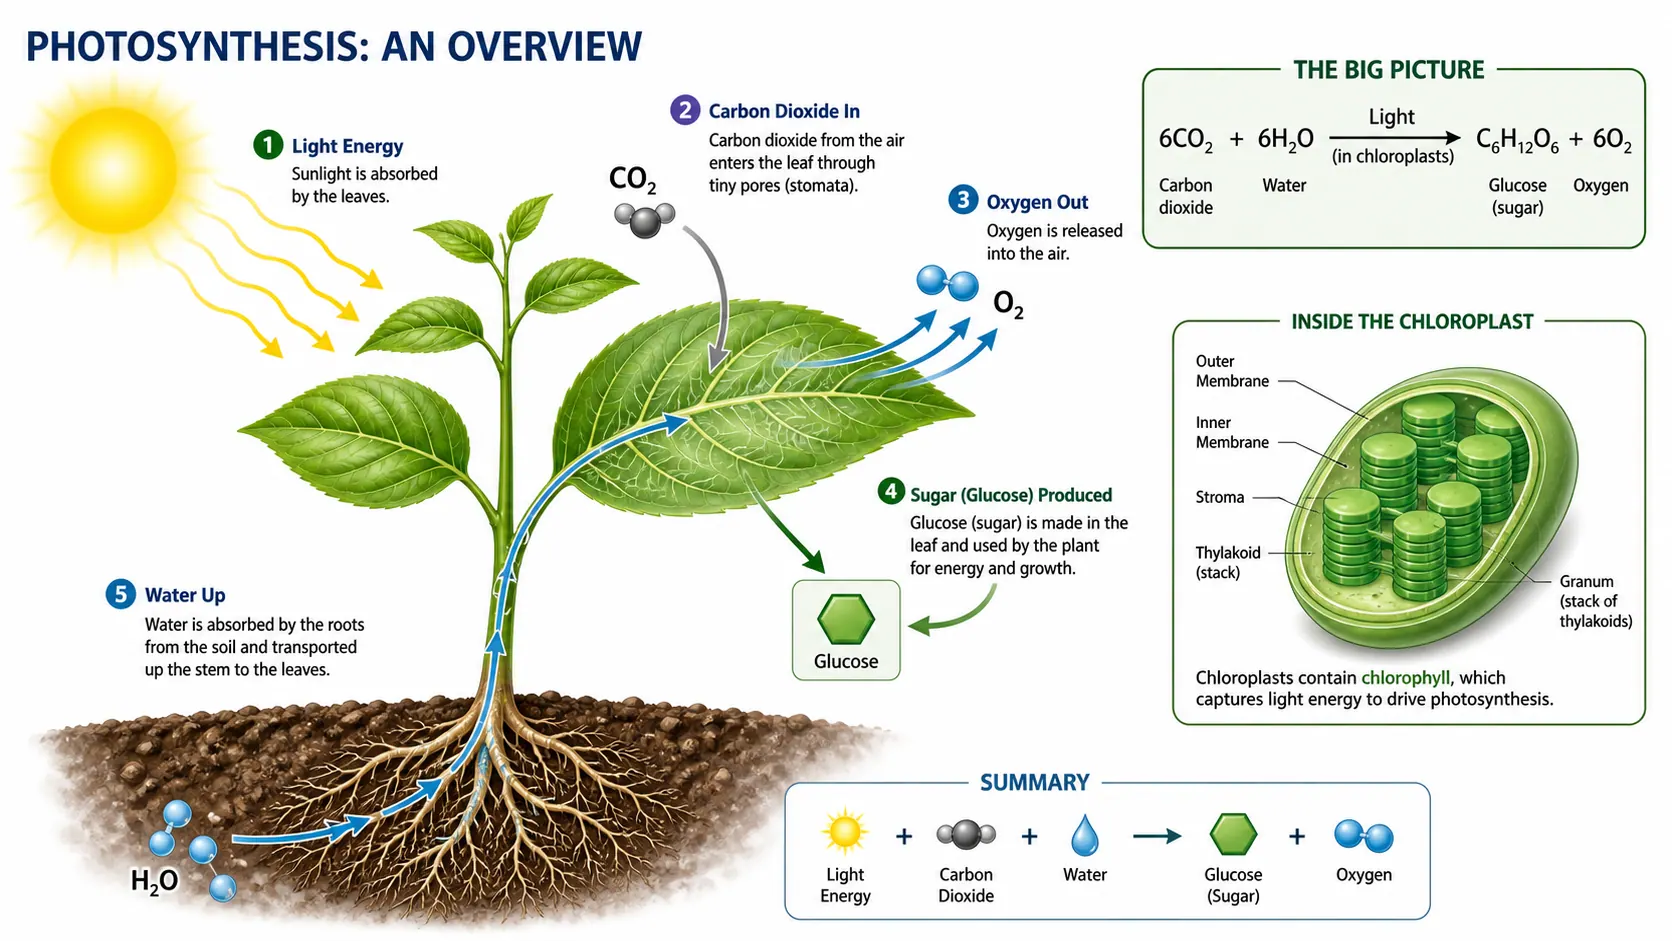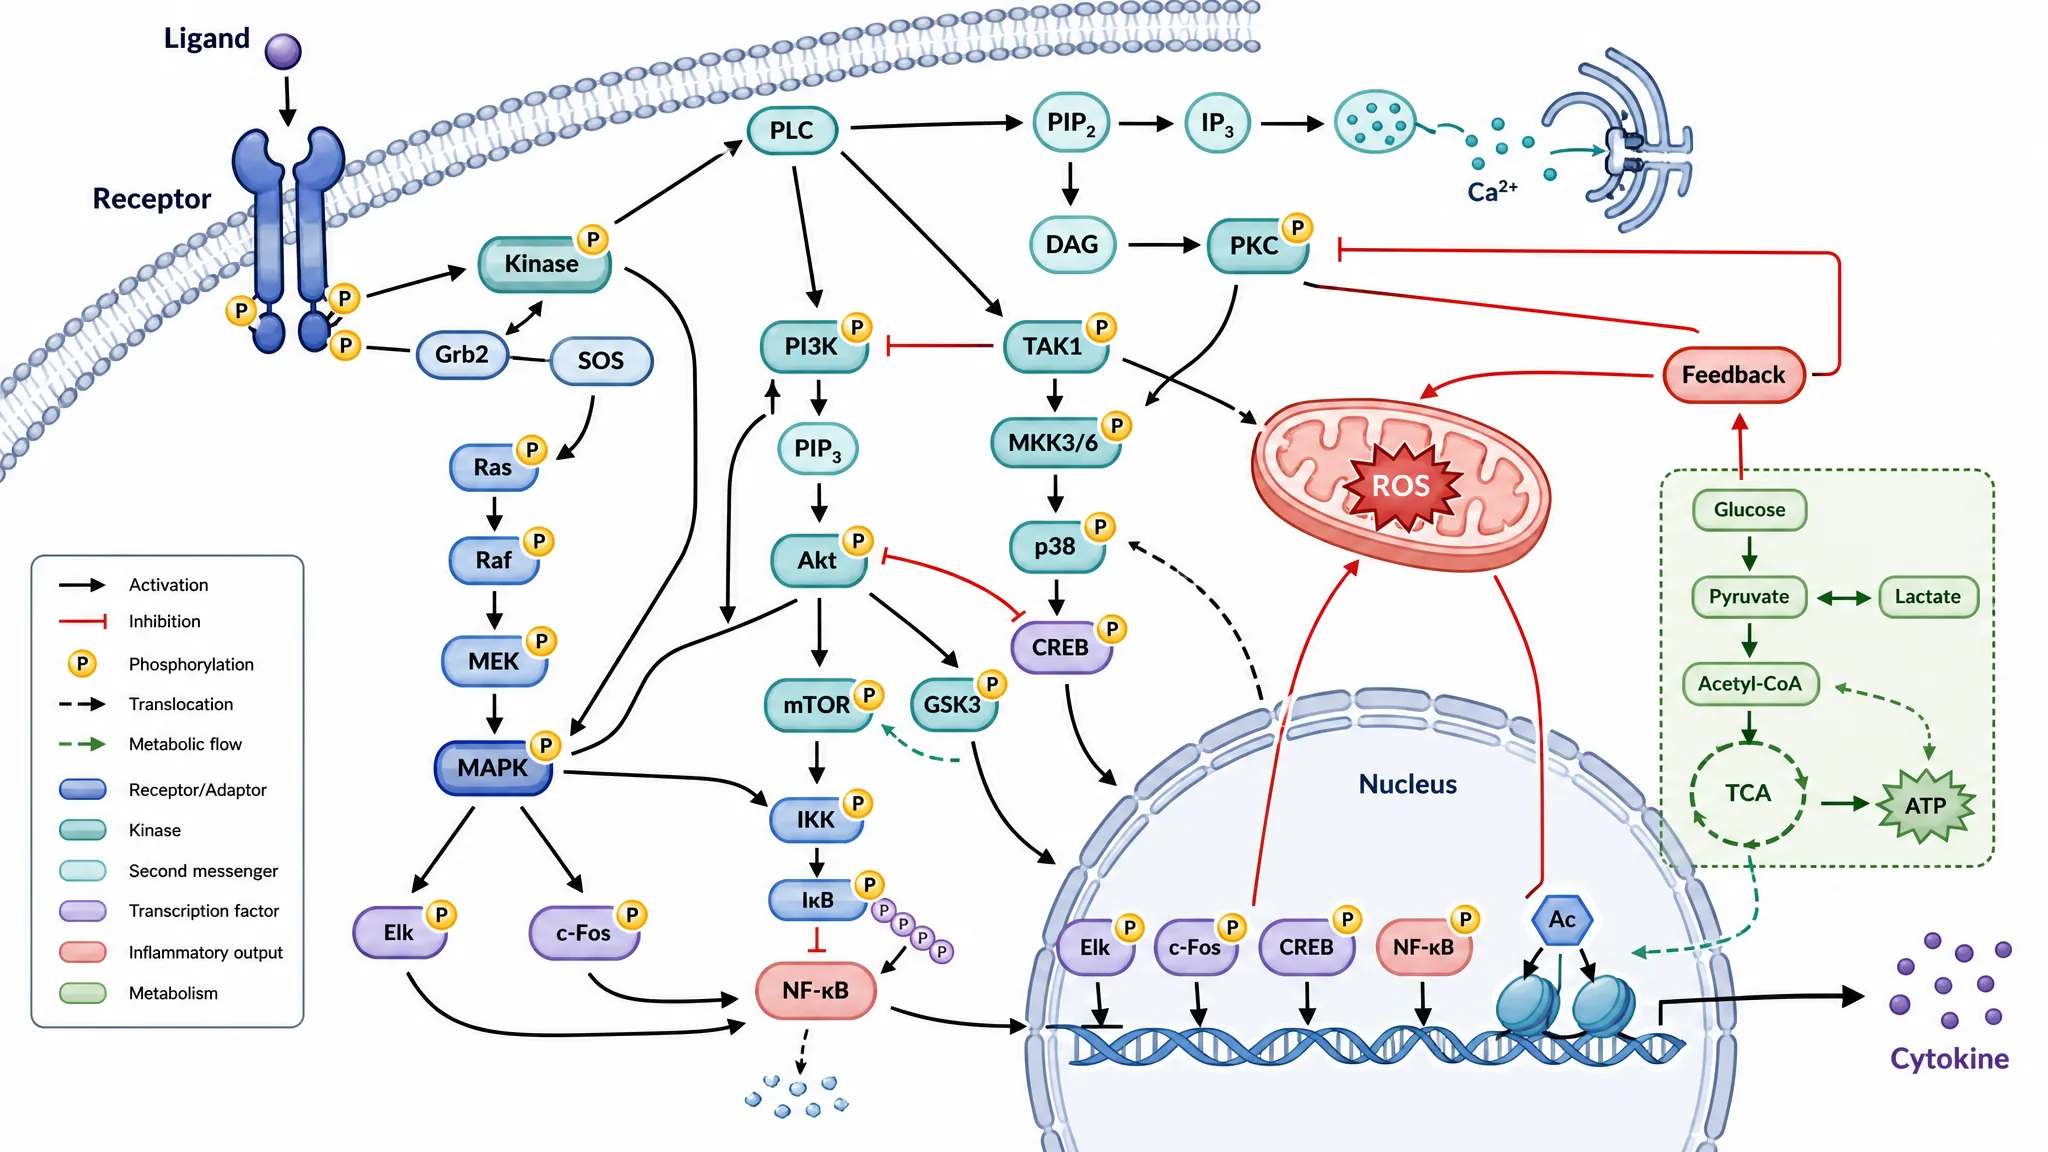
Cell Signaling Pathway
BiologyPrompt-to-pathway layouts with consistent labels
SciFigure AI
Create publication-ready scientific drawings from prompts, sketches, and research data. Build clear diagrams, illustrations, and charts for papers, posters, theses, and teaching.
Prompt-to-pathway layouts with consistent labels
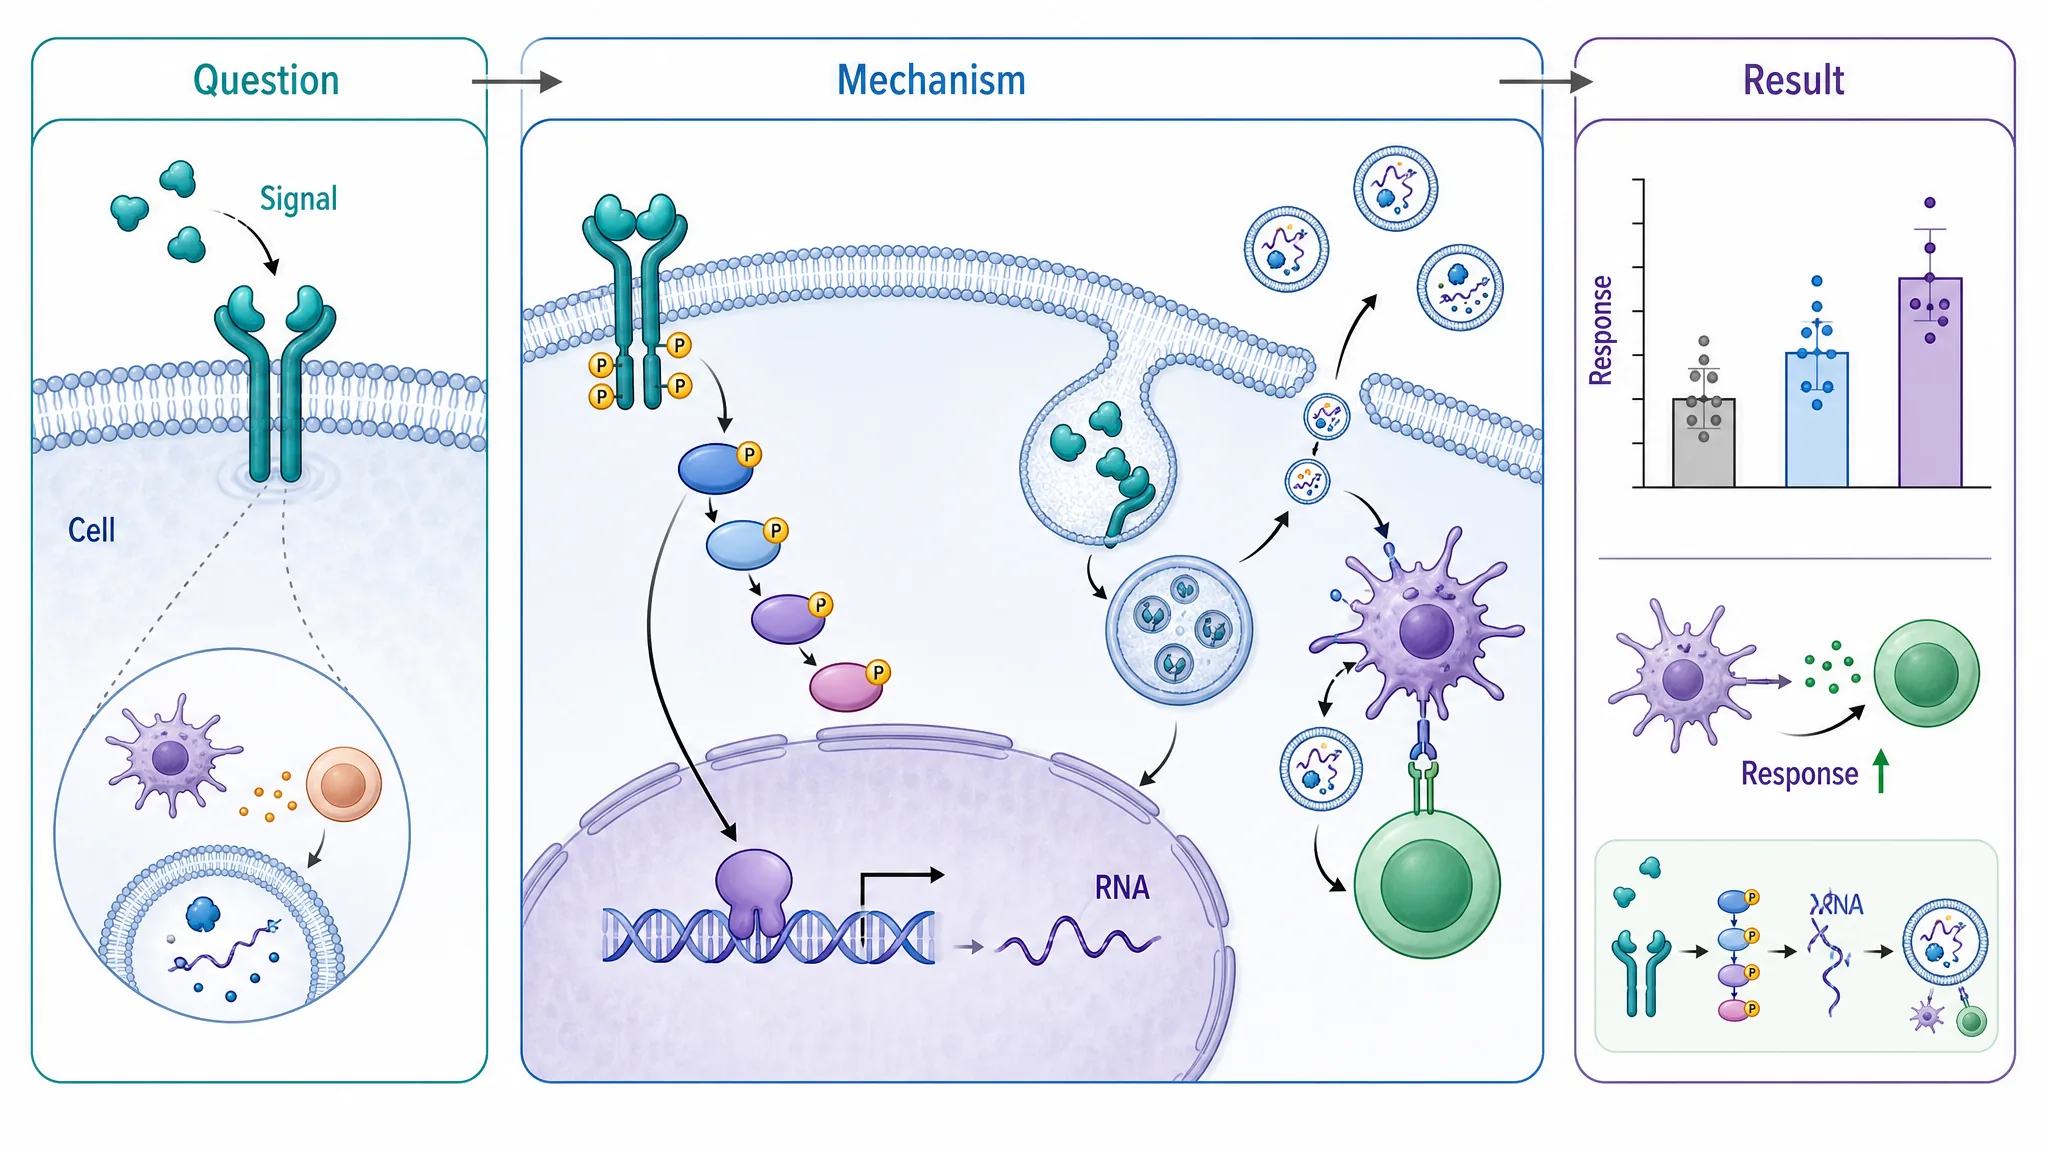
Mechanism-first storyboards for journal figures
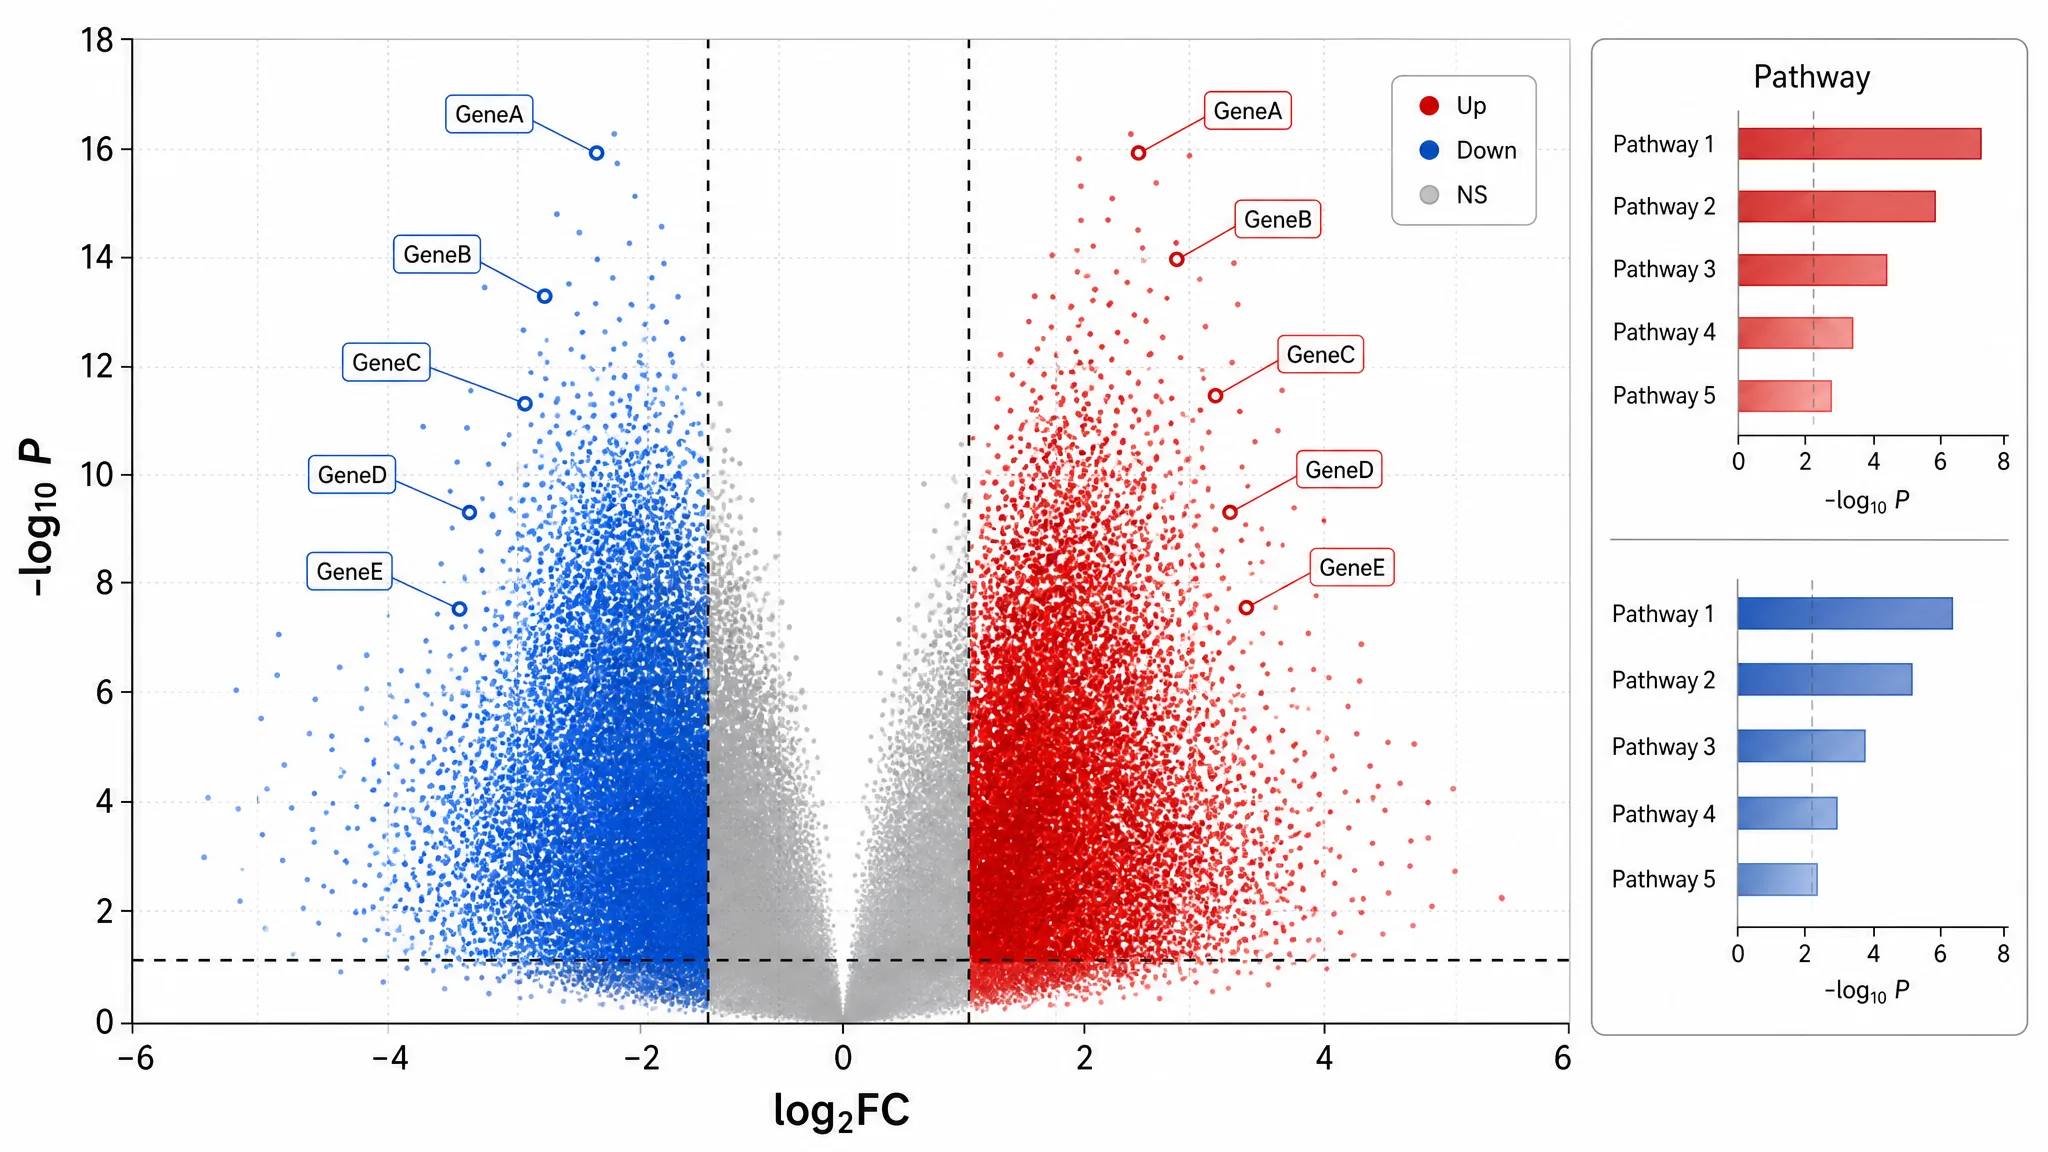
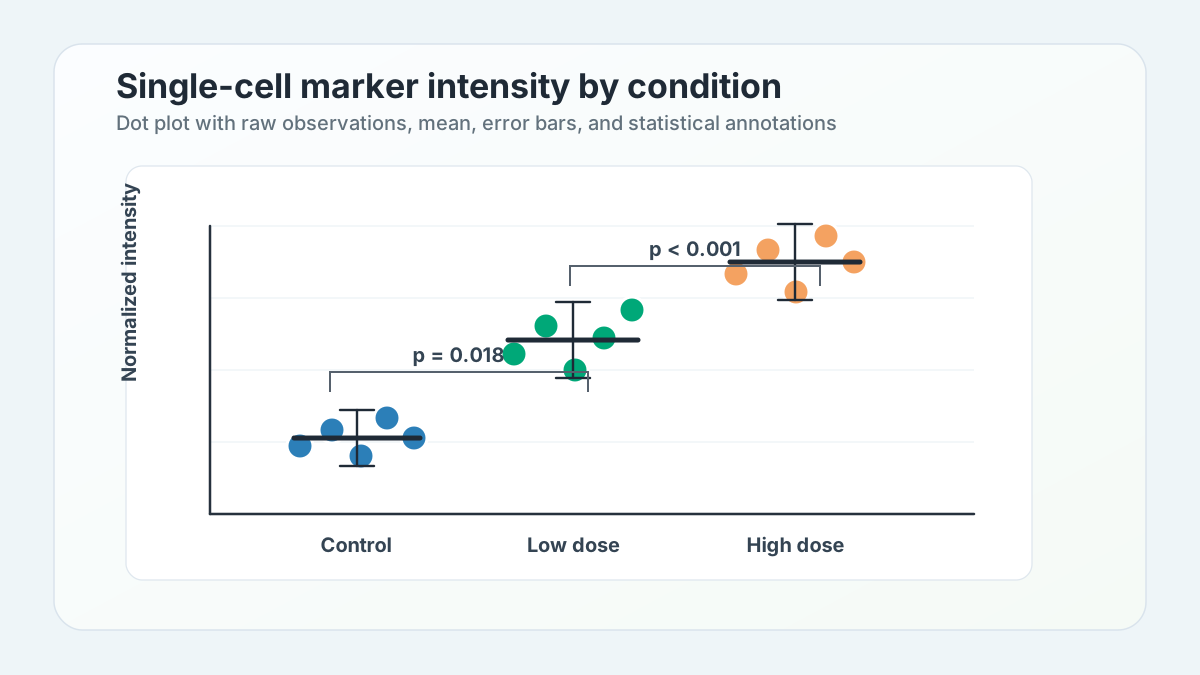
Charts and annotations ready for manuscripts

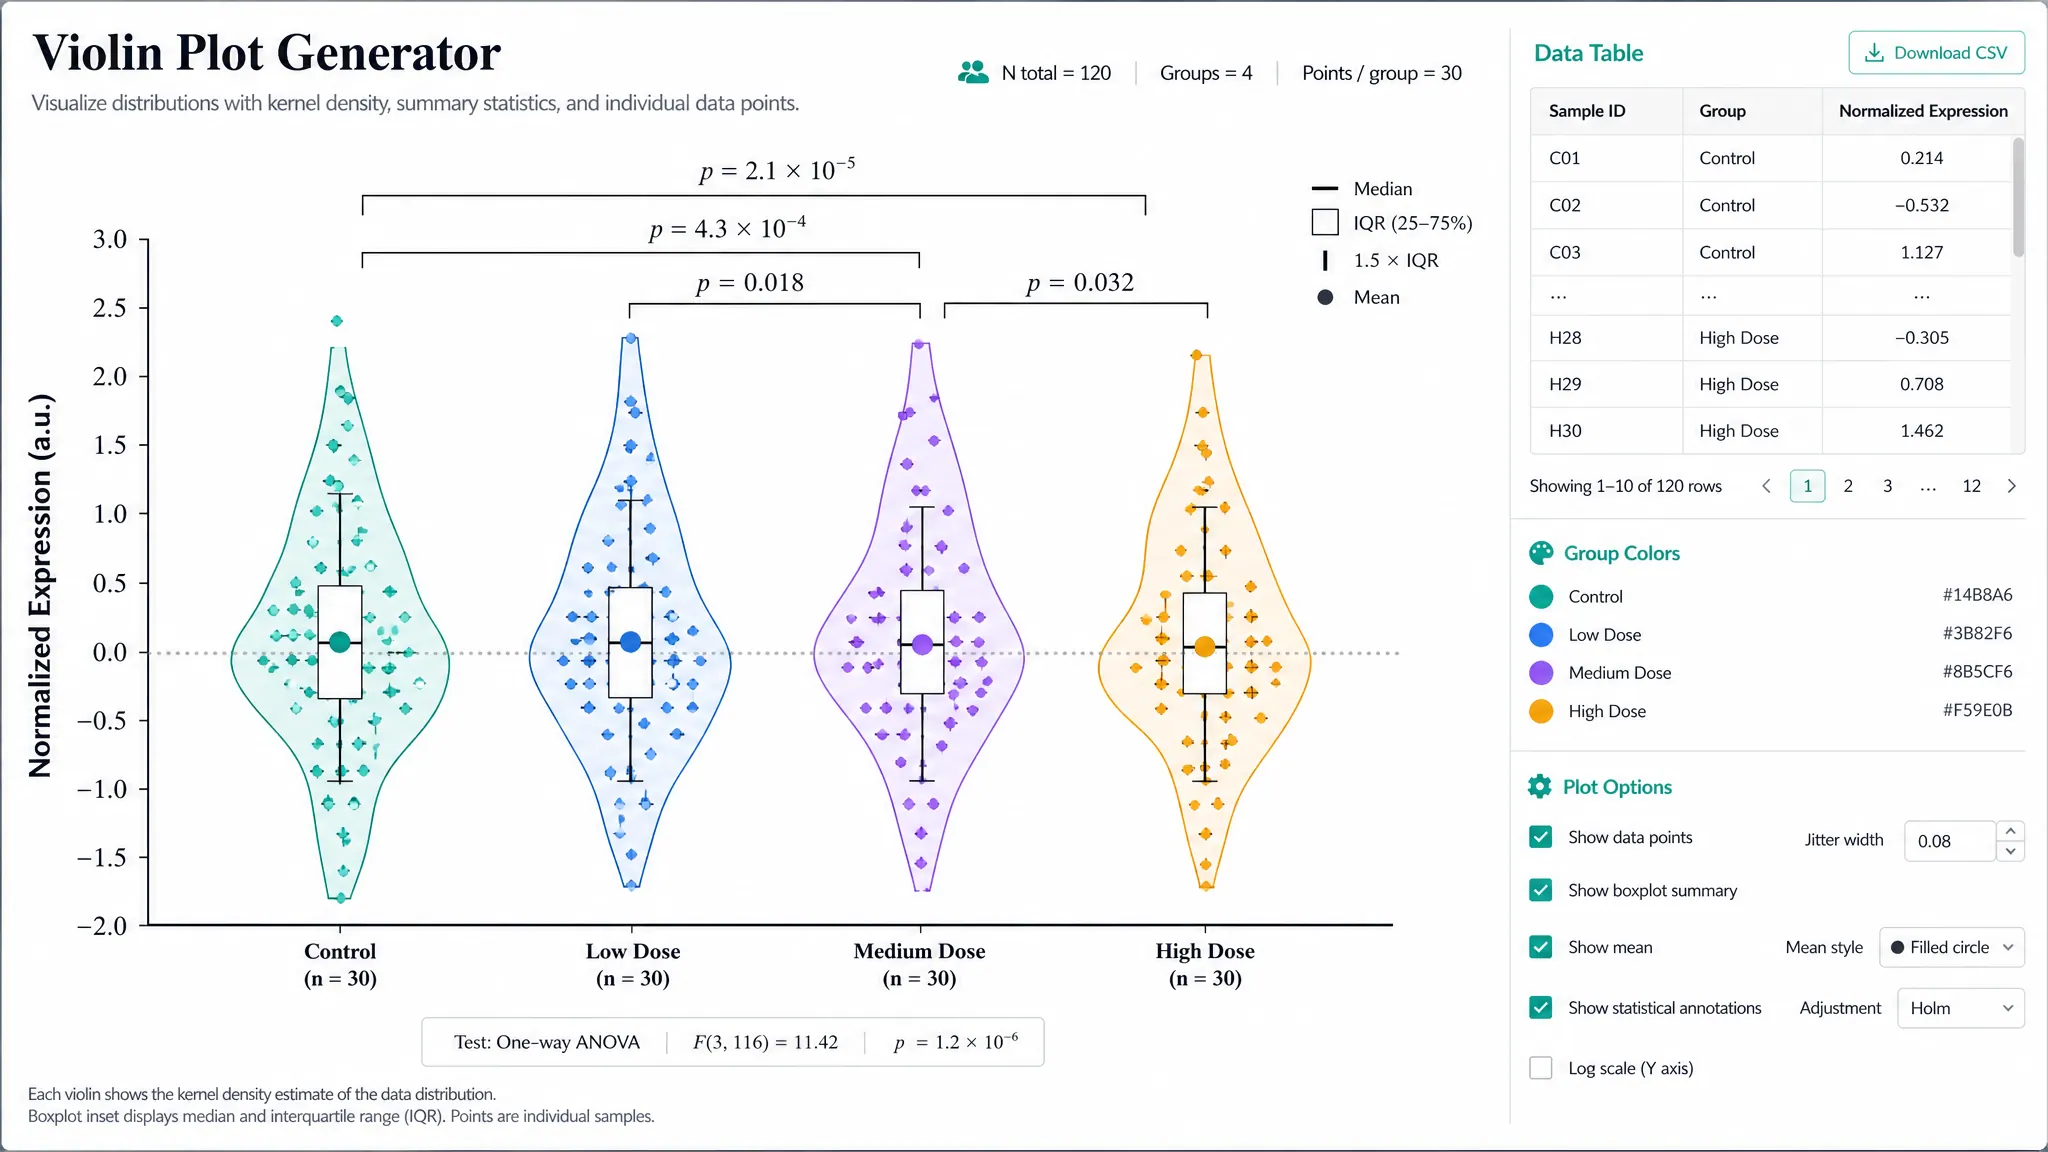
Grouped box plots from uploaded datasets
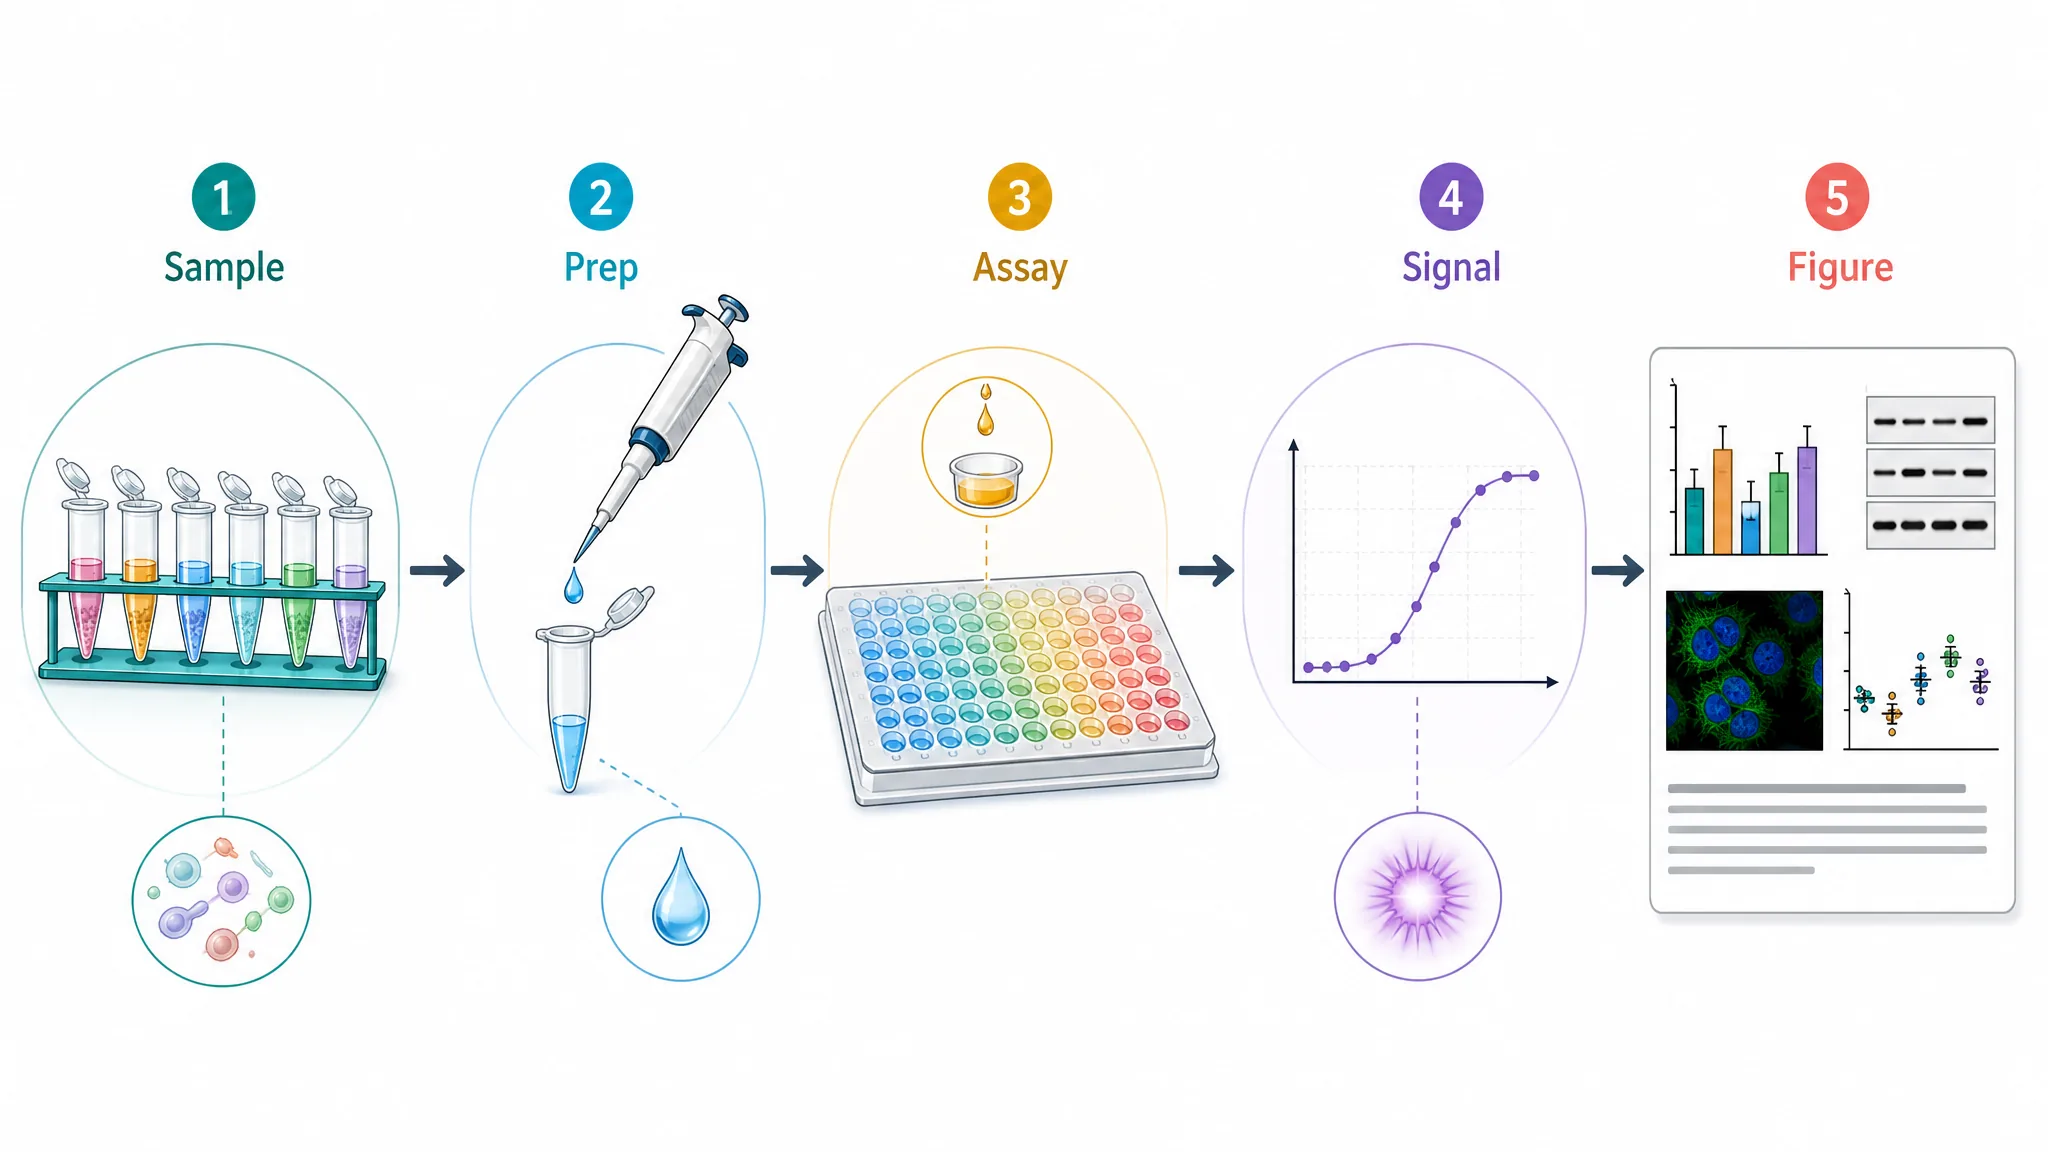
Clean experimental flows for methods sections
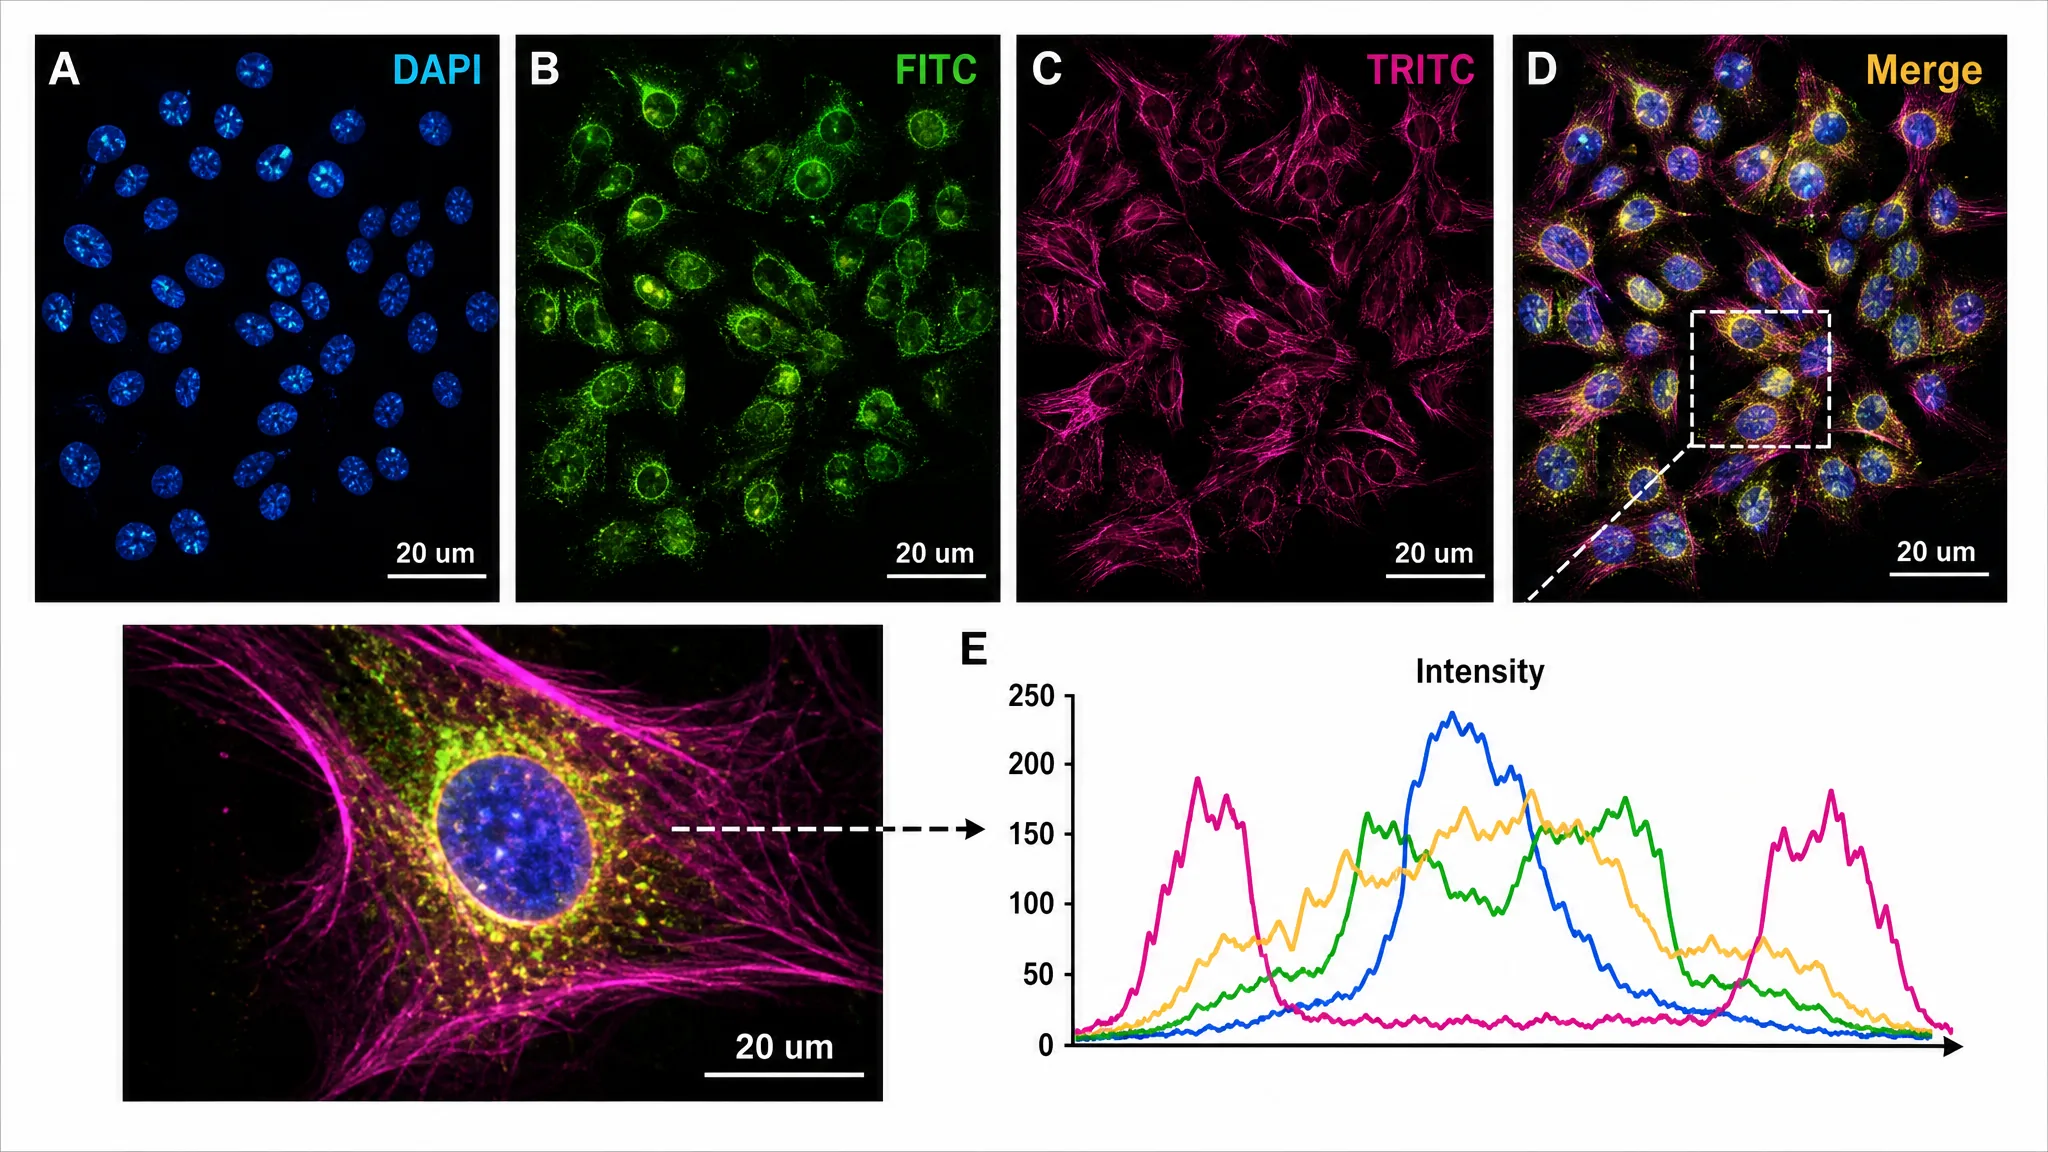
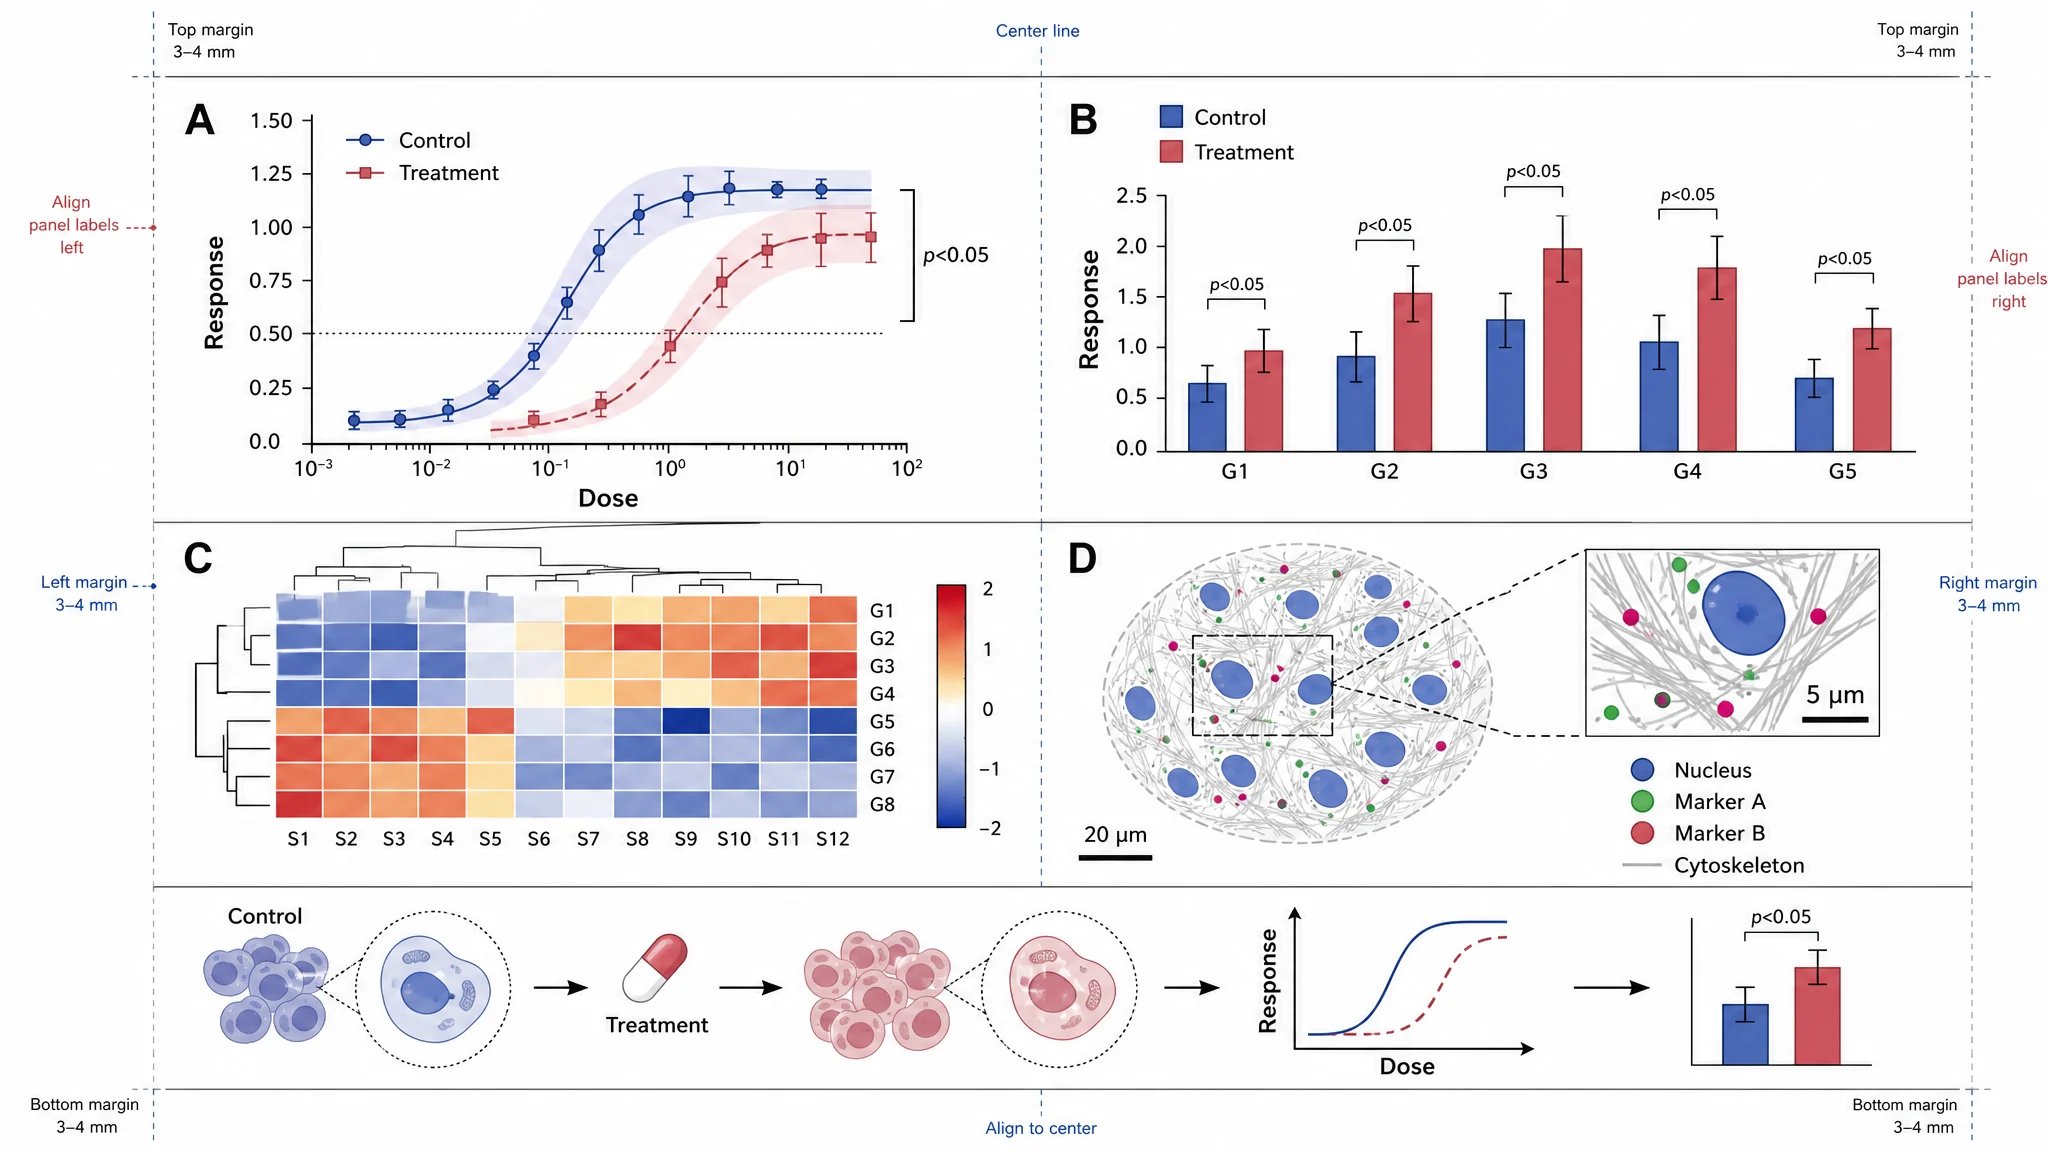
Multi-panel scientific layouts with callouts
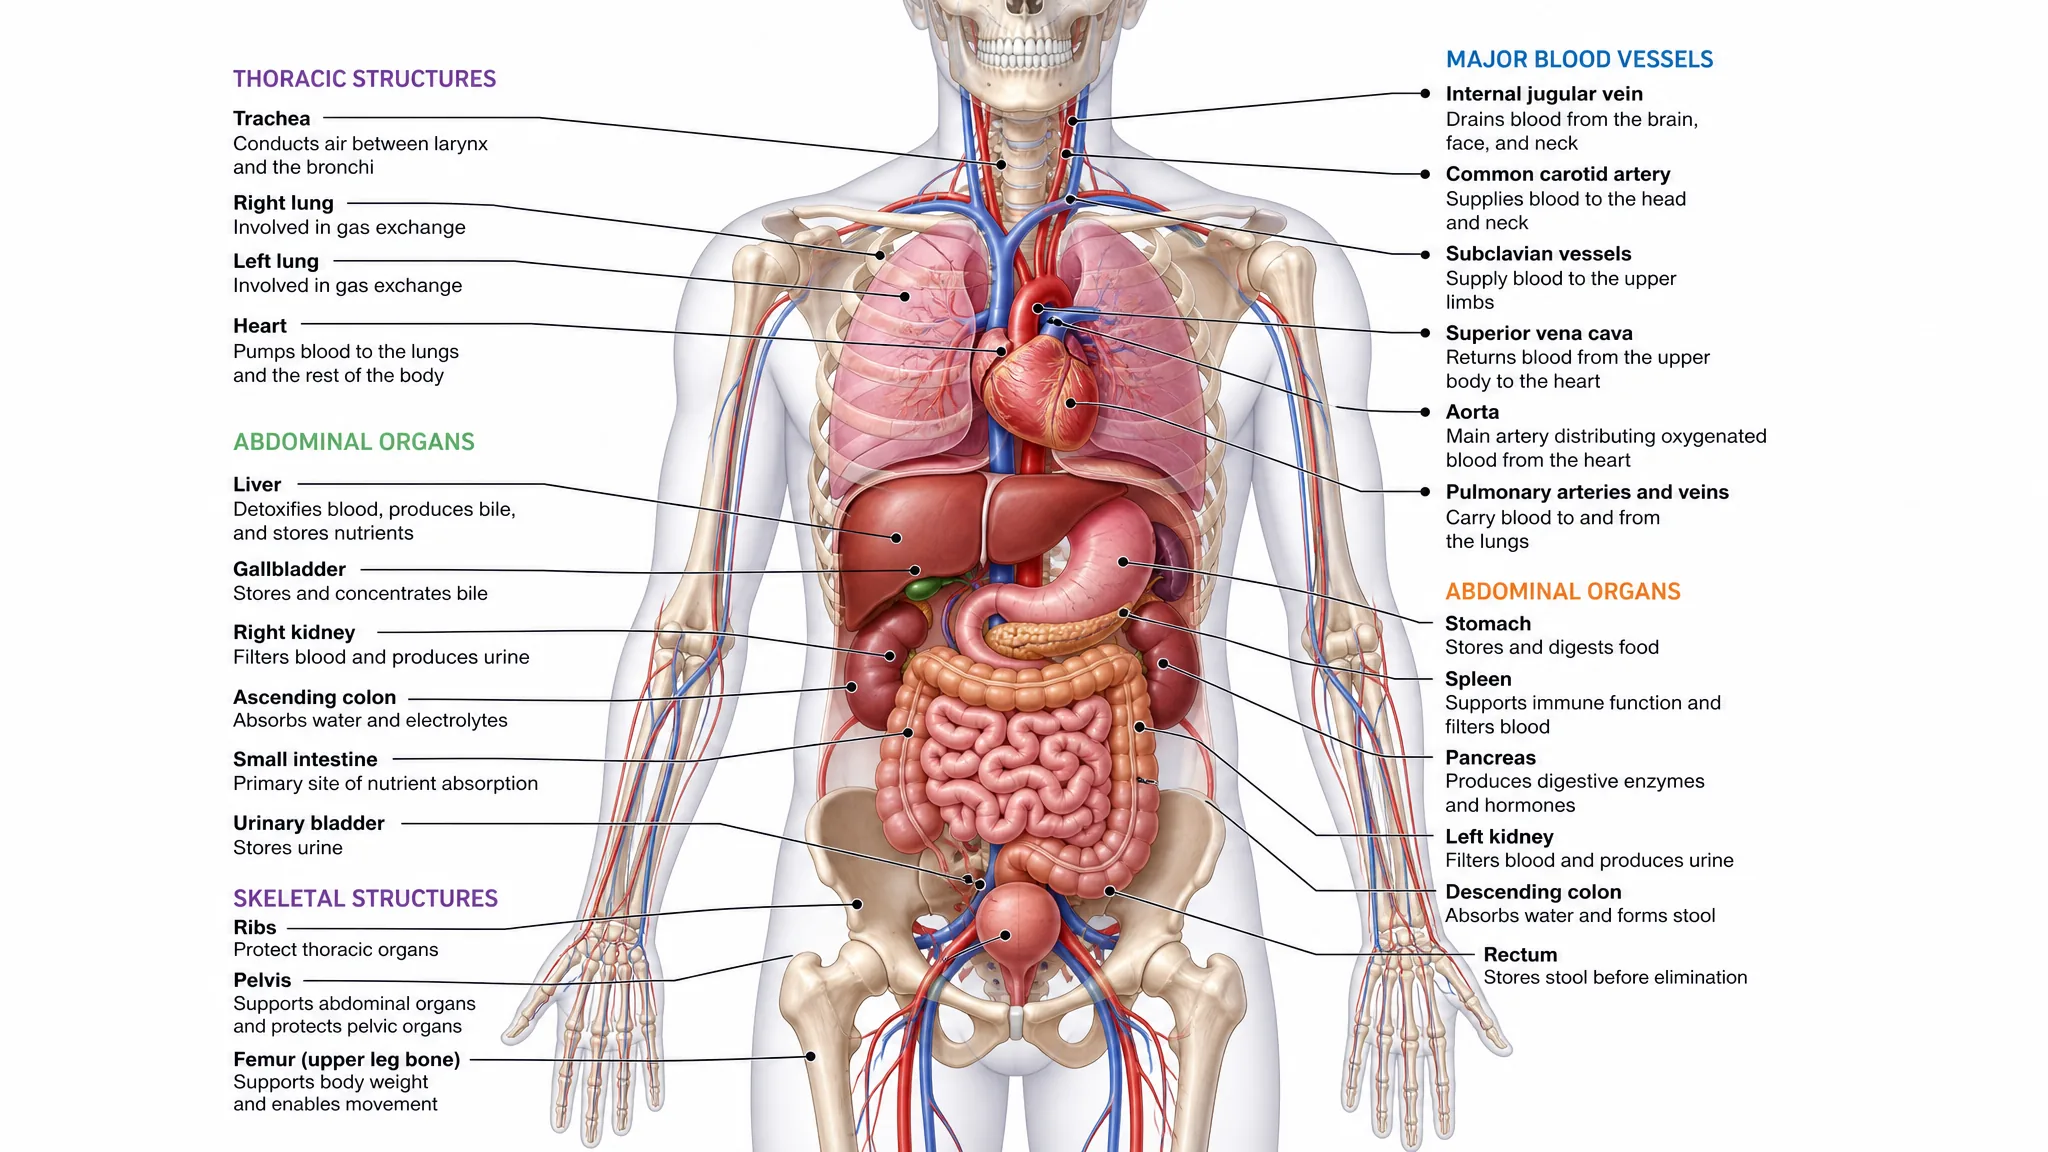
Publication-style anatomy and tissue diagrams
Choose, describe or upload, generate, then refine for publication.
Start from scientific diagrams, data charts, posters, workflows, or classroom visuals.
Use a prompt, sketch, reference image, CSV, Excel file, or pasted data.
Create a publication-ready starting point with labels, layout, and scientific structure.
Ask for cleaner labels, colors, or layout, then download for papers, slides, and posters.
Start with text, improve a sketch or reference image, or turn uploaded data into a polished research figure.
Describe your scientific concept and generate professional scientific illustrations.
Upload sketches or references and transform them into polished scientific visuals.
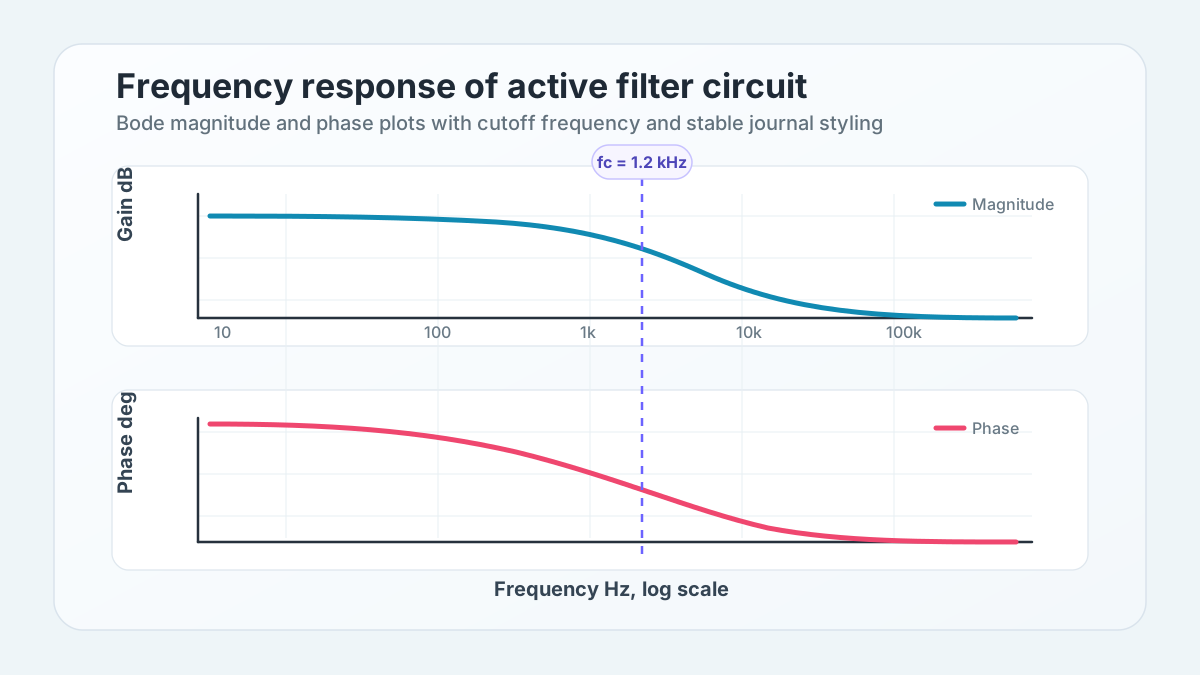
Turn research data into publication-ready charts with clear labels and annotations.
Adapt figures for papers, theses, posters, slides, and journal-style layouts.

Choose a research diagram, chart, graphical abstract, or teaching template, then adapt its content, labels, and style.
Choose a template to start with a ready prompt.
Research, teaching, and publication-ready visual templates in one gallery.
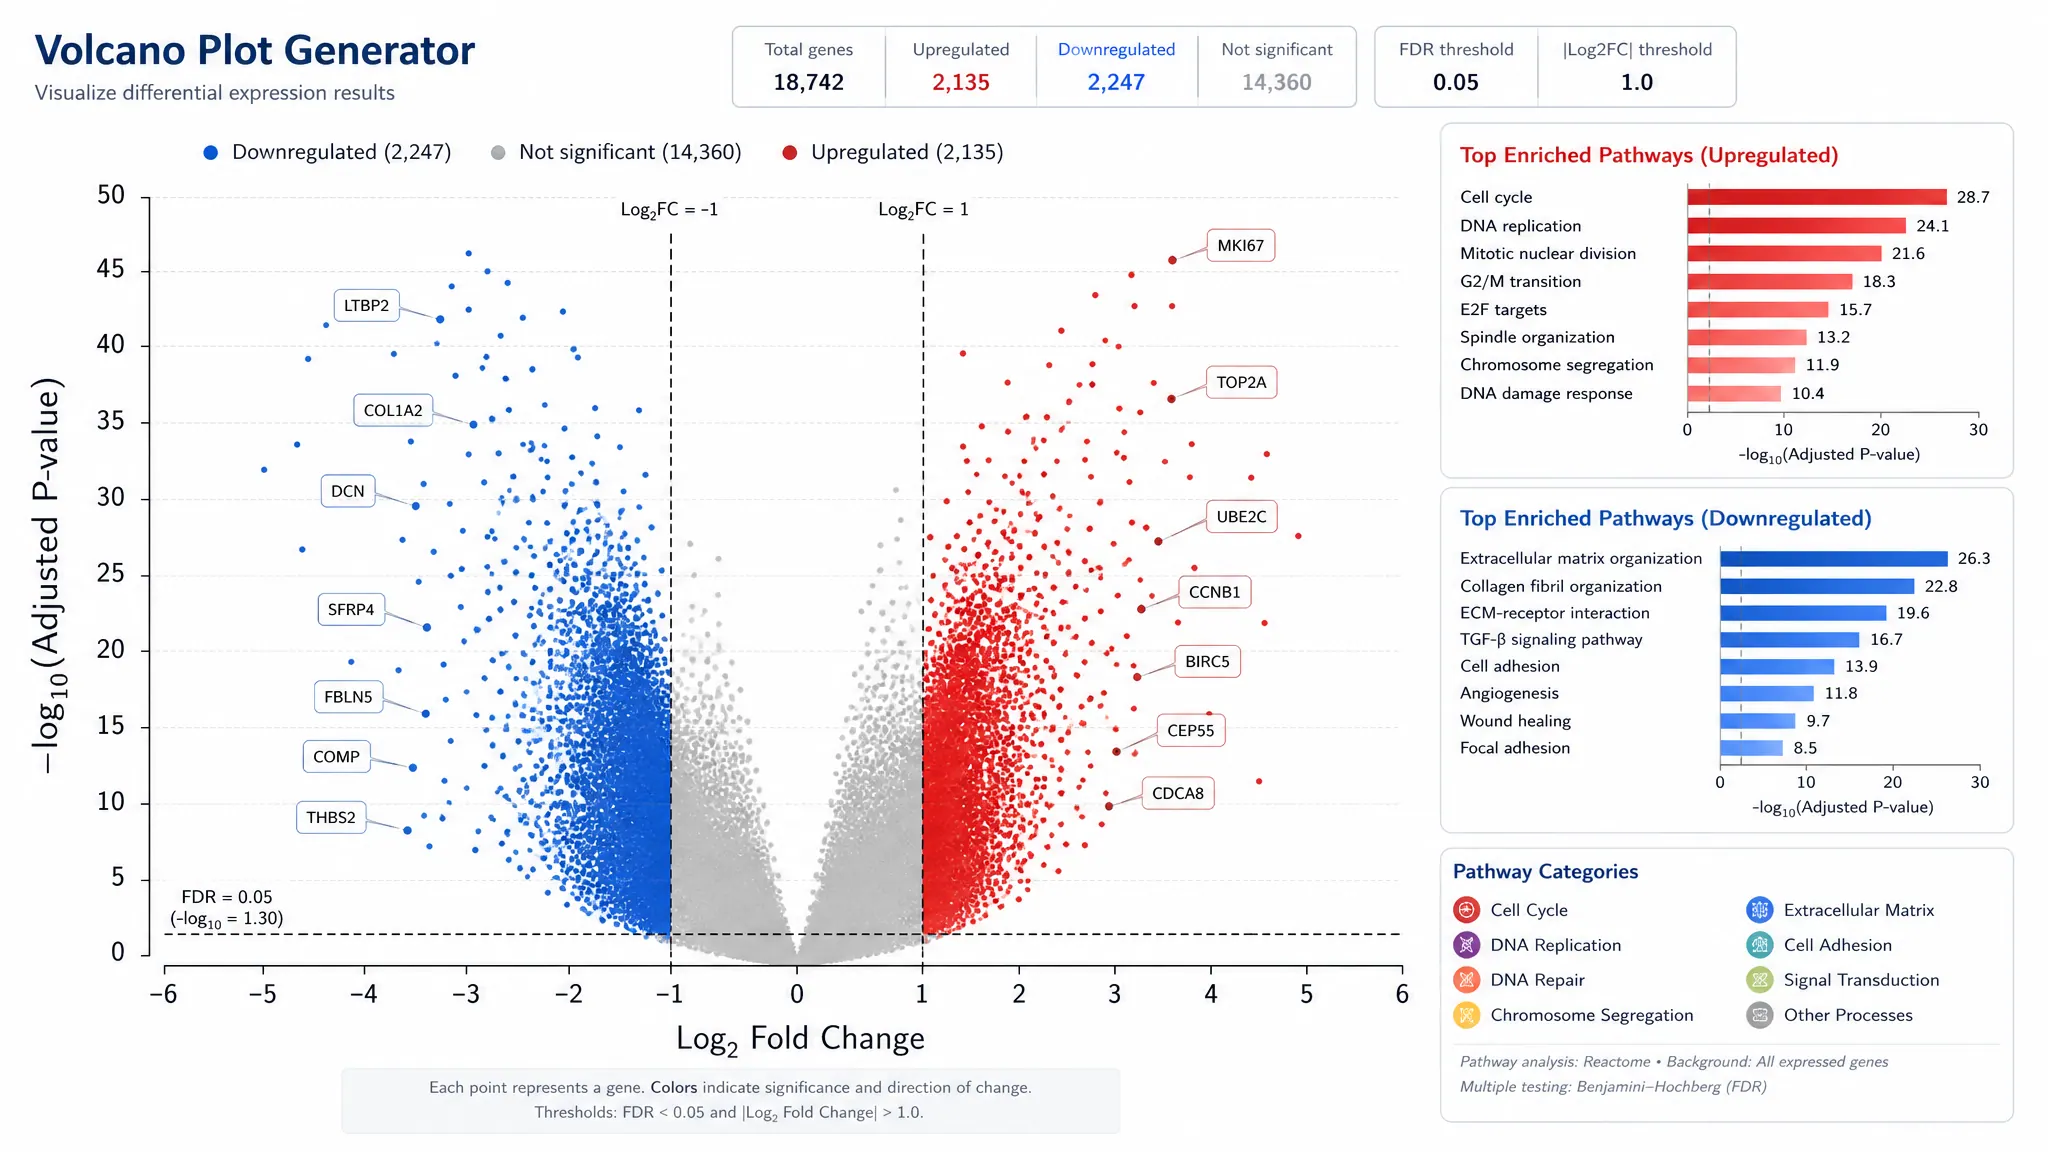
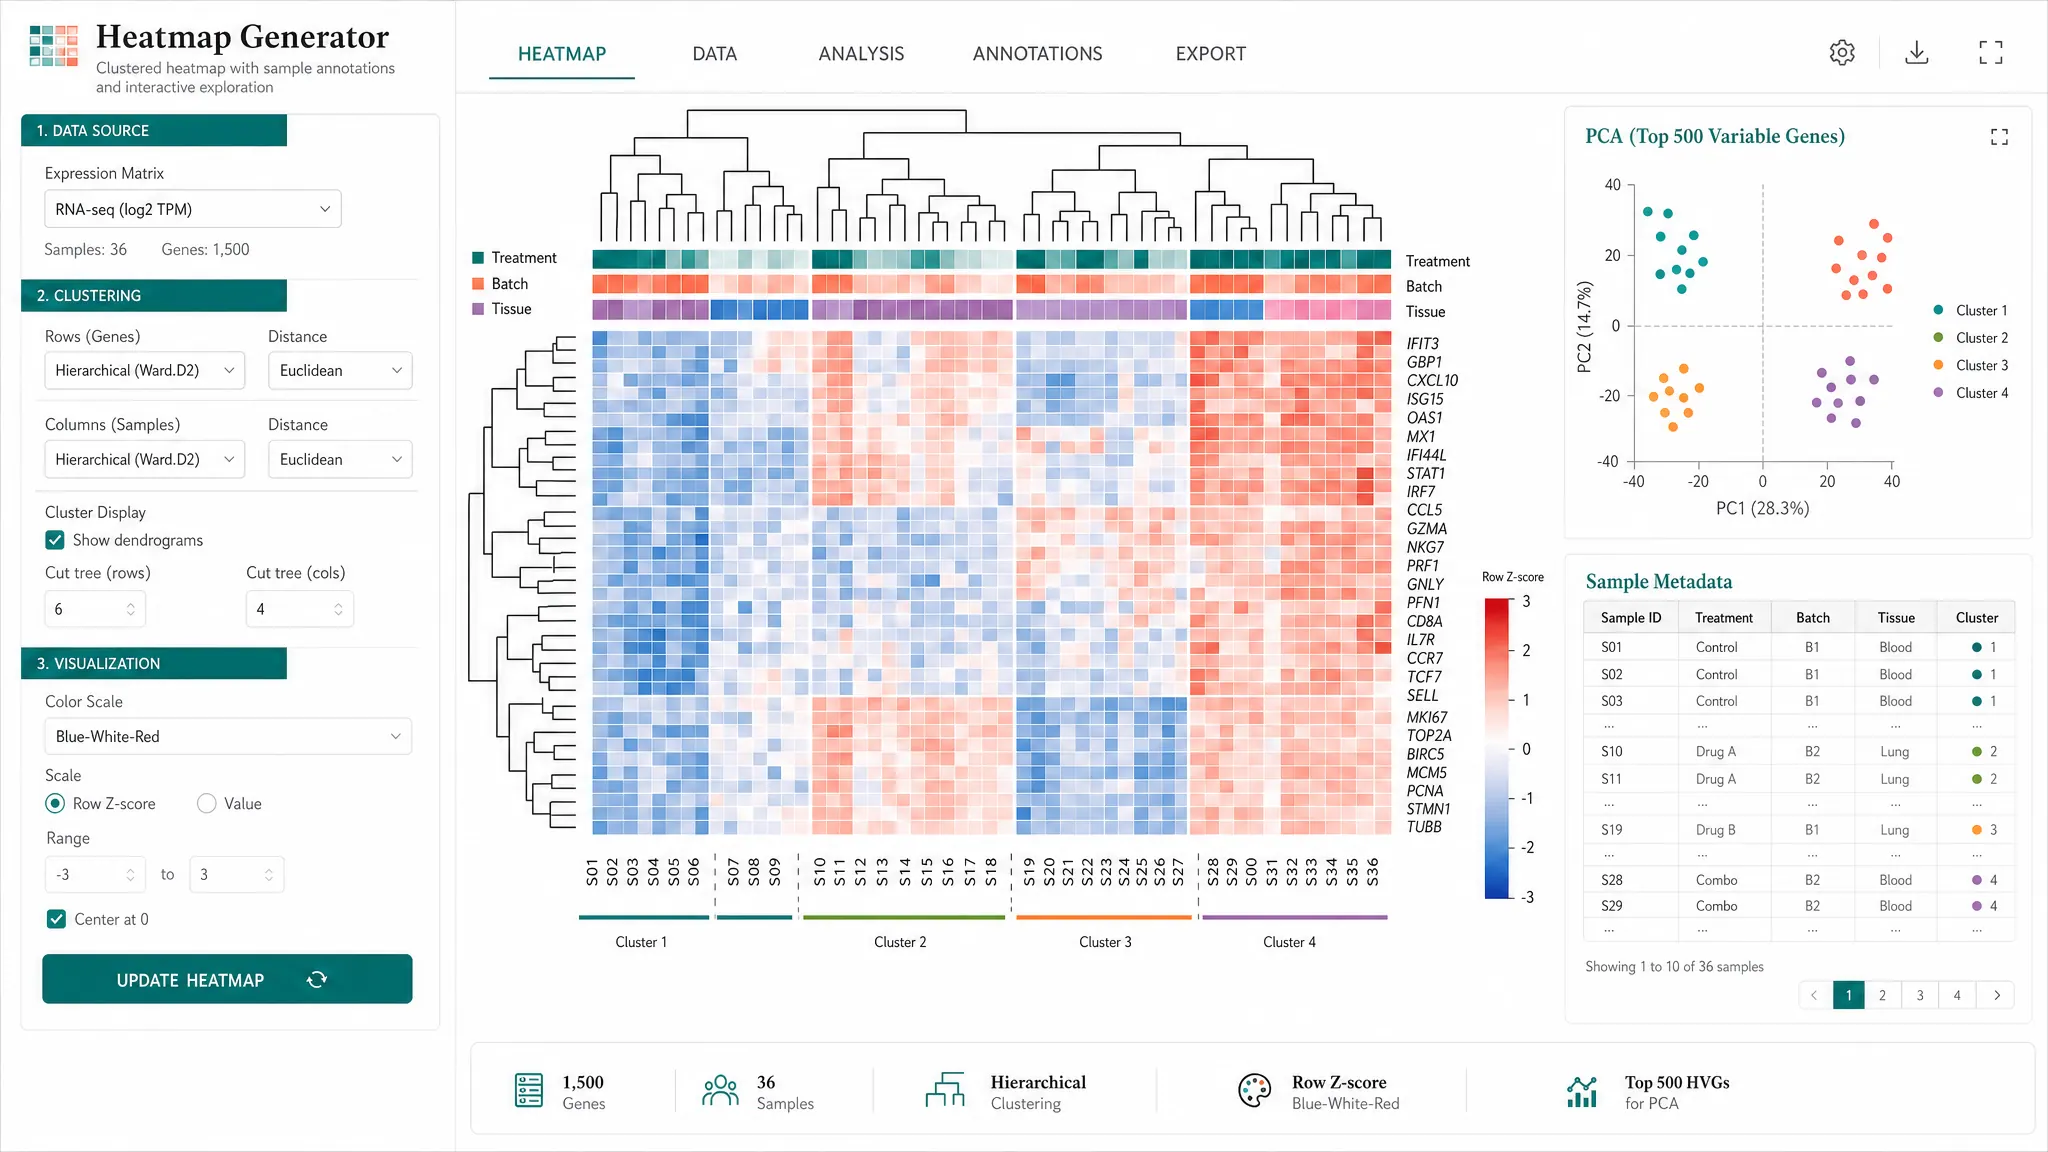
Create statistical plots from uploaded datasets, then refine them with AI-ready prompts.
Generate editable scientific figures for journal submissions, theses, posters, and slides.
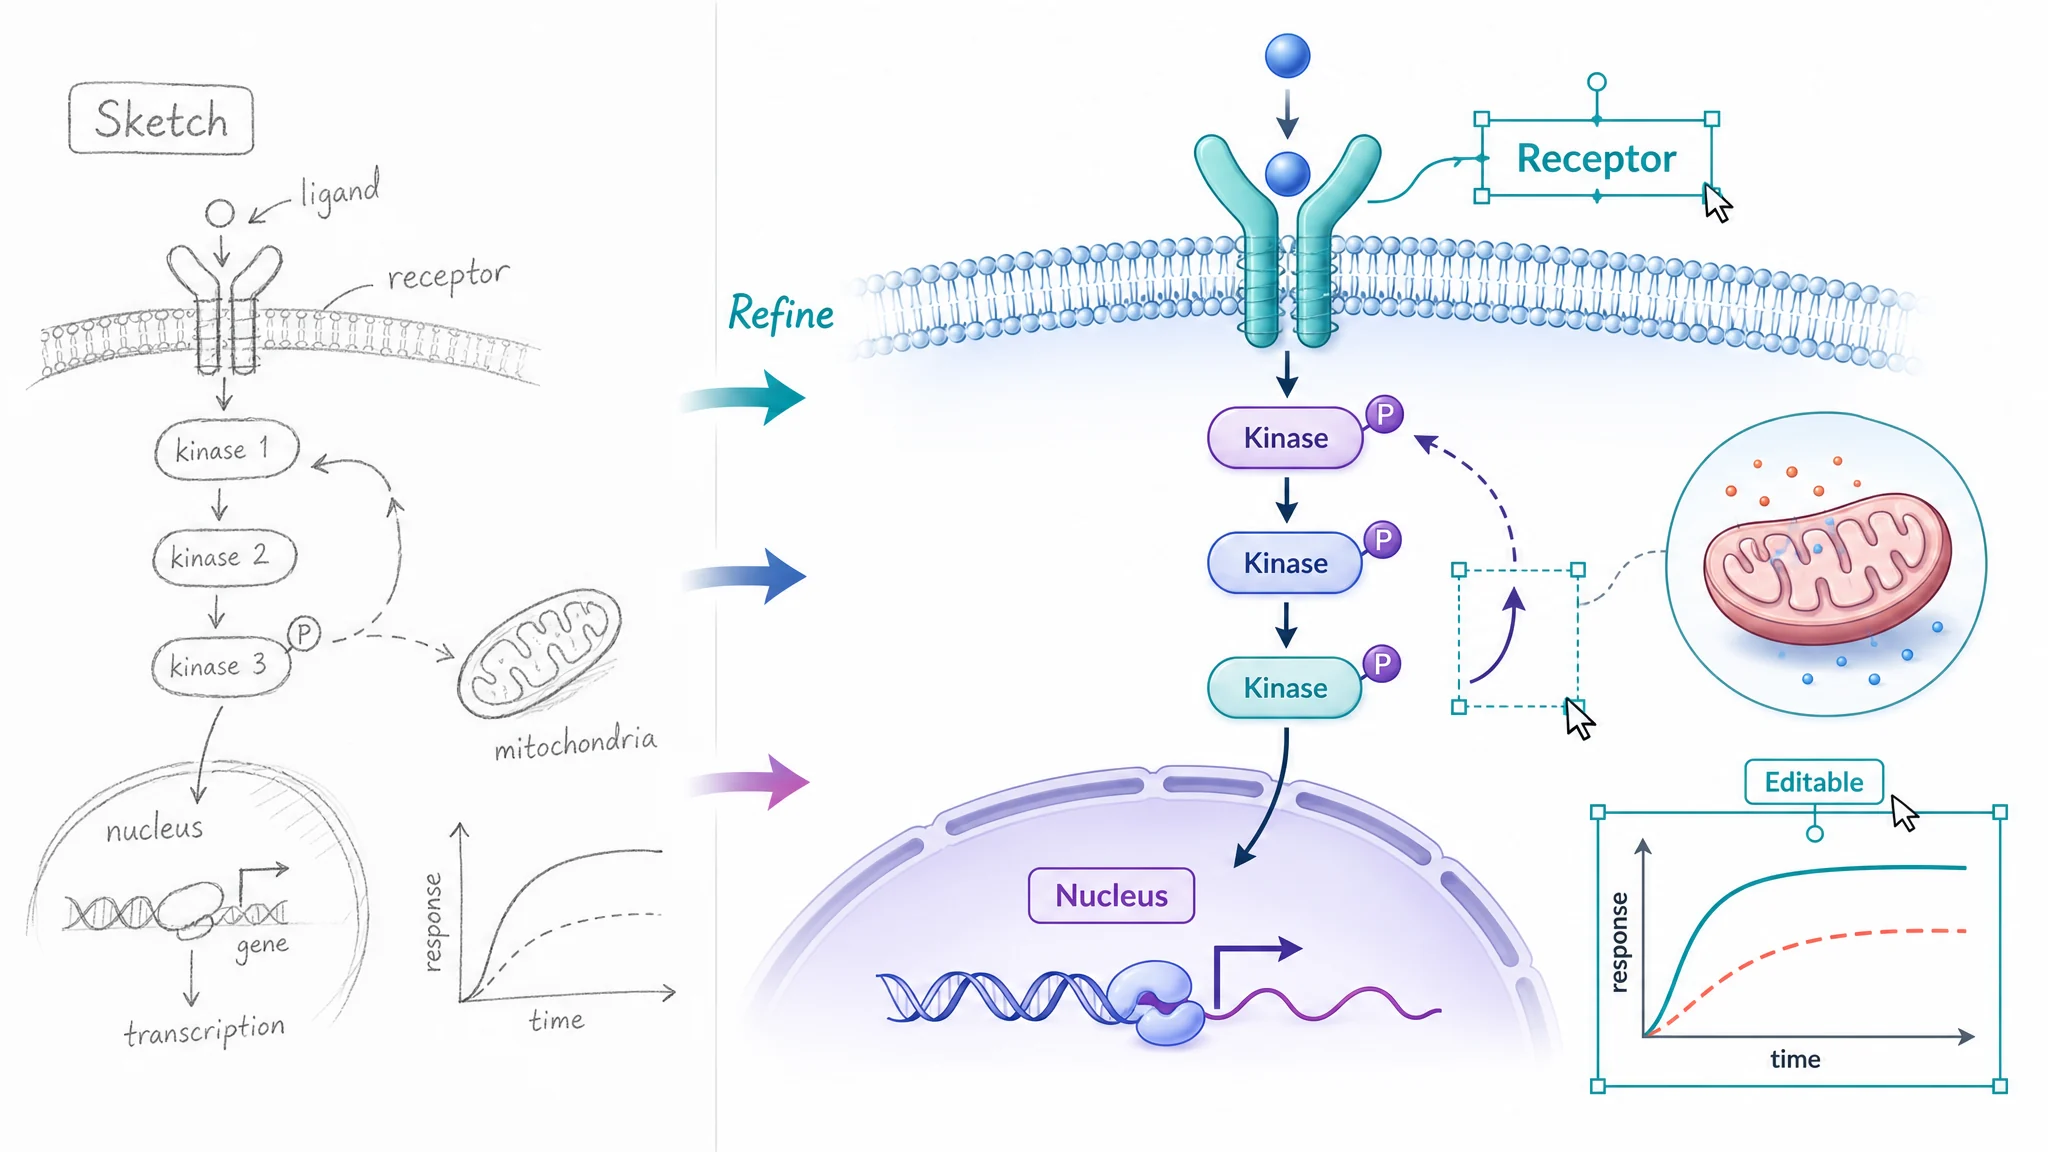
After generation, refine labels, layers, and layouts in PowerPoint, Illustrator, Figma, or Inkscape.
Make the whole figure editable, then export SVG/PPTX for final polishing.

SVG preview: editable paths, labels, and workflow nodes stay crisp for Illustrator, Figma, and Inkscape refinement.
Generate scientific illustrations from clear research prompts.
Transform hand-drawn sketches into polished scientific visuals.
Use multi-round AI refinement for precise visual adjustments.
Scale figures cleanly for journals, posters, and design software.
Export PowerPoint files with text labels you can modify directly.
Keep editing labels, colors, positions, and layout after export.
FASTER RESEARCH VISUALS, LOWER PRODUCTION COST
Move from a rough idea to an editable scientific visual without rebuilding every layout by hand.
Start from a prompt, sketch, or dataset and get a structured first draft faster than manual slide-by-slide drawing.
Use credits for the visuals you need instead of buying design software or outsourcing every revision.
Prepare readable scientific figures for manuscripts, theses, lectures, posters, and lab meetings.
Describe the figure, review the draft, then ask for cleaner labels, colors, or layout adjustments.
Start from graphical abstracts, journal covers, workflows, mechanism diagrams, pathways, cell figures, and teaching visuals.
Choose schematic, flat, 3D, photorealistic, textbook, or clean vector-like visual directions.
Create an account, keep your credits, and choose a plan or credit pack when you are ready to generate.
High-resolution and image-to-image generation may be subject to fair-use throughput limits.
Teams use prompts, sketches, and datasets to create cleaner figures for manuscripts, slides, and teaching.
SciFigure AI helped me turn an uneven pathway sketch into a structured graphical summary. I still edited the final labels, but the first layout was already close to submission quality.

We use SciFigure AI when a manuscript needs a clean mechanism figure quickly. It gives the team a shared visual draft before we spend time on final polishing.

I started with rough signaling notes and got diagrams with compartments, arrows, and readable labels. That made thesis revision much less painful.

For grant drafts, I can describe the experimental logic and get a visual that is clear enough for collaborators to review and comment on.

The chart tools help me move from CSV files to readable box plots, volcano plots, and heatmaps without rebuilding every manuscript figure manually.

For conference posters, SciFigure AI helps me keep pathway diagrams and statistical figures visually consistent across the whole page.

I use it for lecture visuals and lab handouts when I need a clean diagram faster than I can redraw one from scratch.

When I describe a cycle, food web, or lab setup, I can get a clear starting visual and adapt it for worksheets or slides.

Before You Start
Turn a prompt, sketch, or research dataset into a clear figure for papers, theses, slides, posters, and teaching.