
Free tree diagram maker
Tree diagram maker for probability trees, decision trees and tree graphs
Build a probability tree and get every path multiplied out as an exact fraction, with branch sums checked and conditional probability and Bayes worked for you. Switch to a decision tree and the expected values roll back to the best choice. Or paste an indented list and get a tidy tree graph. Everything runs in your browser, and the finished diagram downloads as SVG, PNG or PDF.
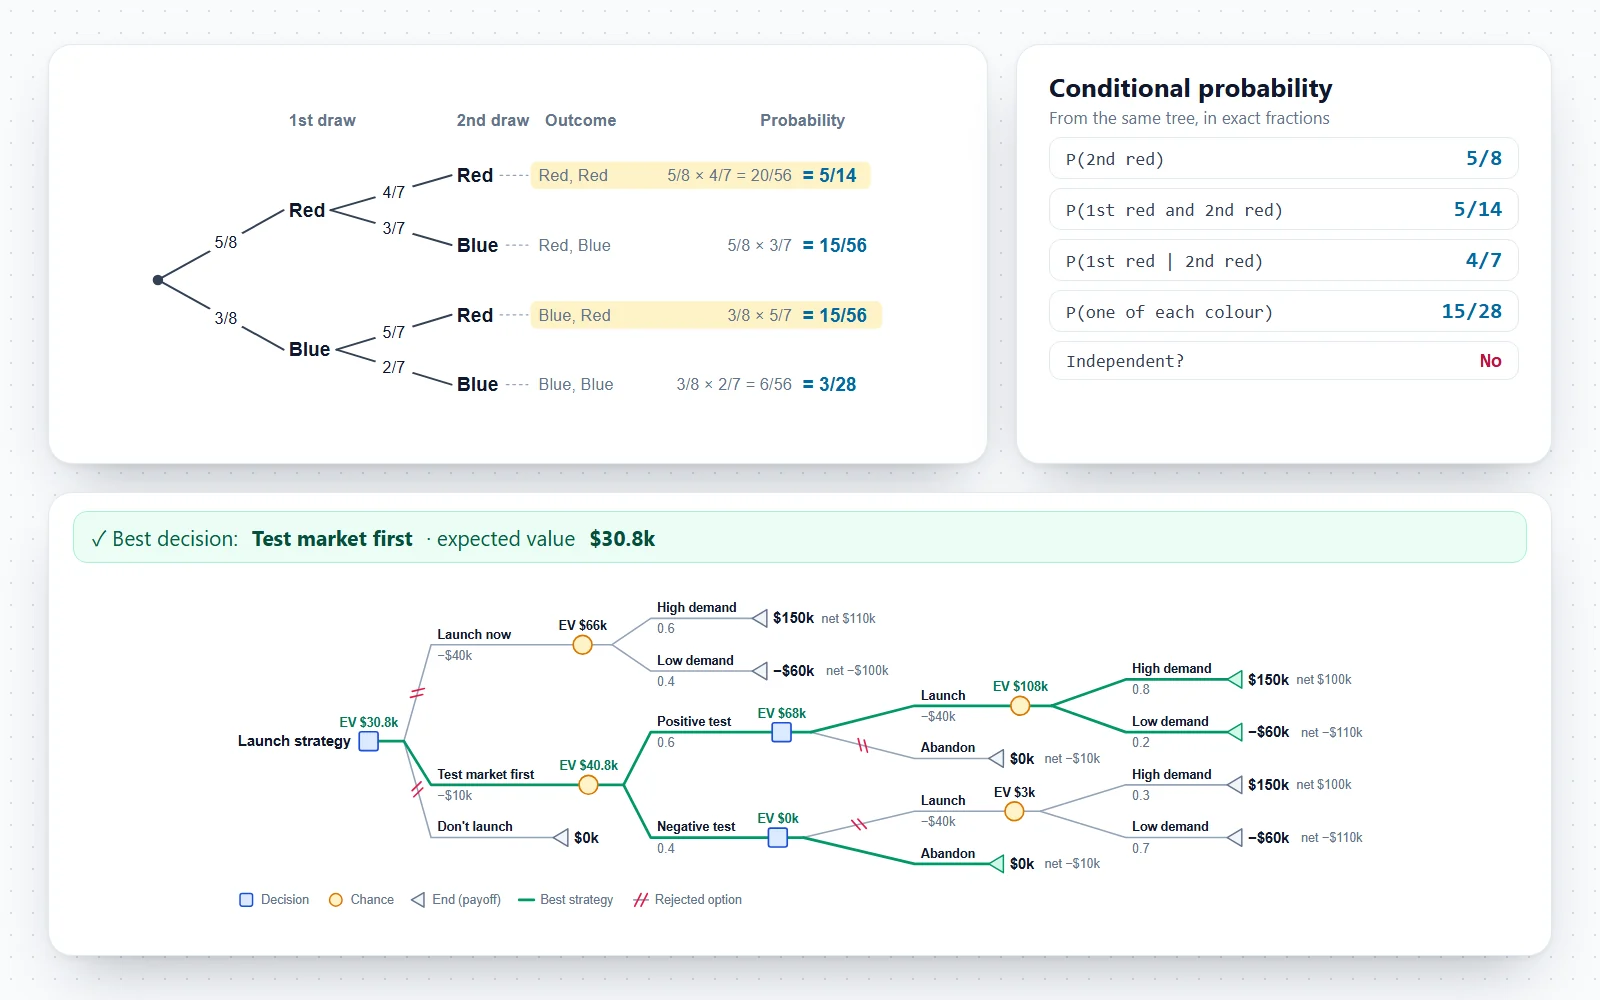
Every node’s branches add up to 1, and the 4 outcomes add up to exactly 1.
Outcomes and their probabilities
| Outcome | Multiply along the path | Probability | Decimal |
|---|---|---|---|
| 5/8 × 4/7 = 20/56 | 5/14 | ≈ 0.3571 | |
| 5/8 × 3/7 | 15/56 | ≈ 0.2679 | |
| 3/8 × 5/7 | 15/56 | ≈ 0.2679 | |
| 3/8 × 2/7 = 6/56 | 3/28 | ≈ 0.1071 | |
| Total (all outcomes) | 1 | 1 | |
Conditional probability and Bayes
- P(A)
- 5/14 + 15/56 = 5/8
- 5/80.625
- P(B)
- 5/14 + 15/56 = 5/8
- 5/80.625
- P(A and B)
- 5/14
- 5/14≈ 0.3571
- P(A or B)
- P(A) + P(B) − P(A and B) = 5/8 + 5/8 − 5/14
- 25/28≈ 0.8929
- P(A | B)
- P(A and B) ÷ P(B) = 5/14 ÷ 5/8
- 4/7≈ 0.5714
- P(B | A)
- P(A and B) ÷ P(A) = 5/14 ÷ 5/8
- 4/7≈ 0.5714
Bayes’ theorem, from the same tree
P(B | A) = P(A | B) × P(B) ÷ P(A) = 4/7 × 5/8 ÷ 5/8 = 4/7
So the chance of “1st draw = Red” once you know “2nd draw = Red” is ≈ 57.14%, against 62.5% before knowing it.
A and B are not independent: P(A) × P(B) = 25/64, but P(A and B) = 5/14.
How many times “Red” occurs
| Count | 0 | 1 | 2 |
|---|---|---|---|
| P(X = k) | 3/28 | 15/28 | 5/14 |
| Decimal | ≈ 0.1071 | ≈ 0.5357 | ≈ 0.3571 |
Expected number: E[X] = Σ k × P(X = k) = 5/4 (1.25).
Everything runs in your browser: nothing is uploaded, and your trees are kept on this device only. Undo with Ctrl+Z.
Worked example
Drawing two marbles: a probability tree, step by step
A bag holds 5 red and 3 blue marbles. You take one out, do not put it back, and take a second. What is the probability of each colour combination?
- 1. Branch for the first draw. There are 8 marbles, so P(red) = 5/8 and P(blue) = 3/8. The two branches add up to 1.
- 2. Branch again from each outcome. After a red, 4 red and 3 blue are left: 4/7 and 3/7. After a blue, 5 red and 2 blue are left: 5/7 and 2/7. The second-draw probabilities depend on the first draw, which is what makes these events dependent.
- 3. Multiply along each path. P(red, red) = 5/8 × 4/7 = 20/56 = 5/14. The four path probabilities add up to exactly 1.
- 4. Add the paths that make up an event. One marble of each colour happens on two paths, so P(one of each) = 15/56 + 15/56 = 15/28. At least one red is everything except blue-blue: 1 − 3/28 = 25/28.
With or without replacement
Put the first marble back and the second draw no longer depends on the first: every second-stage branch is 5/8 or 3/8 again. The tree has the same shape; only the numbers on the second stage change.
| Outcome | Without replacement | P | With replacement | P |
|---|---|---|---|---|
| Red, Red | 5/8 × 4/7 | 5/14 ≈ 0.3571 | 5/8 × 5/8 | 25/64 ≈ 0.3906 |
| Red, Blue | 5/8 × 3/7 | 15/56 ≈ 0.2679 | 5/8 × 3/8 | 15/64 ≈ 0.2344 |
| Blue, Red | 3/8 × 5/7 | 15/56 ≈ 0.2679 | 3/8 × 5/8 | 15/64 ≈ 0.2344 |
| Blue, Blue | 3/8 × 2/7 | 3/28 ≈ 0.1071 | 3/8 × 3/8 | 9/64 ≈ 0.1406 |
One result surprises most students: without replacement, the chance that the second marble is red is still 5/8, the same as the first. The tree shows why: 5/14 + 15/56 = 5/8. What changes is the conditional probability: given that the second marble is red, the first was red with probability 4/7, not 5/8.
Rolling back a decision tree
The Product launch example asks whether to launch now, pay $10k to test the market first, or walk away. Demand is high with probability 0.6; a market test comes back positive 60% of the time, and after a positive test high demand rises to 0.8. Work from the right-hand end back to the root:
- Chance nodes average. Launching after a positive test is worth 0.8 × 150 + 0.2 × (−60) = $108k before its $40k cost. Launching now is worth 0.6 × 150 + 0.4 × (−60) = $66k before its cost.
- Decision nodes pick the best branch. After a positive test, launching gives $68k against 0 for abandoning, so you launch. After a negative test, launching would give 0.3 × 150 + 0.7 × (−60) − 40 = −37, so you abandon ($0k).
- Keep going to the root. Testing is worth −10 + 0.6 × 68 + 0.4 × 0 = $30.8k, more than launching now (−40 + 66 = 26) or not launching (0). The market test pays for itself because it lets you avoid launching into weak demand.
Trees turn up all over science. For evolutionary relationships drawn from sequence data, use the phylogenetic tree maker or, from a table of shared traits, the cladogram maker. A family tree with inheritance symbols is a job for the pedigree chart maker, and the probabilities of a genetic cross are the same multiplication as a tree, laid out in the Punnett square maker. An identification key is a yes-or-no decision tree: build one with the dichotomous key maker. When ideas link across branches rather than strictly down a hierarchy, a concept map fits better than a tree.
How to use this tree diagram maker
Pick the kind of tree at the top of the editor. Each kind keeps its own tree, so you can switch between them without losing work, and every change can be undone with Ctrl+Z.
- Probability tree: start from an example (marbles with and without replacement, coin tosses, a medical test, rain and lateness) or from a template, then click any outcome or probability to change it. Each leaf shows its path probability, multiplied out exactly.
- Decision tree: square decision nodes, round chance nodes and triangular end nodes. Give each end node a payoff and each chance branch a probability; the expected values roll back automatically and the best branch is drawn in green.
- Tree graph: type or paste an indented outline, one node per line, and the tree is laid out as you type. Or click a node and add children, siblings, indents and outdents, and give single nodes their own shape and colour.
- Keyboard: select a node, then Enter adds a sibling, Tab adds a branch, Delete removes it, the arrow keys move between nodes, and F2 jumps to its label. In a label field, Enter adds the next sibling, so a whole stage can be typed without the mouse.
- Style: left to right or top down, straight, bracket, elbow or curved branches, colour or black and white, and sliders for text size and spacing. The layout keeps every label clear of the others whatever you type.
- Export: SVG for vector editing, PNG for documents and slides, PDF through the print dialog, a CSV of the outcomes or roll-back table, the outline as text, or a .json file you can open again later.
What is a tree diagram?
A tree diagram shows outcomes, choices or categories as branches that split from a single starting point and never join up again. OpenStax’s Introductory Statistics defines it as a graph of the possible outcomes of an experiment, with branches labelled by probabilities or frequencies. In graph theory the same shape is called a tree: a connected graph with no cycles.
- The root is where the tree starts: the first draw, the first decision, or the top of a hierarchy.
- Each branch leads to a node, and a node with branches of its own is a parent of the nodes they lead to. Nodes with no branches are leaves.
- A path runs from the root to one leaf. In a probability tree each path is one outcome of the whole experiment, so the leaves list the sample space.
- The depth of a node is the number of branches between it and the root; the height of the tree is the depth of its deepest leaf.
- Because branches never rejoin, every node has exactly one parent, which is what separates a tree from a flowchart or a concept map.
- Common kinds include probability trees, decision trees, classification trees, factor trees, syntax trees, family trees and evolutionary trees. This maker draws the first three in full and any of the others as a tree graph.
How to draw a probability tree diagram, step by step
A probability tree turns a multi-stage experiment into simple multiplication. The rules are the same whether you draw it by hand or with a probability tree generator.
- Start with a single point on the left. Draw one branch for each outcome of the first stage and write its probability on the branch.
- Check that the branches leaving the point add up to 1. If one is missing, it is 1 minus the others; in this tool you can leave that branch blank and it is filled in for you.
- From the end of every first-stage branch, draw the second stage. Its probabilities are conditional: they are the chances of each outcome given the path so far.
- Repeat for every stage. Each set of branches leaving a node must again add up to 1.
- Multiply the probabilities along each path to get the probability of that whole outcome. Write it at the end of the path.
- For an event made of several paths, such as “one of each colour”, add the path probabilities. All the path probabilities together add up to exactly 1, which is a good final check.
Independent and dependent events: with and without replacement
The second stage of a tree is where independence shows. If the second-stage branches are the same after every first-stage outcome, the events are independent; if they change, the events are dependent.
- With replacement, the first marble goes back in the bag, so the second draw sees the same bag. A bag of 5 red and 3 blue gives 5/8 and 3/8 on every branch, and P(red, red) = 5/8 × 5/8 = 25/64.
- Without replacement, the bag has one marble fewer and its mix depends on the first draw. After a red, 4 of the 7 left are red, so P(red, red) = 5/8 × 4/7 = 20/56 = 5/14.
- Coin tosses, dice rolls and spins of a spinner are independent: the coin has no memory. Drawing cards, choosing people from a group or sampling without putting back are dependent.
- Two events are independent exactly when P(A and B) = P(A) × P(B). The Calculate tab tests this for any two events you define and shows both sides.
- For large populations the difference fades: drawing 2 people from 10,000 barely changes the mix, which is why surveys can be analysed as if sampling were with replacement.
Conditional probability and Bayes’ theorem on a tree
A tree is the clearest way to reverse a conditional probability. The branches give P(test result | condition); Bayes’ theorem asks for P(condition | test result), and the tree answers it by adding paths.
- Take an illustrative screening test: 1% of people have the condition, the test finds 90% of them (sensitivity), and it correctly clears 91% of people without it (specificity), so 9% of them get a false positive.
- In 10,000 people, 100 have the condition and 90 of them test positive; of the 9,900 who do not, 891 test positive. That is 981 positives, of whom only 90 are ill.
- So P(condition | positive) = 90 / 981, about 9.2%. On the tree that is the path “condition, positive” divided by the sum of both “positive” paths: 0.009 ÷ (0.009 + 0.0891).
- The low answer comes from the low prevalence, not from a poor test. The same test applied where half the people are ill would be right about 91% of the time when it says positive.
- Counting people instead of probabilities, as above, is the natural-frequency method that Gigerenzer and Hoffrage showed makes Bayesian problems much easier to solve.
- In the tool, load the Medical test example: event A is “Test result = Positive” and event B is “Condition = Has condition”, and the read-out gives P(B | A) with Bayes’ formula written out in exact fractions.
Counting outcomes with a tree: the multiplication principle
Before probability, tree diagrams are a counting tool. OpenStax’s Contemporary Mathematics uses them to list every outcome of a multi-stage experiment, one leaf per outcome.
- If the first stage has 3 outcomes, the second 2 and the third 2, the tree has 3 × 2 × 2 = 12 leaves: 3 shirts, 2 pairs of trousers and 2 pairs of shoes make 12 outfits.
- Three coin tosses give 2 × 2 × 2 = 8 outcomes from HHH to TTT. Three of them contain exactly two heads, so P(exactly 2 heads) = 3/8.
- When every outcome is equally likely, leave all the branch probabilities blank: the tool treats blank sibling branches as equally likely and the path products count the outcomes for you.
- Trees grow fast. Five stages with three outcomes each already have 243 leaves, which is why textbooks switch to the counting formulas (permutations and combinations) for bigger problems.
Decision trees: nodes, payoffs and expected value
A decision tree, in the decision-analysis sense, lays out a choice, the uncertain events that follow it and what each combination is worth. John Magee’s 1964 Harvard Business Review article is the classic introduction to drawing them for business decisions.
- Squares are decisions you make, circles are chance events with probabilities, and triangles are end nodes with a payoff. Probabilities after each circle must add up to 1.
- Roll back from right to left. At a chance node, the expected value is the sum of each branch’s probability times its value. At a decision node, keep the best branch and cut the others, marked here with a double stroke, as decision-analysis software marks rejected options.
- Costs can sit on a branch, such as −40 for launching a product, while end nodes keep the gross payoff. The roll-back adds the branch value before comparing options, and each end node can show its net value.
- For costs, losses or waiting times, switch the goal to “Minimise cost” and the tree picks the smallest expected value instead.
- The risk profile lists what the recommended strategy can actually lead to and how likely each result is. Two strategies with the same expected value can carry very different risks.
- Change a probability and watch the choice flip. In the crop-variety example the standard variety wins while the chance of a dry season is below 0.4; above it, the drought-tolerant variety does.
- A decision tree generator for machine learning is a different thing: it learns splitting rules from data (CART, ID3) to classify cases. This tool draws decision-analysis trees from numbers you give it.
Tree graphs from an outline: hierarchies, classifications and factor trees
Most hierarchies already exist as indented lists in notes or documents. Paste one into the outline box and it becomes a tree chart; bullets, numbers, spaces and tabs are all understood.
- Classification: matter into pure substances and mixtures, organisms into groups, or the sections of a review article.
- Organisation charts: a lab, a department or a project team, coloured by branch so each group stands out.
- Math tree diagrams: the factor tree generator splits a number into factor pairs until only primes remain, and circles the primes. 360 becomes 18 × 20, then 3 × 6 and 4 × 5, ending at 2 × 2 × 2 × 3 × 3 × 5.
- Sentence trees: a phrase-structure tree for a short sentence, drawn as plain text with straight branches.
- Layout follows the tidy-tree rules of Reingold and Tilford: parents centred over their children, identical subtrees drawn identically, and no two boxes on a level overlapping, however long the labels are.
- Long labels wrap at the width you choose, and single nodes can be given their own shape (box, pill, circle, text only) and colour.
Tree diagram or another diagram?
Trees are one of several ways to show the same information. Pick the one that matches the question you are asking.
- Two-way table: best for two stages with two outcomes each, where you want the totals in the margins. A tree shows the same numbers in the order things happen and extends to three or more stages.
- Venn diagram: shows how events overlap, not the order they happen in. Use it for “and”, “or” and “not”; use a tree when the probabilities change from stage to stage.
- Punnett square: a grid for one genetic cross. It is a two-stage tree written as a table, one parent’s gametes on each side.
- Flowchart: steps can loop back and paths can merge. A tree never merges, so a process with “go back to step 2” is a flowchart.
- Concept map or mind map: ideas linked across branches with labelled lines. A tree allows only one parent per node.
- Phylogenetic tree and cladogram: trees of evolutionary descent, built from sequence data or shared traits. Dichotomous key: a yes-or-no decision tree for identifying organisms. Pedigree: a family tree with standard genetic symbols.
Common mistakes on probability tree diagrams
Most wrong answers from tree diagrams come from a handful of slips. The checks built into the tool catch the first three automatically.
- Branches that do not add up to 1. Rounding 1/3 to 0.33 three times gives 0.99; type 1/3, or leave one branch blank so it becomes the exact complement.
- Using the first-stage probability again on the second stage of a without-replacement problem. After one red is gone, red is 4/7, not 5/8.
- Adding along a path instead of multiplying. Multiply along a path; add across paths.
- Forgetting a path. “One of each colour” is red-then-blue and blue-then-red; leaving one out halves the answer.
- Confusing P(A | B) with P(B | A). The probability of a positive test given the condition is not the probability of the condition given a positive test, as the screening example shows.
- Simplifying too early and losing track. The working column keeps the unsimplified product, such as 20/56, next to the simplified 5/14, so the method is visible.
Tree diagrams for worksheets, papers and slides
The same tree can serve a lesson, a homework sheet and a figure in a report.
- Worksheet mode keeps the tree and either blanks the path probabilities or every probability, with answer lines to fill in. Print one copy with answers and one without.
- Black and white mode prints cleanly on any printer and suits journals that ask for grayscale figures.
- Export SVG for Illustrator, Inkscape or PowerPoint, where every line and label stays editable. PNG exports at two to four times screen size for sharp slides.
- Raise the text size before exporting a wide tree for a slide; the layout re-spaces itself so labels never collide.
- State the probabilities as fractions in maths classes and as decimals or percentages in science and medicine; the display setting switches the whole diagram at once.
Frequently asked questions
Is this tree diagram maker free?
Yes. There is no sign-up, no watermark and no limit on how many trees you make or export. It runs entirely in your browser, nothing you type is uploaded, and your last trees are kept on your own device for when you come back.
How do I make a probability tree diagram?
Choose Probability tree, then load an example or start blank. Click an outcome to rename it, click a probability on a branch to change it, and use Add branch for the next stage. The probability of each complete path appears at the end of its branch, multiplied out exactly. For bags of marbles, repeated trials or a medical test, Build from a template creates the whole tree from a few numbers.
How do you work out probabilities on a tree diagram?
Multiply along the branches to get the probability of one path, and add the probabilities of all the paths that make up an event. For two draws without replacement from 5 red and 3 blue marbles, P(red, red) = 5/8 × 4/7 = 5/14, and P(one of each colour) = 15/56 + 15/56 = 15/28.
Can I use fractions, decimals or percentages?
Any of them, even mixed in one tree: 3/10, 0.3 and 30% all mean the same. The arithmetic is done with exact fractions, so 1/3 × 3/7 is exactly 1/7 and a tree of thirds adds up to exactly 1. The diagram can show the numbers as you typed them or convert everything to fractions, decimals or percentages.
Do the branches have to add up to 1?
Yes, the branches leaving each node must add up to 1, because one of those outcomes has to happen. The tool checks every node and points to any that do not. Leave one branch blank, or type #, and it is filled in as the complement of the others.
Can the tool do conditional probability and Bayes’ theorem?
Yes. On the Calculate tab, define two events, such as “the test is positive” and “the person has the condition”. The read-out gives P(A), P(B), P(A and B), P(A or B), both conditional probabilities and Bayes’ theorem written out in fractions, and says whether the two events are independent.
What is the difference between with and without replacement?
With replacement, each item goes back before the next draw, so the probabilities stay the same at every stage and the draws are independent. Without replacement, each draw changes what is left, so the second-stage probabilities depend on the first draw. The bag template builds either version from the same counts.
How do I make a decision tree?
Choose Decision tree. The first node is a decision: add a branch for each option. Turn a branch into a chance node to add uncertain outcomes with probabilities, and give every end node a payoff. Costs such as an investment go in the branch value field. The tool rolls back the expected values and highlights the best decision as you type.
How is the expected value of a decision tree calculated?
From the end nodes back to the start. A chance node is worth the sum of each branch’s probability times the value after it; a decision node is worth its best branch. In the product launch example, testing the market first is worth −10 + 0.6 × 68 + 0.4 × 0 = 30.8, more than the 26 of launching straight away.
What do the squares, circles and triangles mean in a decision tree?
A square is a decision node, where you choose a branch. A circle is a chance node, where the branch is decided by probability. A triangle is an end node carrying a payoff. Rejected options are marked with a double stroke, and the recommended path is drawn thicker in green.
Is this a machine learning decision tree generator?
No. Machine learning decision trees are learned from a data set by algorithms such as CART, and libraries like scikit-learn draw them for you. This tool draws decision-analysis trees, the kind used in business, medicine and economics, from probabilities and payoffs you supply.
Can I make a tree graph from a list?
Yes. Choose Tree graph and paste an indented list into the outline box: one node per line, with spaces or tabs to show the level. Bullets and numbering are ignored. The tree redraws as you type, and the outline also works in the other two modes with probabilities and payoffs written after each name.
Can I make a factor tree or a sentence tree?
Yes. In Tree graph mode, the factor tree generator splits any whole number into factor pairs down to its primes and circles them. A sentence (syntax) tree is an example you can load and edit; set the shape to Text only for the usual linguistics look.
Can I make a blank tree diagram worksheet?
Yes. Under Style, Worksheet set to Blank answers keeps the branch probabilities and leaves answer lines for the path probabilities; All blank removes every probability. Export or print the blank version for students and keep the answer version for yourself.
How do I put the tree diagram in Word, PowerPoint or a paper?
Use Copy image and paste it straight into a document or slide, or download a PNG. For a paper or poster, download the SVG or save a PDF from the print dialog, which stay sharp at any size. Black and white mode suits journals that print in grayscale.
Is my tree saved?
Your trees are saved automatically in this browser and restored when you return. To move a tree to another device or keep several versions, use More, then Save tree file, and open it again later with Open tree file.
Related tree and diagram tools
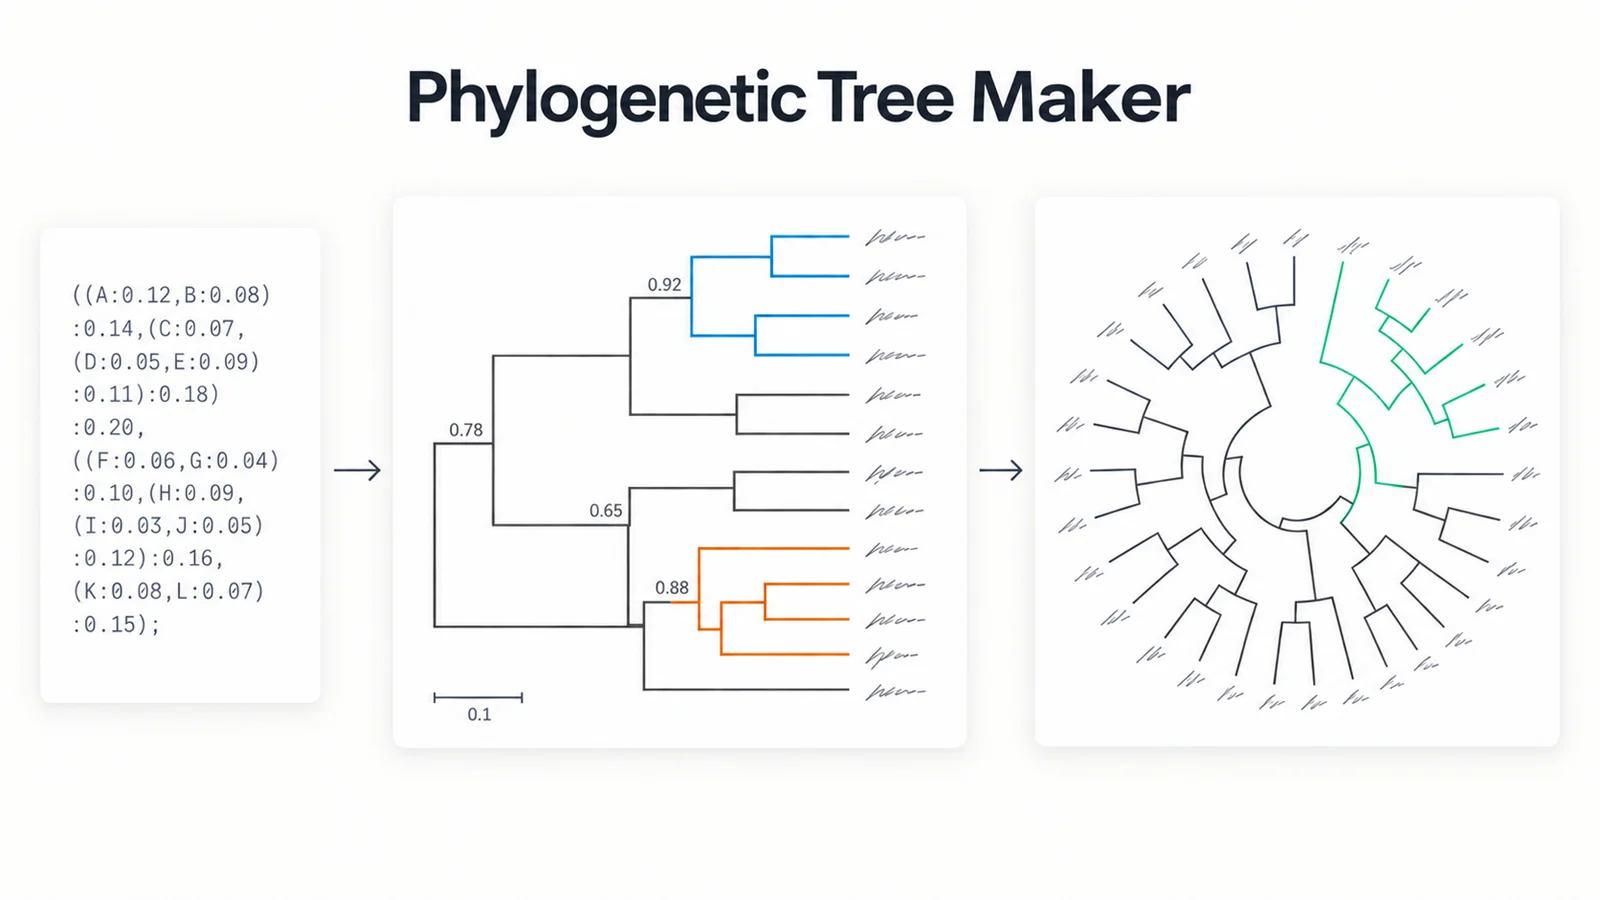
Phylogenetic Tree Maker
Draw evolutionary trees from Newick files, with branch lengths, support values and clades.
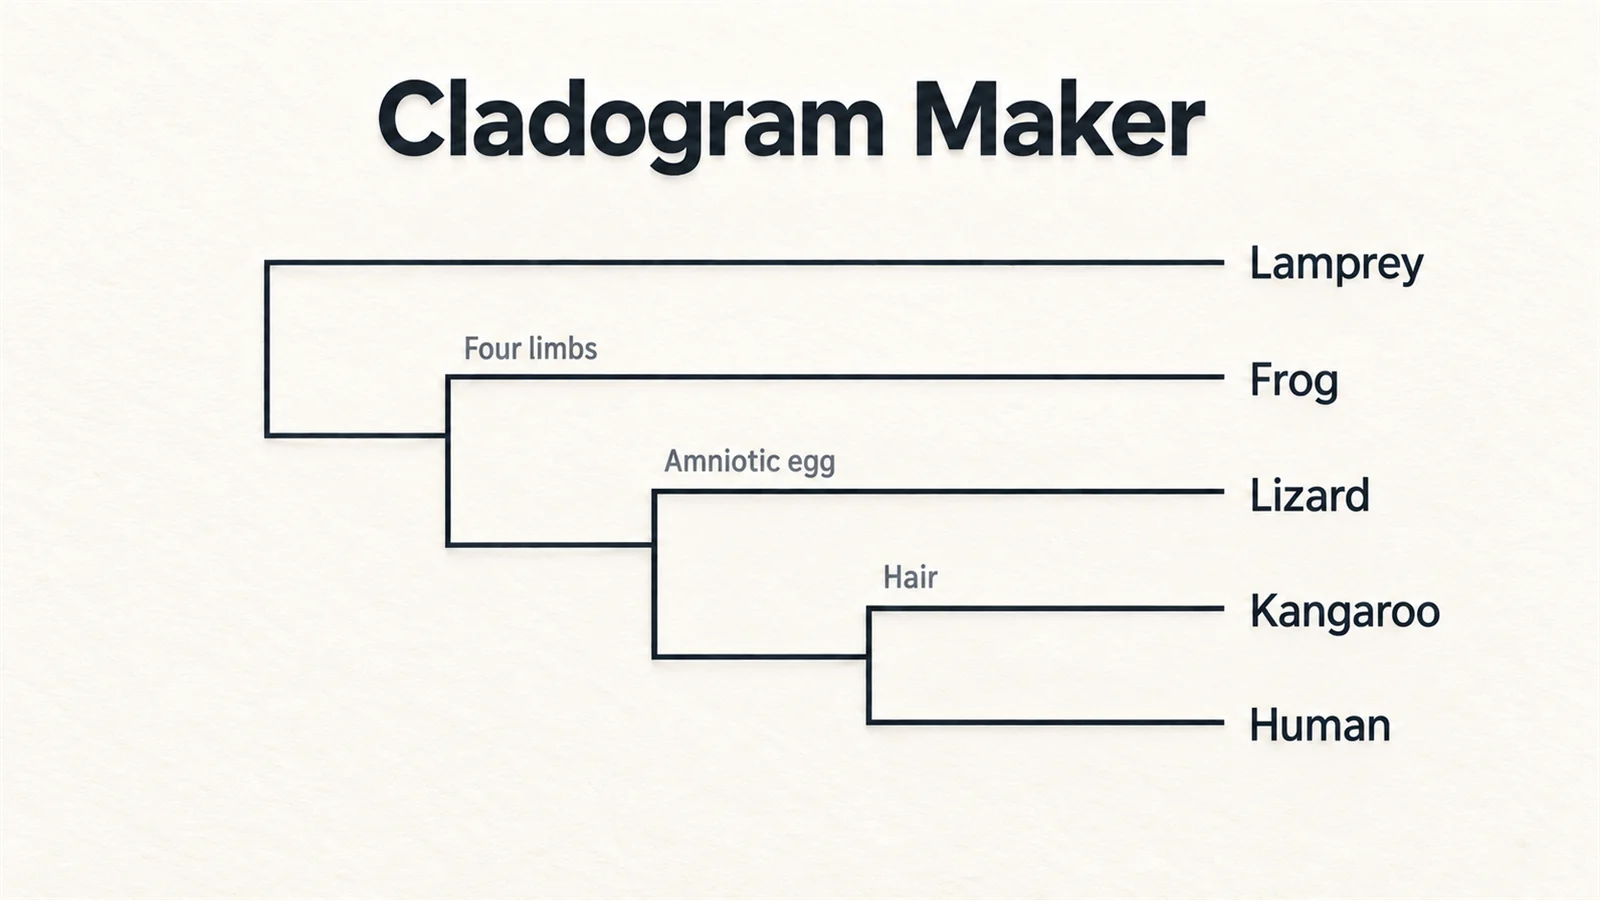
Cladogram Maker
Build a cladogram from a table of shared traits and see where each one evolved.
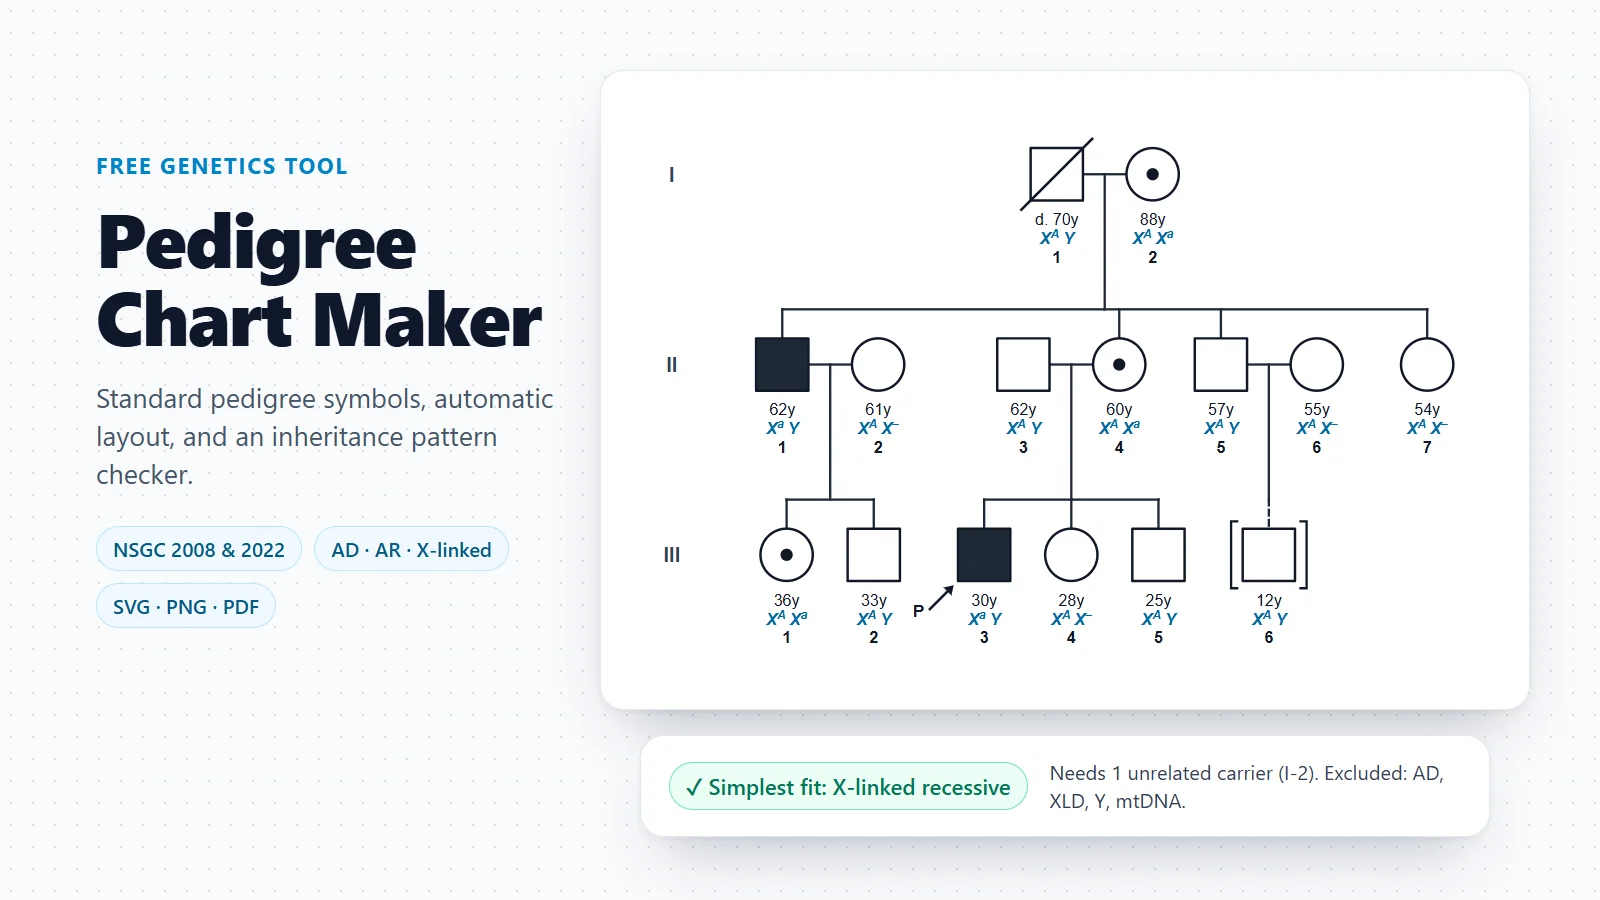
Pedigree Chart Maker
Draw a family tree with standard genetic symbols and check its inheritance pattern.
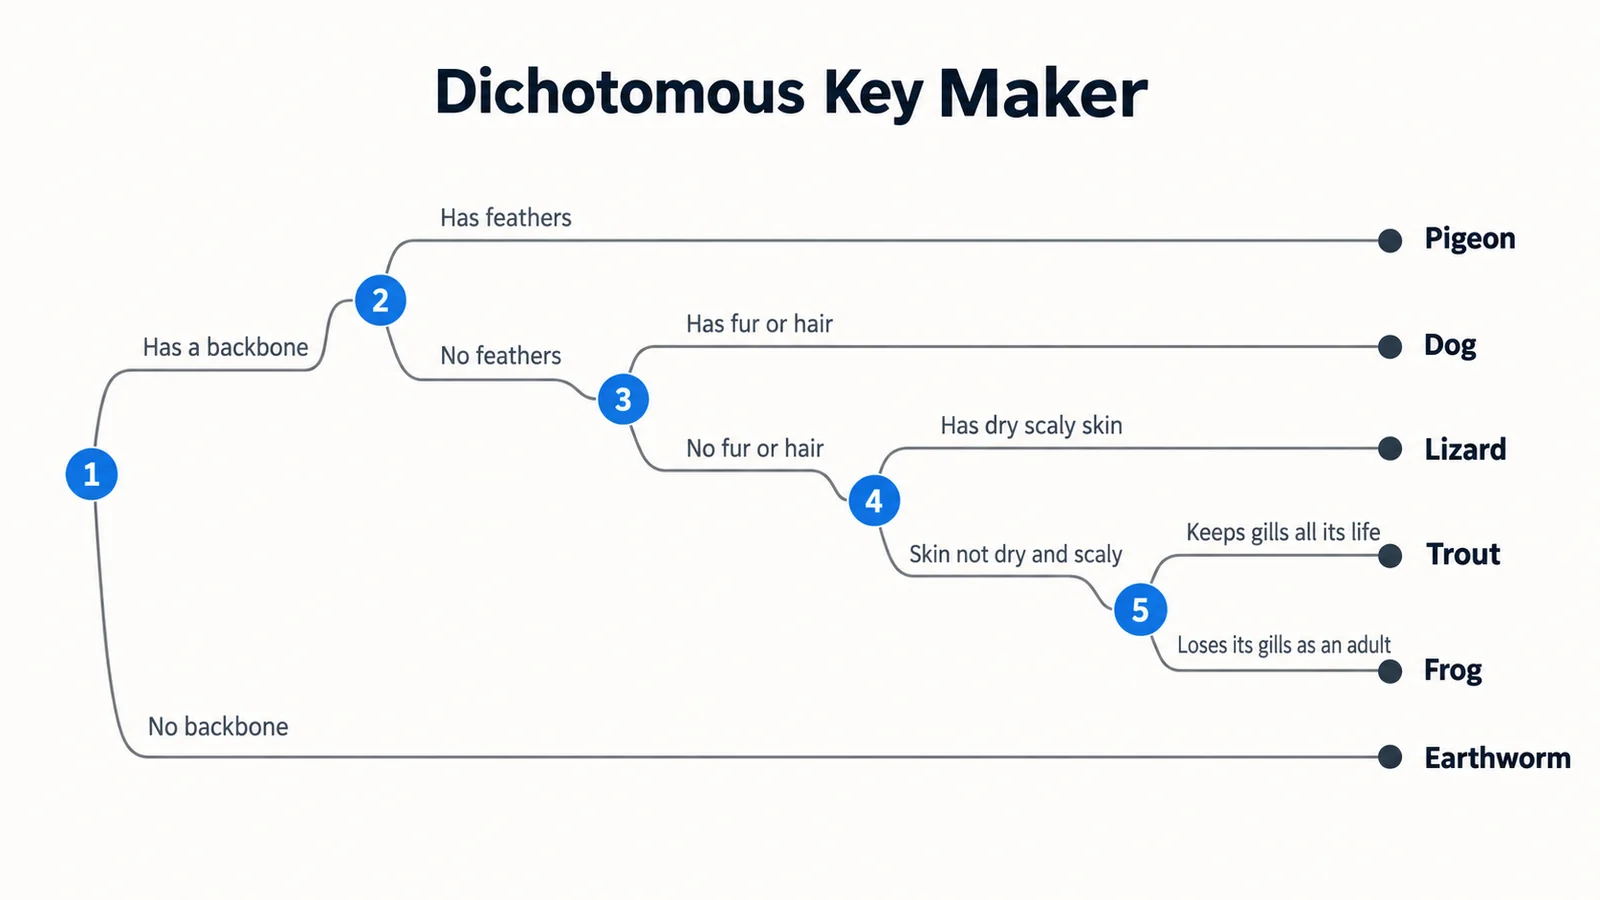
Dichotomous Key Maker
Turn a trait table into a yes-or-no identification key, a decision tree for organisms.
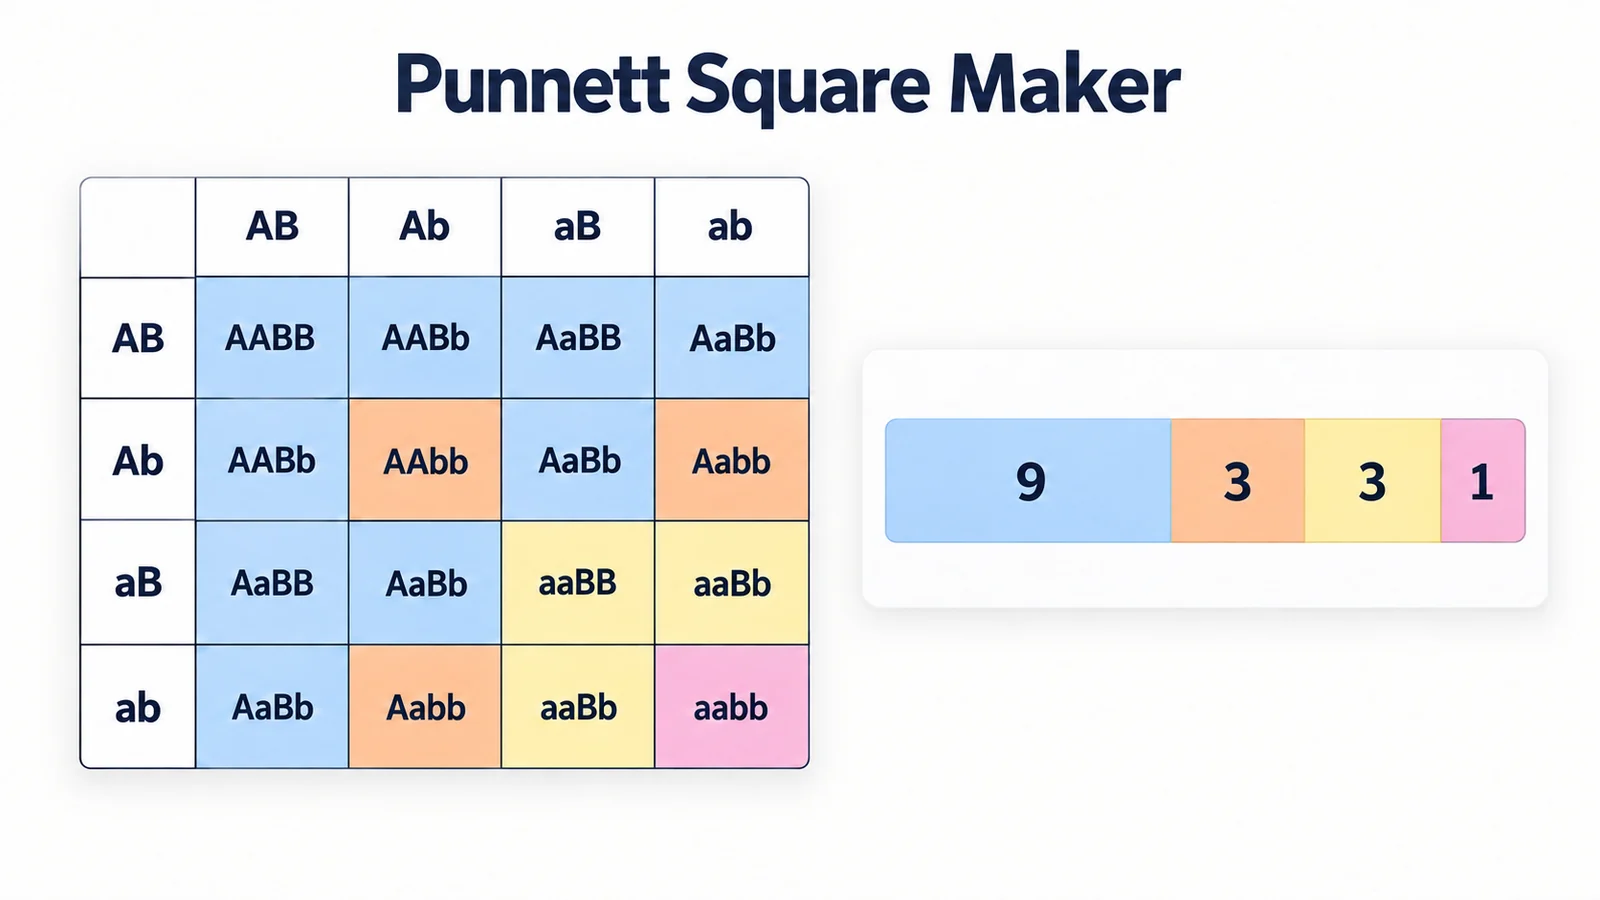
Punnett Square Maker
Work out the offspring ratios of a genetic cross, the same multiplication as a probability tree.
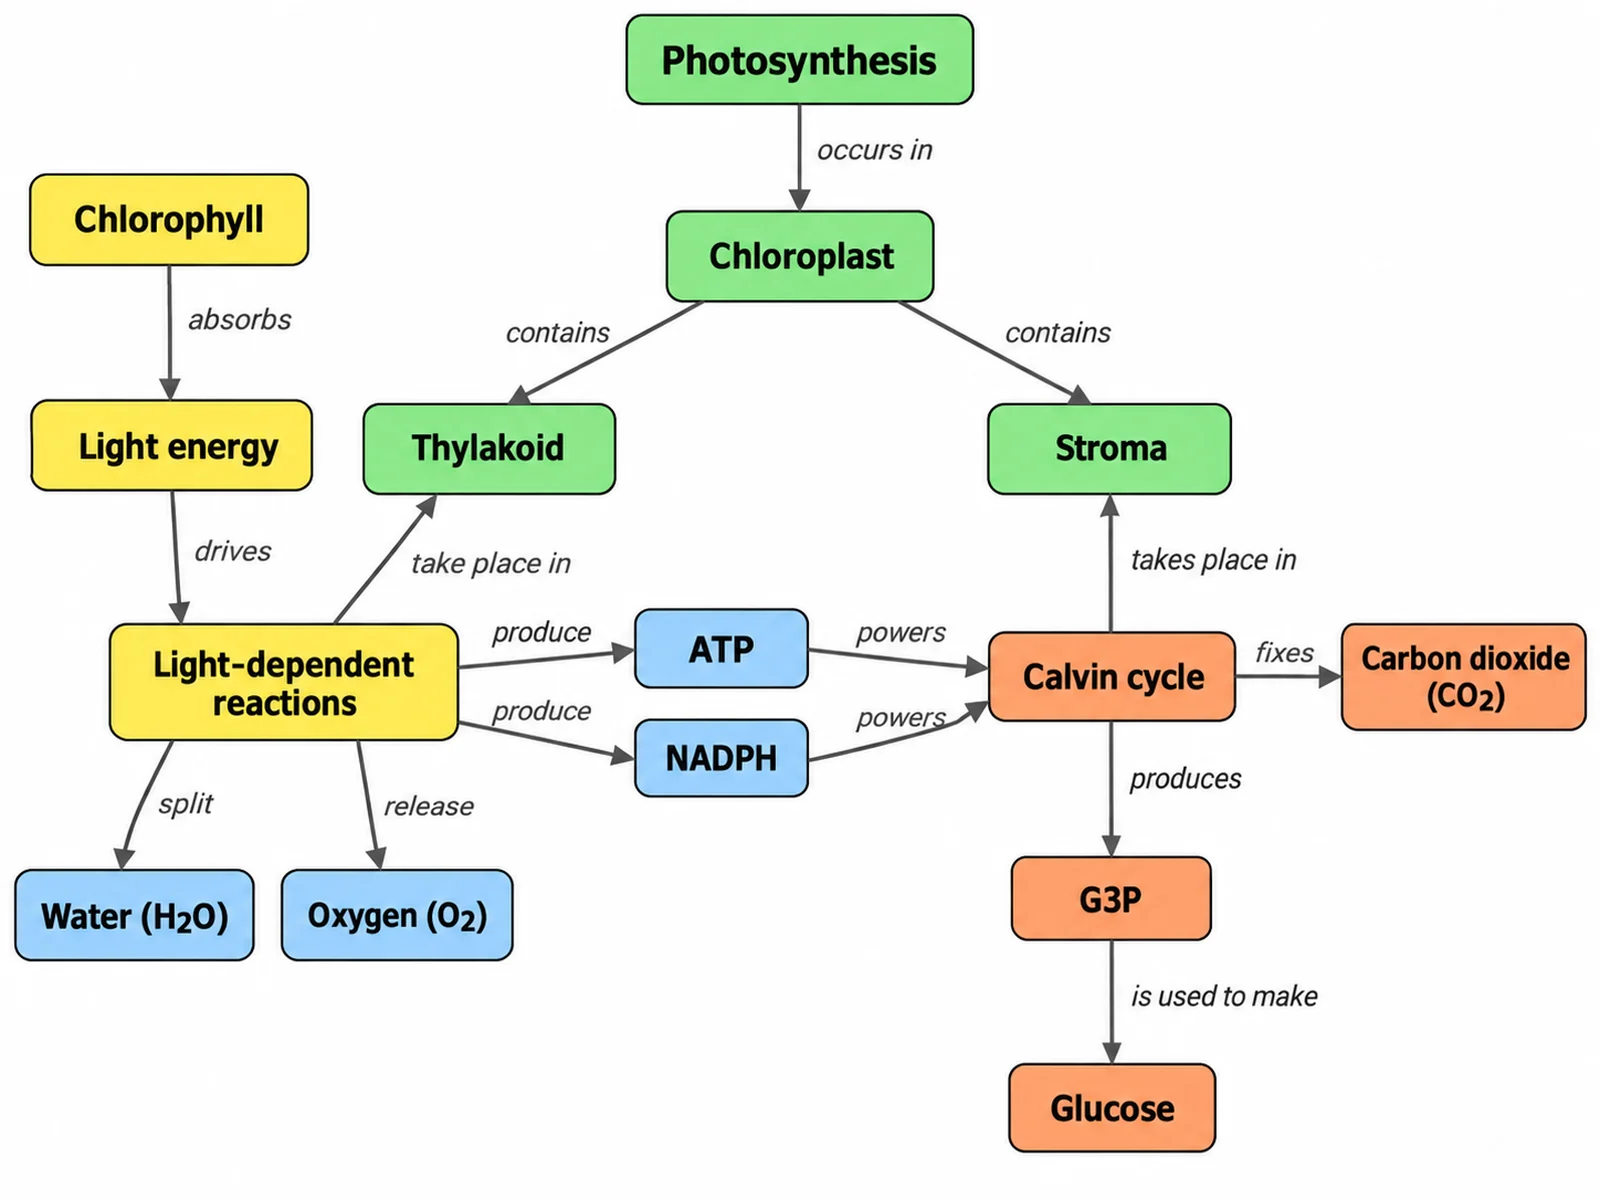
Concept Map Generator
Link ideas across branches with labelled arrows when a strict hierarchy is too narrow.
Mapping a process, not a hierarchy?
When steps loop back or paths merge, a flowchart fits better than a tree. The workflow diagram generator turns a description of the process into a clean, styled diagram.
Open the workflow diagram generatorLast checked: November 8, 2026. Sources: OpenStax, Introductory Statistics 2e, 3.5 Tree and Venn Diagrams; OpenStax, Contemporary Mathematics, 7.4 Tree Diagrams, Tables, and Outcomes; StatPearls: Diagnostic Testing Accuracy (NCBI Bookshelf); Gigerenzer & Hoffrage, How to Improve Bayesian Reasoning Without Instruction (1995); Magee, Decision Trees for Decision Making (Harvard Business Review, 1964); TreeAge Pro help: analysis of a decision tree (roll-back); Reingold & Tilford, Tidier Drawings of Trees (1981); NIST Dictionary of Algorithms and Data Structures: tree. The screening-test numbers are illustrative, not data for any real test.