1
Upload your assay data
Add CSV, TSV, TXT, or Excel data in long format: one row per well with concentration, response, and an optional compound column. Replicate rows are welcome.
2
Map columns and describe the figure
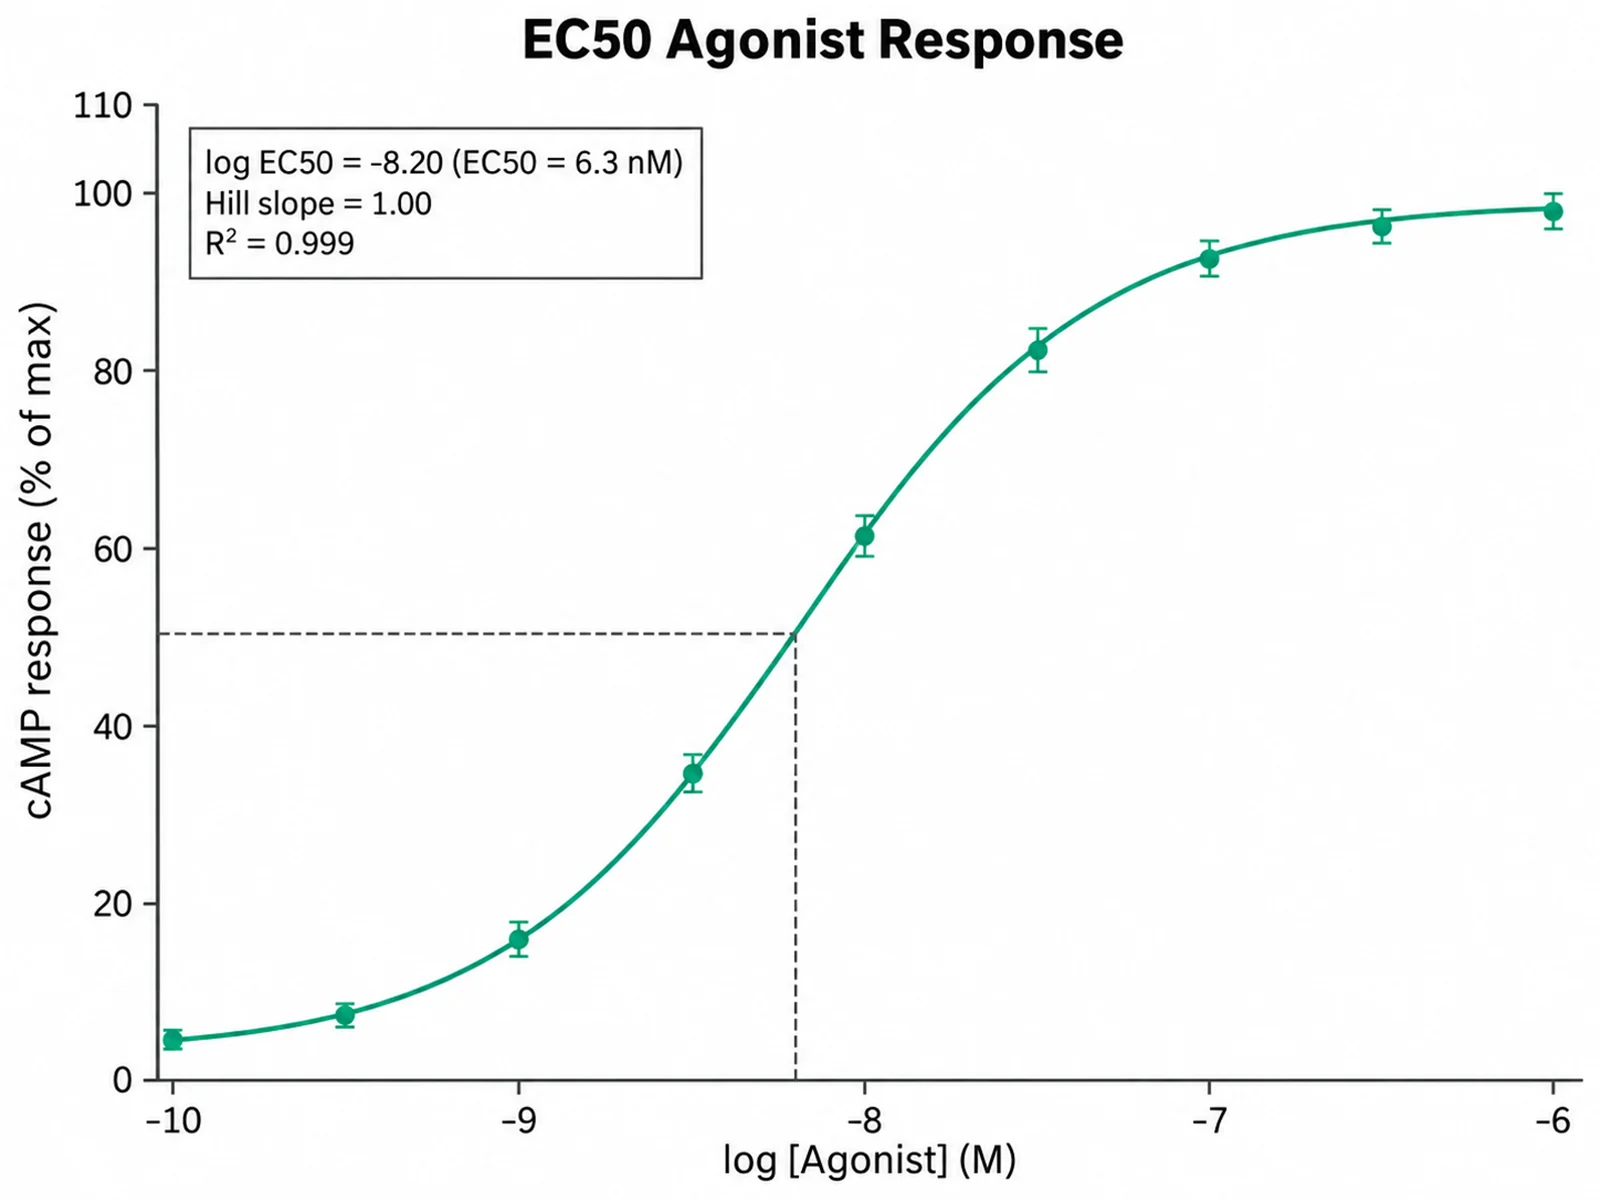
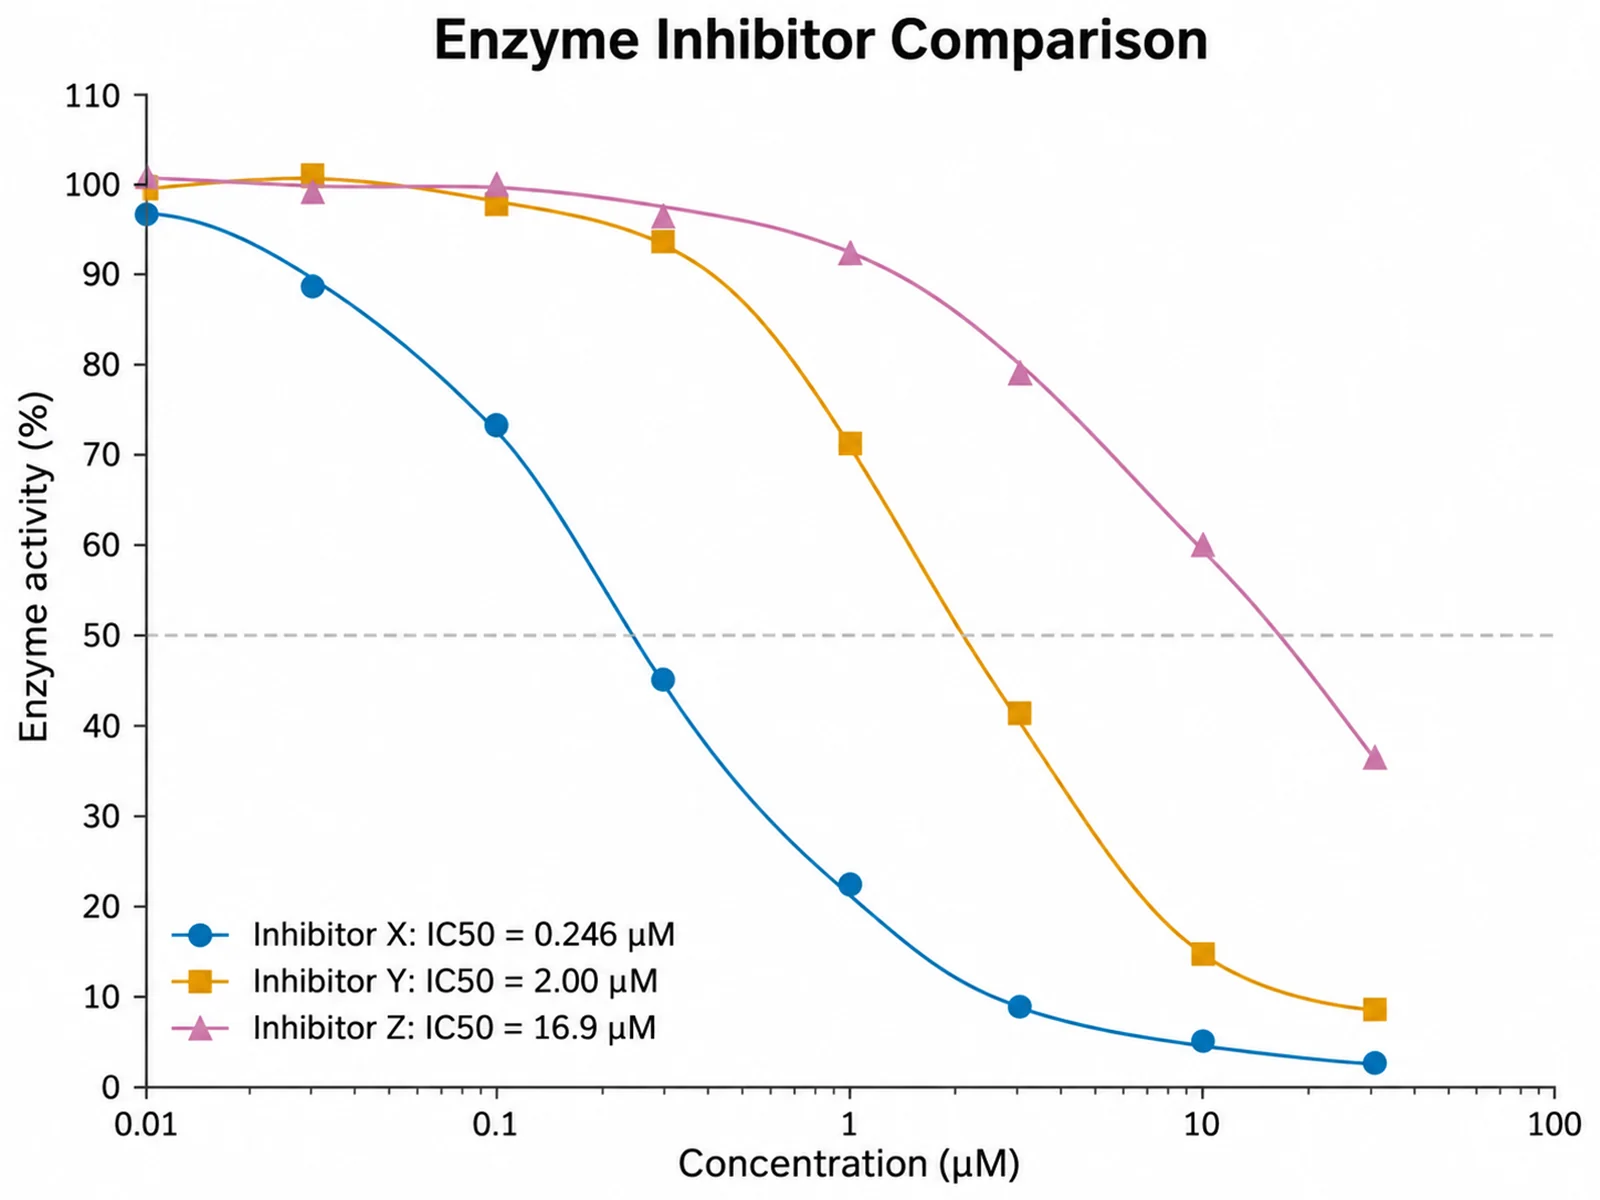
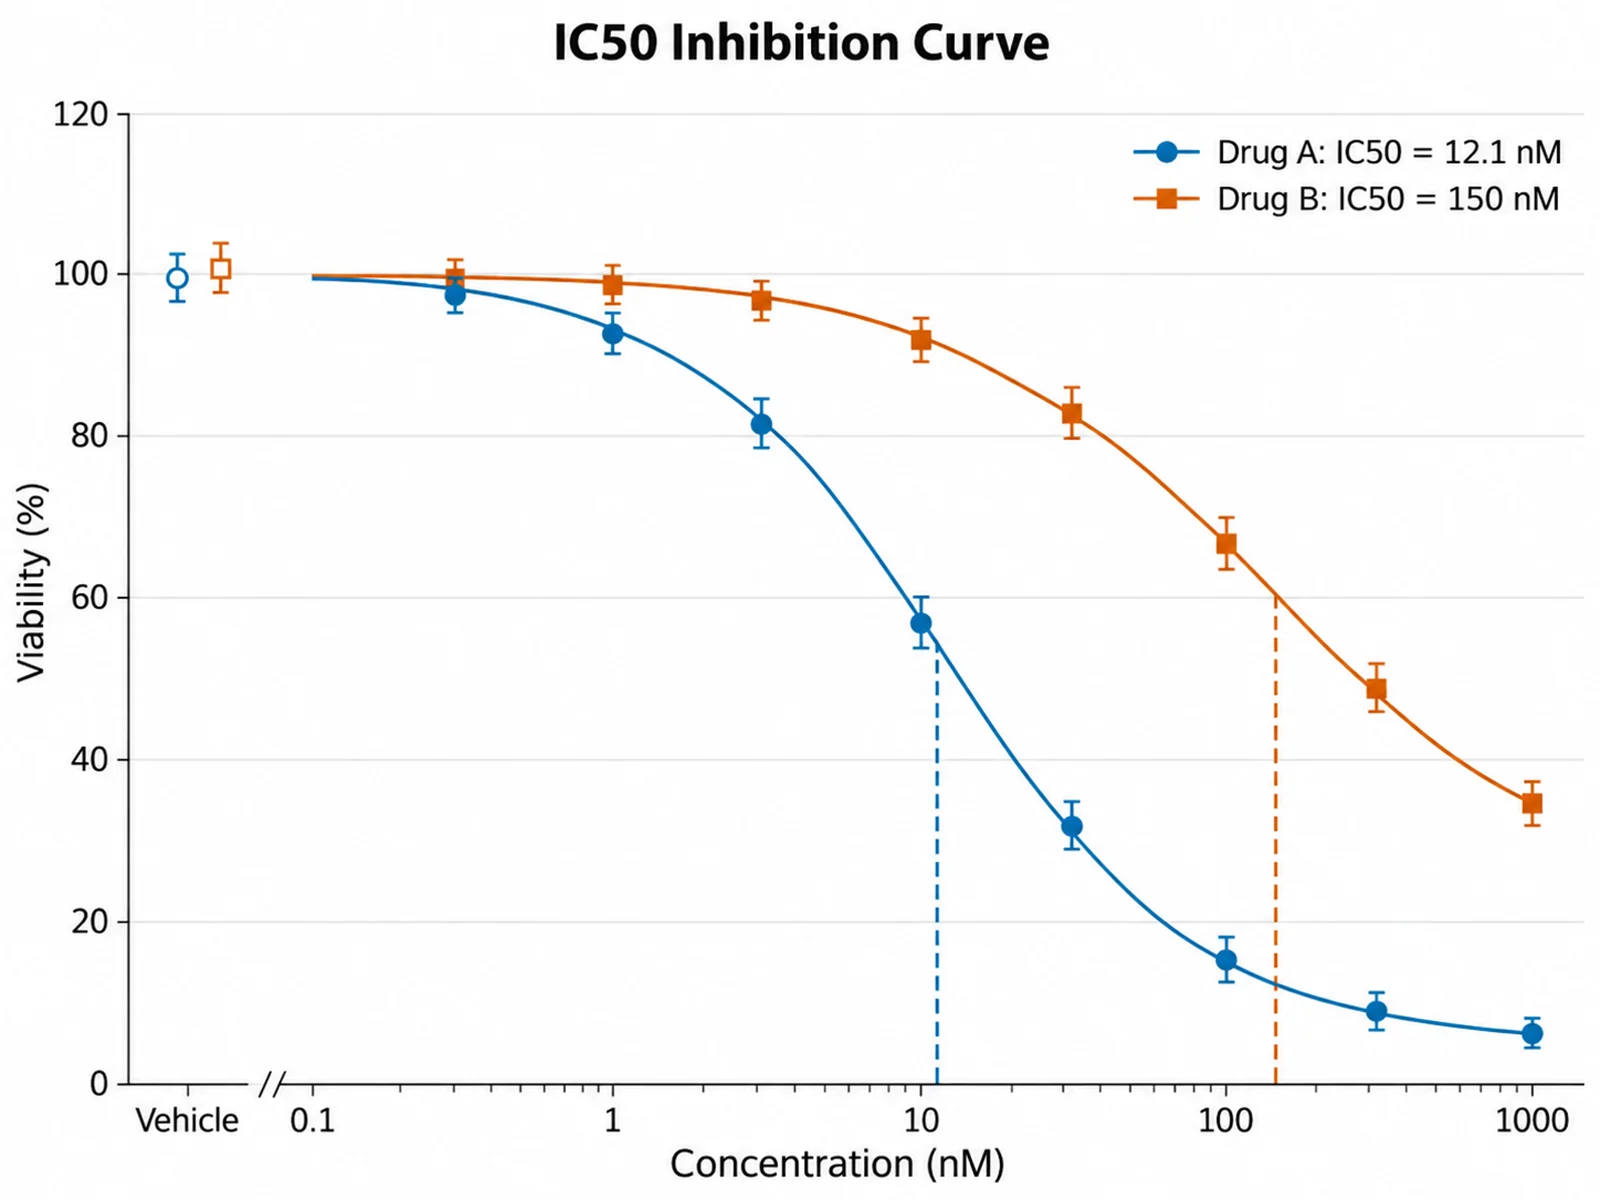
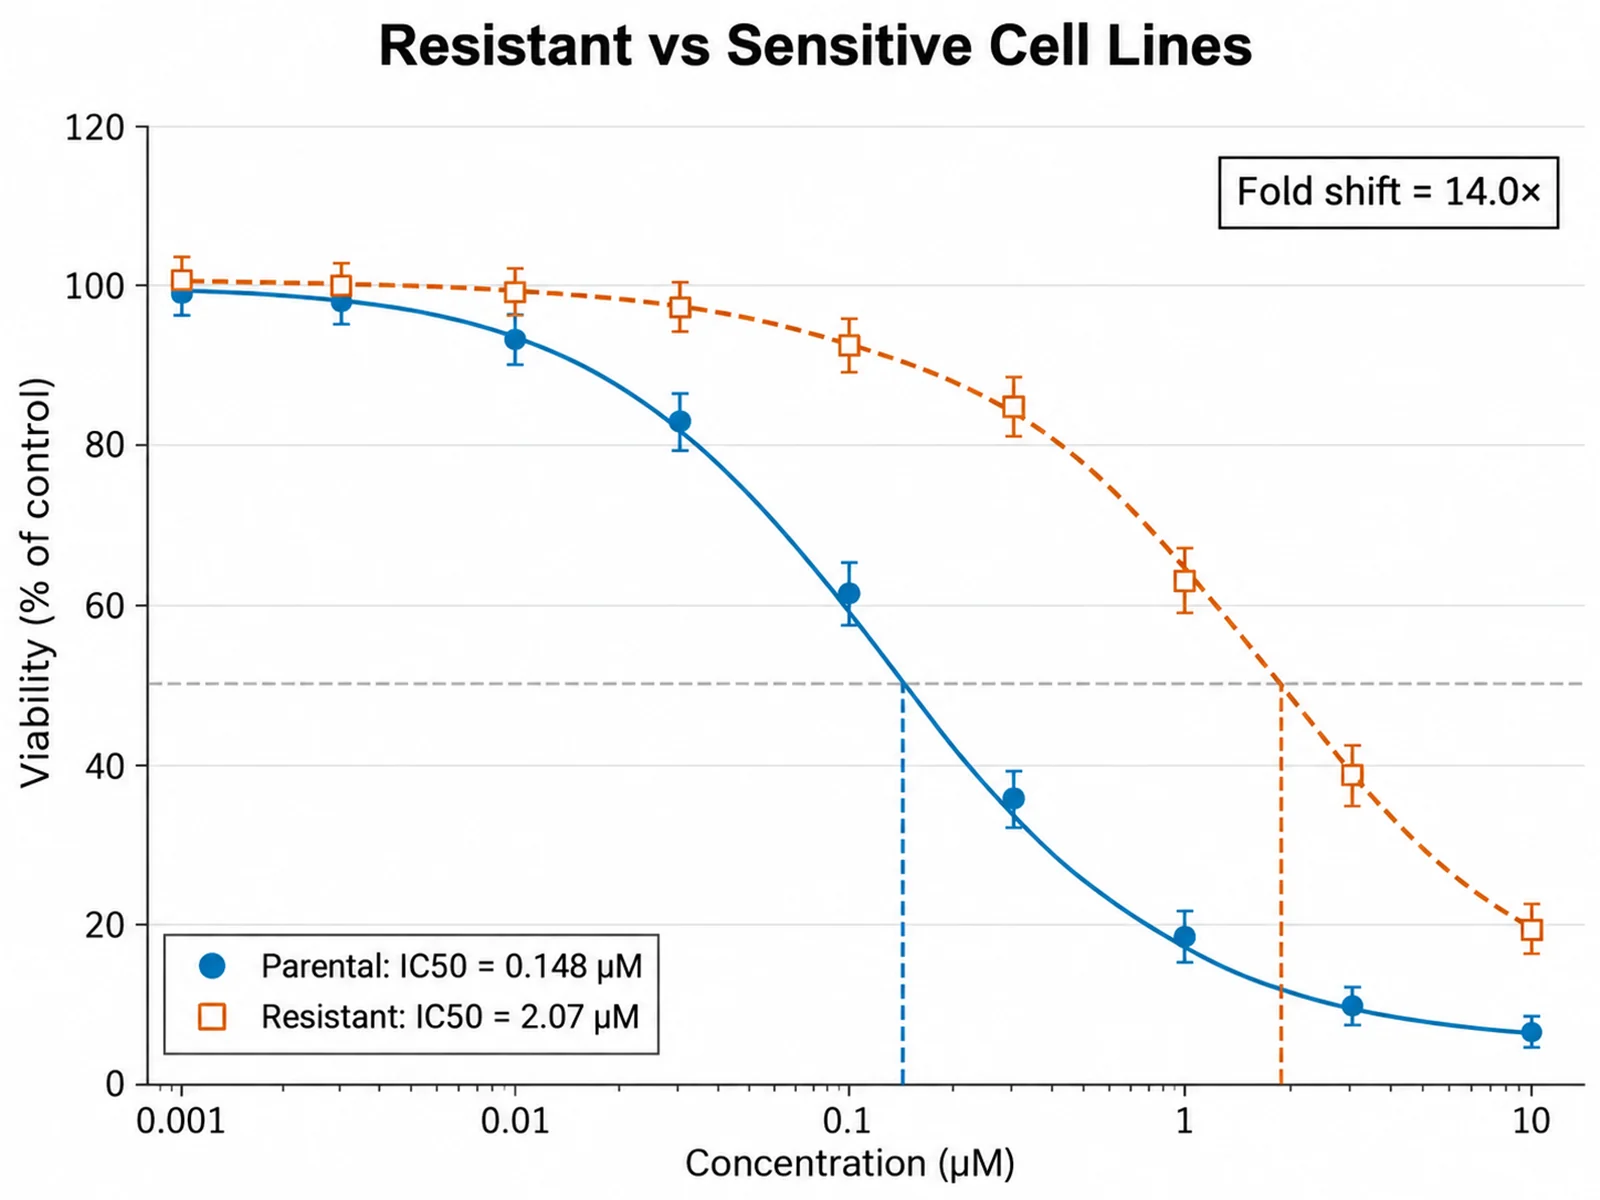
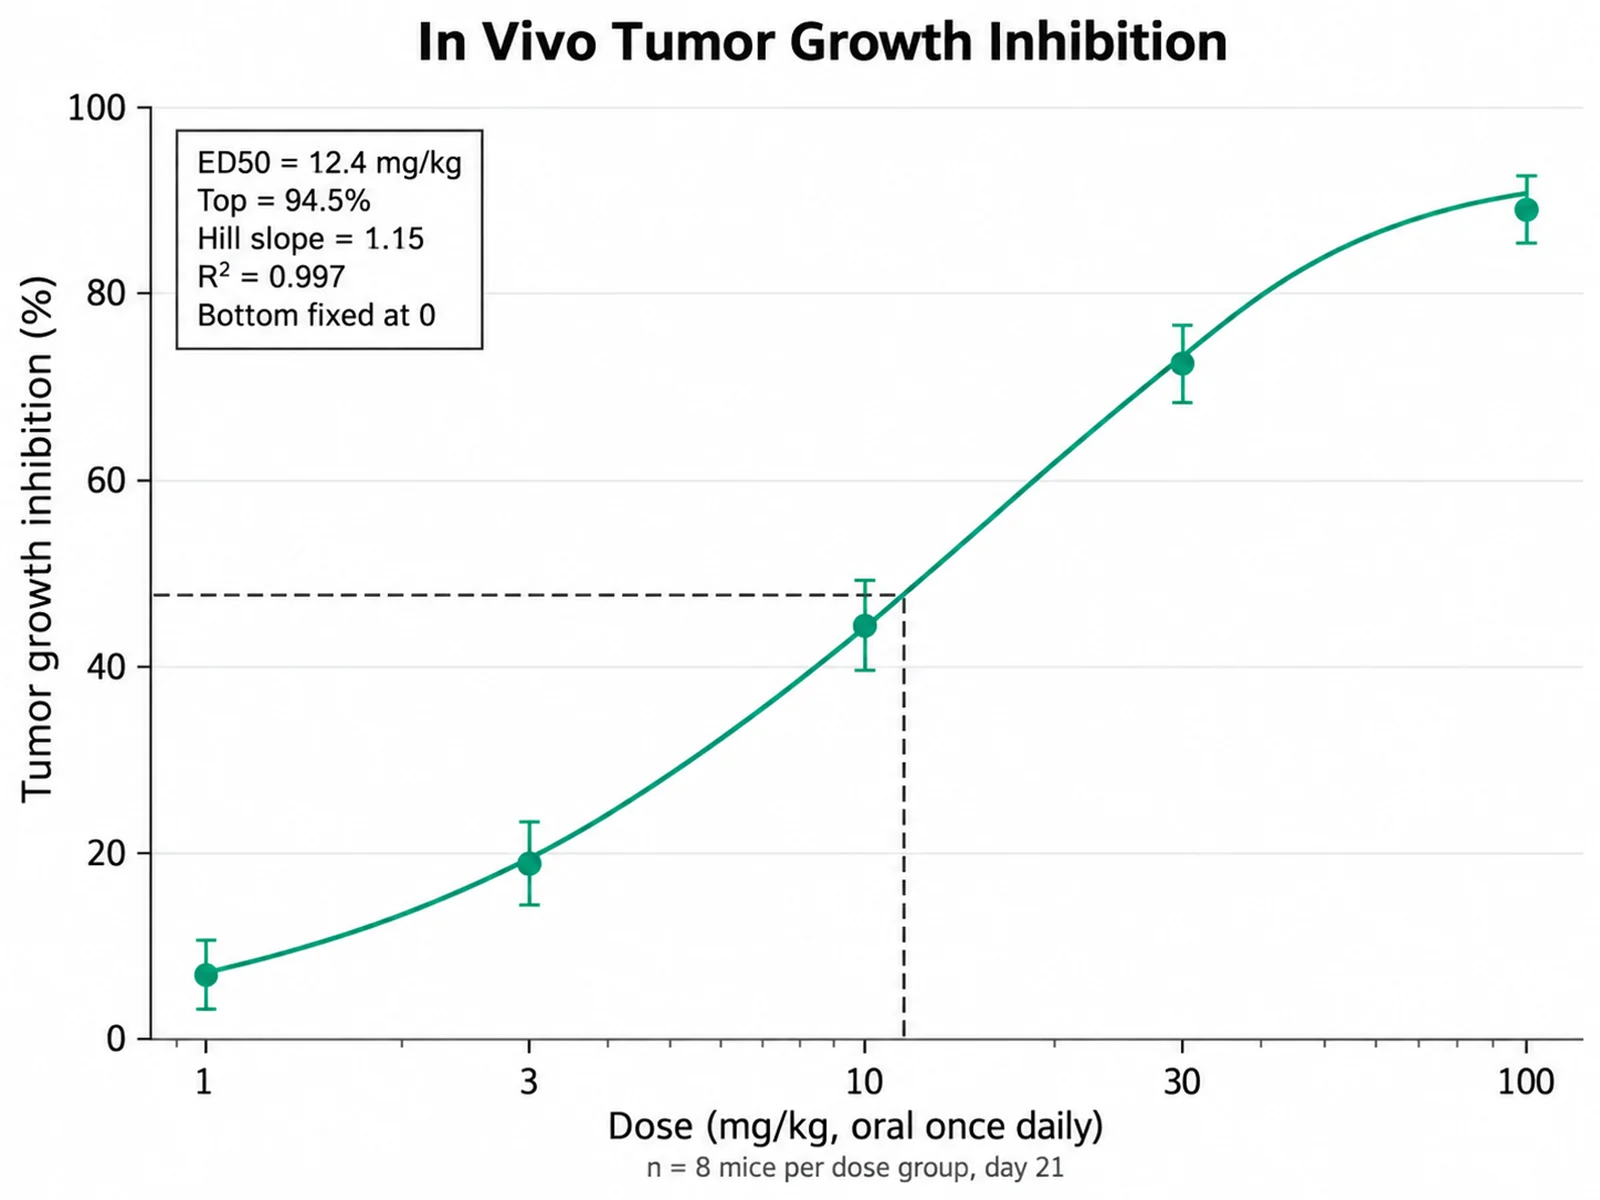
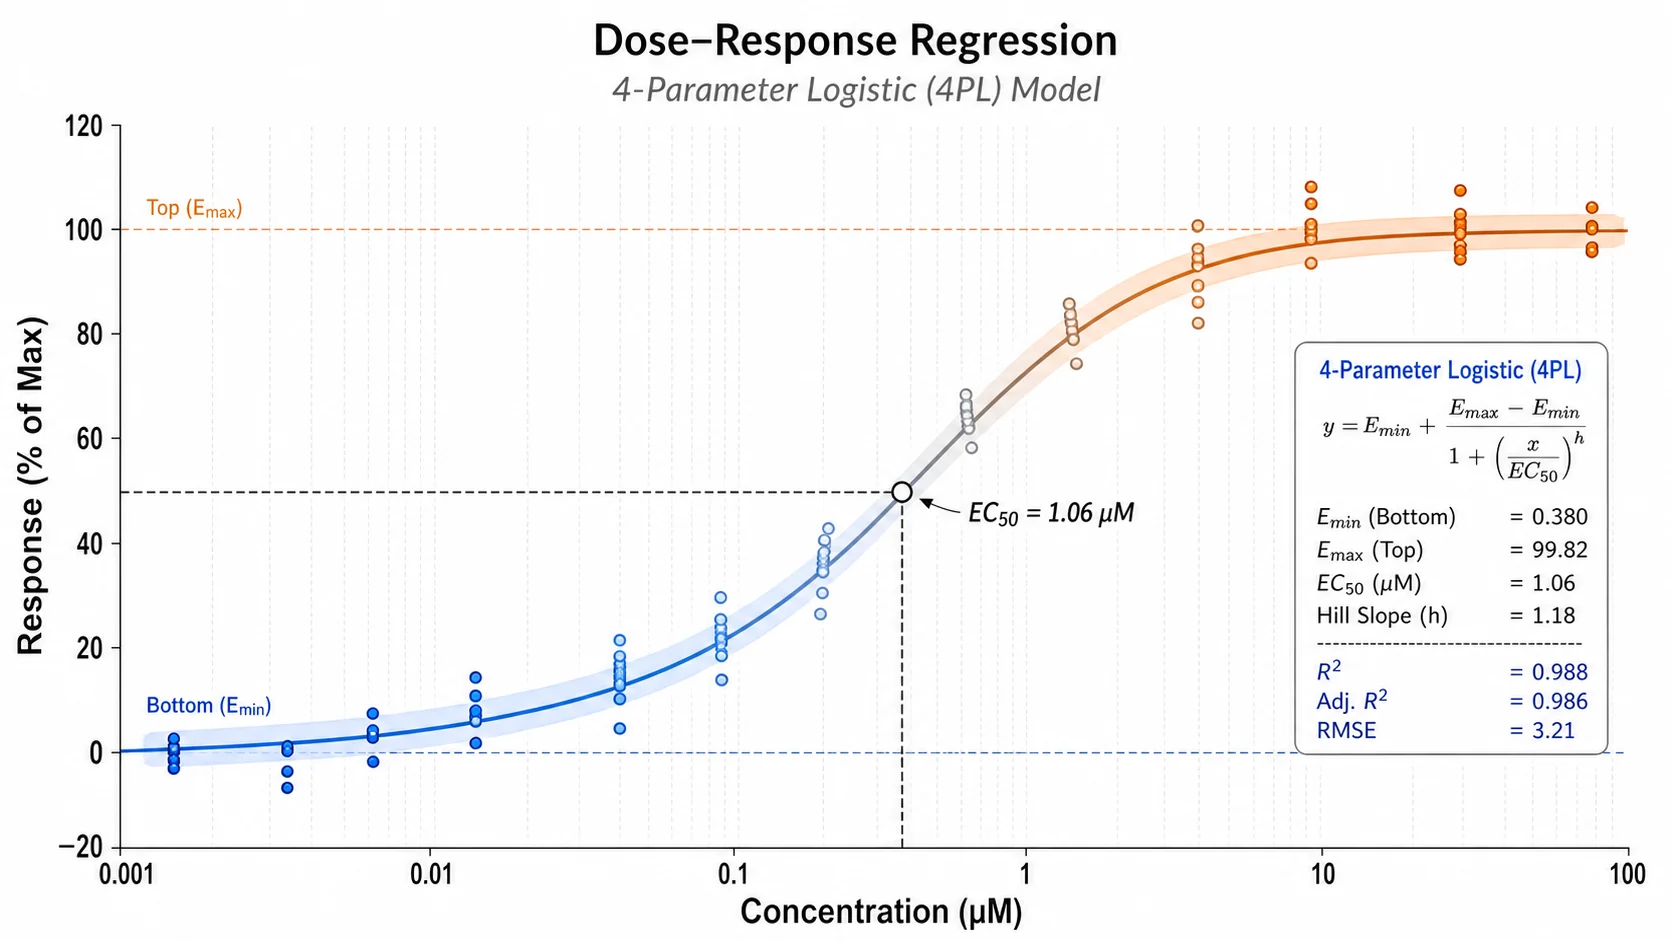
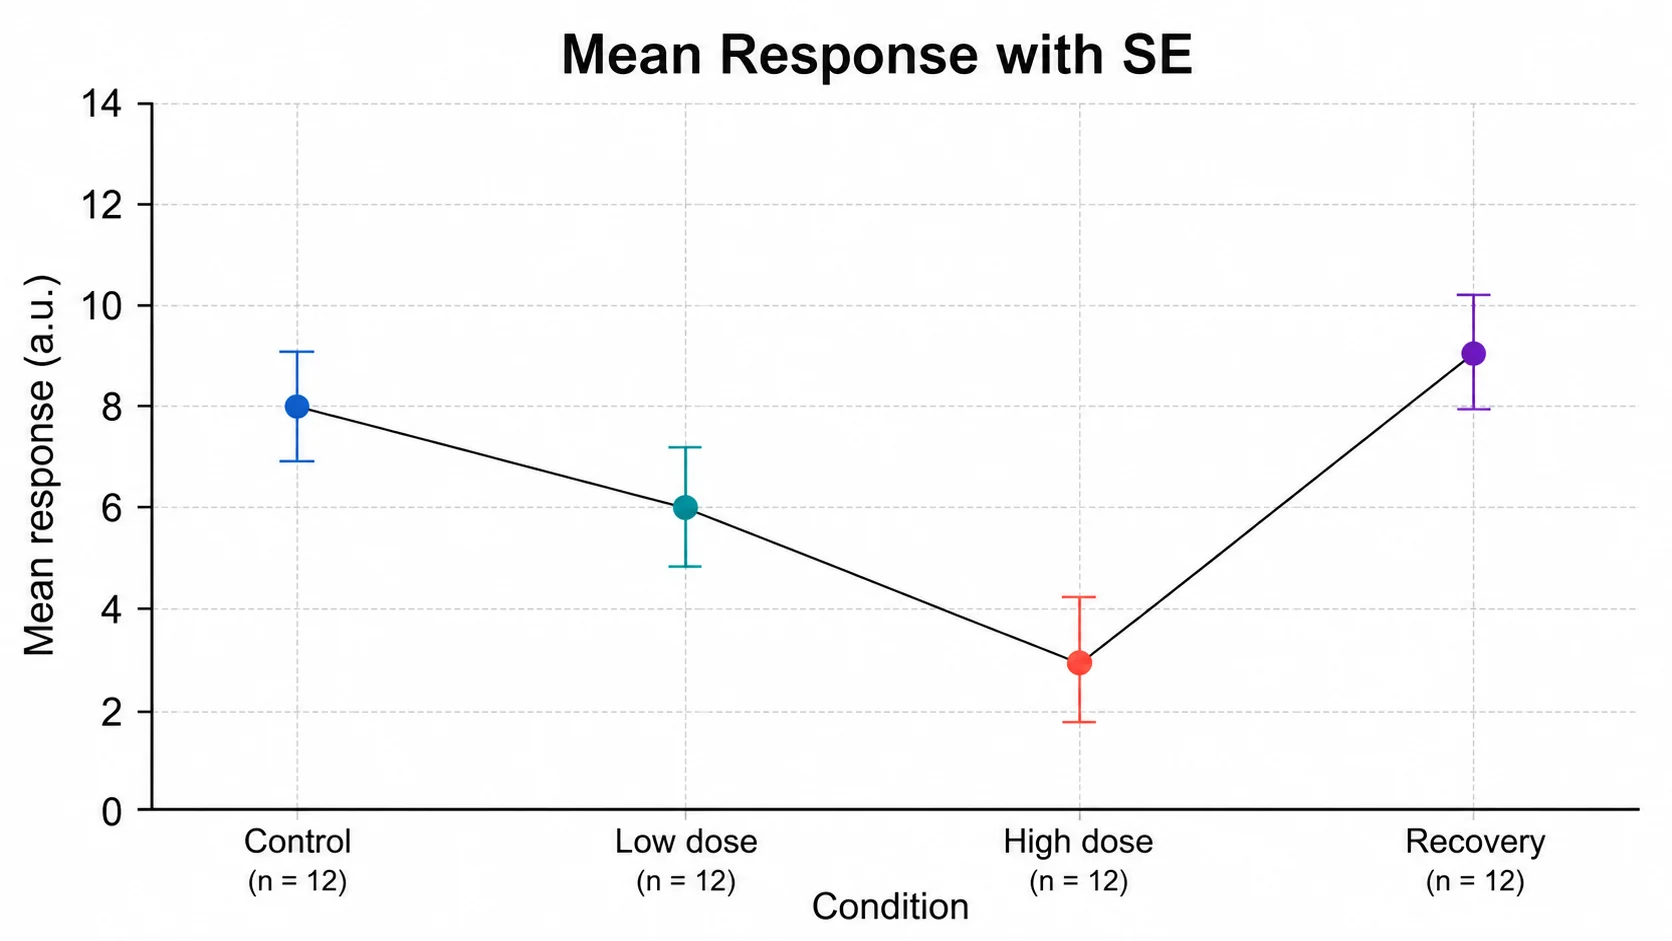
Confirm the concentration, response, and compound columns, then describe colors, error bars, IC50 or EC50 labels, and any plateau constraints.
3
Generate, review & download
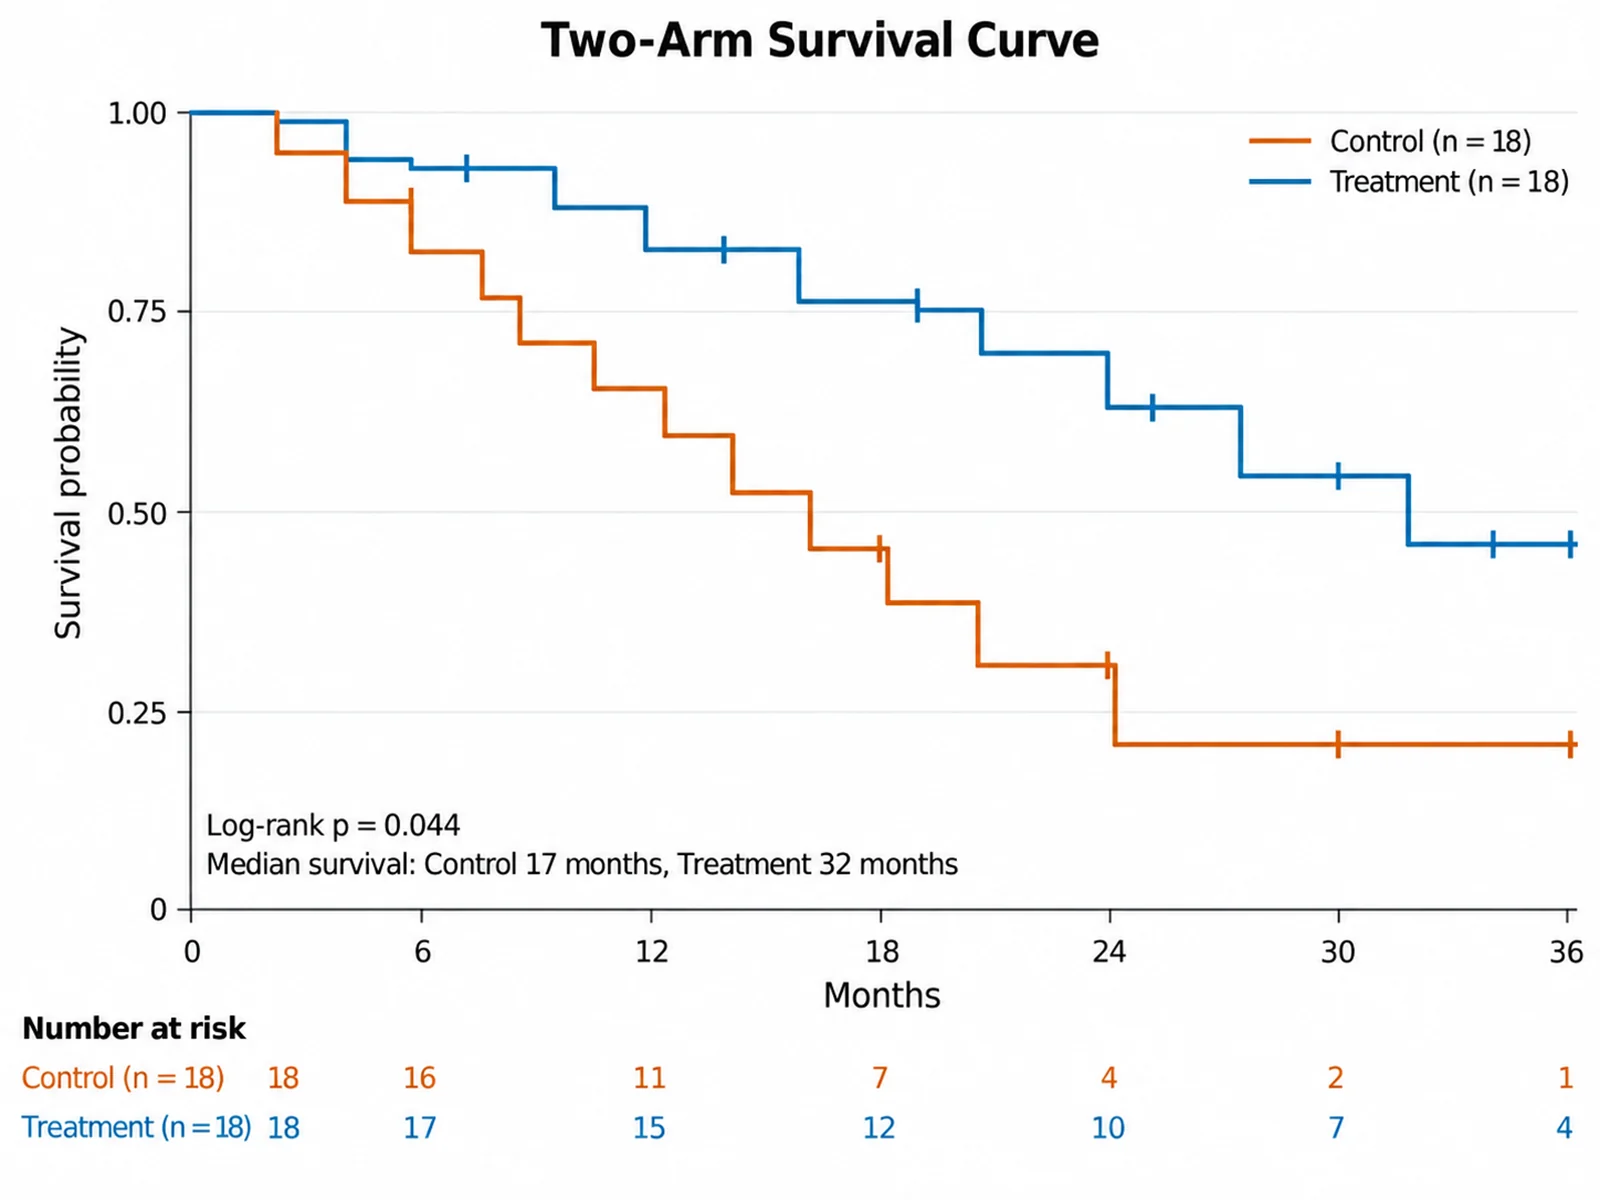
SciFigure fits every curve, draws the figure with the computed parameters, and lets you download a PNG for papers and slides.