
Free UML diagram maker
UML diagram generator: class diagrams from code or a click-through builder
Make a UML class diagram the way you prefer: type a few lines of plain-text code, or add classes, attributes, operations and relationships from a builder without learning any syntax. The diagram redraws as you go in standard UML 2.5.1 notation, with the right diamonds, triangles and dashed lines, and downloads as SVG, PNG or PDF. Sequence and state machine diagrams have their own generators, linked below.
Everything runs in your browser: nothing is uploaded, and the diagram is drawn exactly from your code. Undo with Ctrl+Z.
Step by step
How to make a UML class diagram in six steps
The same steps work whether you type the code or use the builder; the two always stay in sync.
- 1
Start from a template or a blank diagram
Pick one of the templates above the editor, such as the laboratory sample tracking model or the library loans model, or choose Start blank for an empty class.
- 2
Add your classes
In the Build tab, choose Add class, type the name and list attributes and operations one per line, such as −barcode : String or +split(n : int) List~Aliquot~. Pick Interface, Abstract class or Enumeration where it applies.
- 3
Connect them with relationships
Choose Add relationship, pick the two classes and the kind: association, aggregation, composition, generalization, realization or dependency. Add multiplicities such as 1 and 0..* and a short label.
- 4
Check the notation
Read every line of the diagram aloud: “one Sample is split into one or more Aliquots”. If a sentence sounds wrong, change the multiplicity or the relationship. The notation table below shows what each symbol means.
- 5
Tidy the layout and style
In the Style tab, switch between top-to-bottom and left-to-right layouts, choose the publication, grey, blue or dark style, and set the text size. Hide empty compartments for a lighter look.
- 6
Export or keep the code
Download an SVG for papers and posters, a PNG at 2× or 4× for slides, or a PDF from the print dialog. Copy the code too: it is plain text you can keep in a repository and paste back here later.
Templates
UML class diagram examples to start from
Each template is a complete, correct model. Open one in the editor and rename the classes, or use it as a reference for the notation.
Notation reference
UML class diagram symbols and their code
Every symbol a class diagram uses, as UML 2.5.1 draws it, with the line of code that produces it here. Add puts a working example into your diagram.
| Symbol | Element and meaning | Code in this tool |
|---|---|---|
Class Name, attributes and operations in three compartments. | class Sample {
-id : String
+split(n : int) int
} | |
Interface A set of operations other classes promise to provide, marked «interface». | class Trackable {
<<interface>>
} | |
Abstract class and operation Cannot be instantiated; shown in italics. Subclasses implement the abstract operations. | class Shape {
<<abstract>>
+area() double*
} | |
| + − # ~ | Visibility Public, private, protected and package, written before the member name. | +public -private #protected ~package |
| x̲ | Static member Belongs to the class, not to each object; drawn underlined. | +count : int$ |
Association with multiplicities Objects are linked; numbers say how many at each end. | A "1" -- "0..*" B : label | |
Directed association The open arrowhead shows navigability: A can reach B. | A --> B | |
Aggregation (shared) Hollow diamond at the whole; parts can be shared or outlive it. | Whole o-- Part | |
Composition Filled diamond at the whole; each part belongs to one whole and is deleted with it. | Whole *-- Part | |
Generalization (inheritance) Hollow triangle at the parent: the child is a kind of the parent. | Parent <|-- Child | |
Realization Dashed line, hollow triangle at the interface the class implements. | Interface <|.. Class | |
Dependency Dashed line, open arrowhead: the client uses the supplier. | Client ..> Supplier | |
Note A comment, attached to a class with a dashed line. | note for A "text" |
Common mistakes
Six class diagram mistakes and how to fix them
The diamond on the wrong end
WrongAliquot *-- Sample, putting the filled diamond at the part.
RightThe diamond sits at the whole: Sample *-- Aliquot. Read it as “a sample is made of aliquots”.
The inheritance arrow pointing at the child
WrongCircle <|-- Shape, which says Shape is a kind of Circle.
RightThe triangle points at the parent: Shape <|-- Circle.
Composition where the part can live on
WrongCourse *-- Student, although students exist without the course.
RightUse an association with multiplicities (Course "0..*" -- "0..*" Student) or aggregation; keep composition for parts that are deleted with their whole.
A solid line for an interface
WrongInterface <|-- Class, drawing realization as inheritance.
RightRealization is dashed: Interface <|.. Class.
Associations hidden in attributes and drawn again as lines
WrongAn attribute -instrument : Instrument plus a line from the class to Instrument.
RightShow the link once, normally as the line with a multiplicity; keep attributes for simple values such as numbers, text and dates.
Multiplicity on the wrong side
WrongWriting "1..*" next to Sample to say a sample has many aliquots.
RightThe number goes at the far end: Sample "1" *-- "1..*" Aliquot puts 1..* next to Aliquot.
All 14 UML diagrams
UML 2.5.1 diagram types, and where to draw them
UML 2.5.1 sorts its 14 diagrams into structure diagrams, which show the parts of a system, and behavior diagrams, which show what it does over time. Four of the behavior diagrams are interaction diagrams. The ones with a link have a generator on this site.
Structure diagrams (7): what the system is made of
Class diagram
Classes, their attributes and operations, and the relationships between them. Draw them in the editor at the top of this page.
Object diagram
A snapshot of objects and their links at one moment, with underlined instance names; useful to check a class model against real data.
Package diagram
How model elements are grouped into packages and how the packages depend on each other.
Component diagram
Replaceable parts of a system and the interfaces they provide and require.
Composite structure diagram
The internal parts of a class and the connectors between them at run time.
Deployment diagram
Hardware nodes, execution environments and the artifacts deployed on them.
Profile diagram
Extensions of UML itself: stereotypes and tagged values for a domain.
Behavior diagrams: what the system does
Use case diagram
Actors, the goals (use cases) they reach with the system, and the system boundary.
Open the use case diagram generatorActivity diagram
A flow of actions with decisions, merges, forks and swimlanes; the UML form of a flowchart.
Draw a workflow or flowchartState machine diagram
The states an object passes through and the events, guards and actions that move it between them.
Open the state diagram generatorInteraction diagrams (4): a kind of behavior diagram
Sequence diagram
Messages between participants in time order, down vertical lifelines, with fragments for alternatives and loops.
Open the sequence diagram generatorCommunication diagram
The same messages as a sequence diagram, numbered on the links between objects instead of in time order.
Interaction overview diagram
An activity-style flow whose nodes are whole interactions or references to them.
Timing diagram
How states or values of lifelines change along a time axis, with timing constraints.
Related diagrams that are not part of UML
Entity-relationship diagram
Tables, keys and cardinalities for database design; close to a class diagram without operations.
Open the ER diagram generatorData flow diagram
Processes, data stores and external entities, and the data that moves between them.
Open the data flow diagram generatorConcept map
Ideas linked by labelled arrows, for learning and planning rather than for software models.
Open the concept map generatorNeural network diagram
Layers and connections of a machine-learning model, drawn as an architecture figure.
Open the neural network diagram generator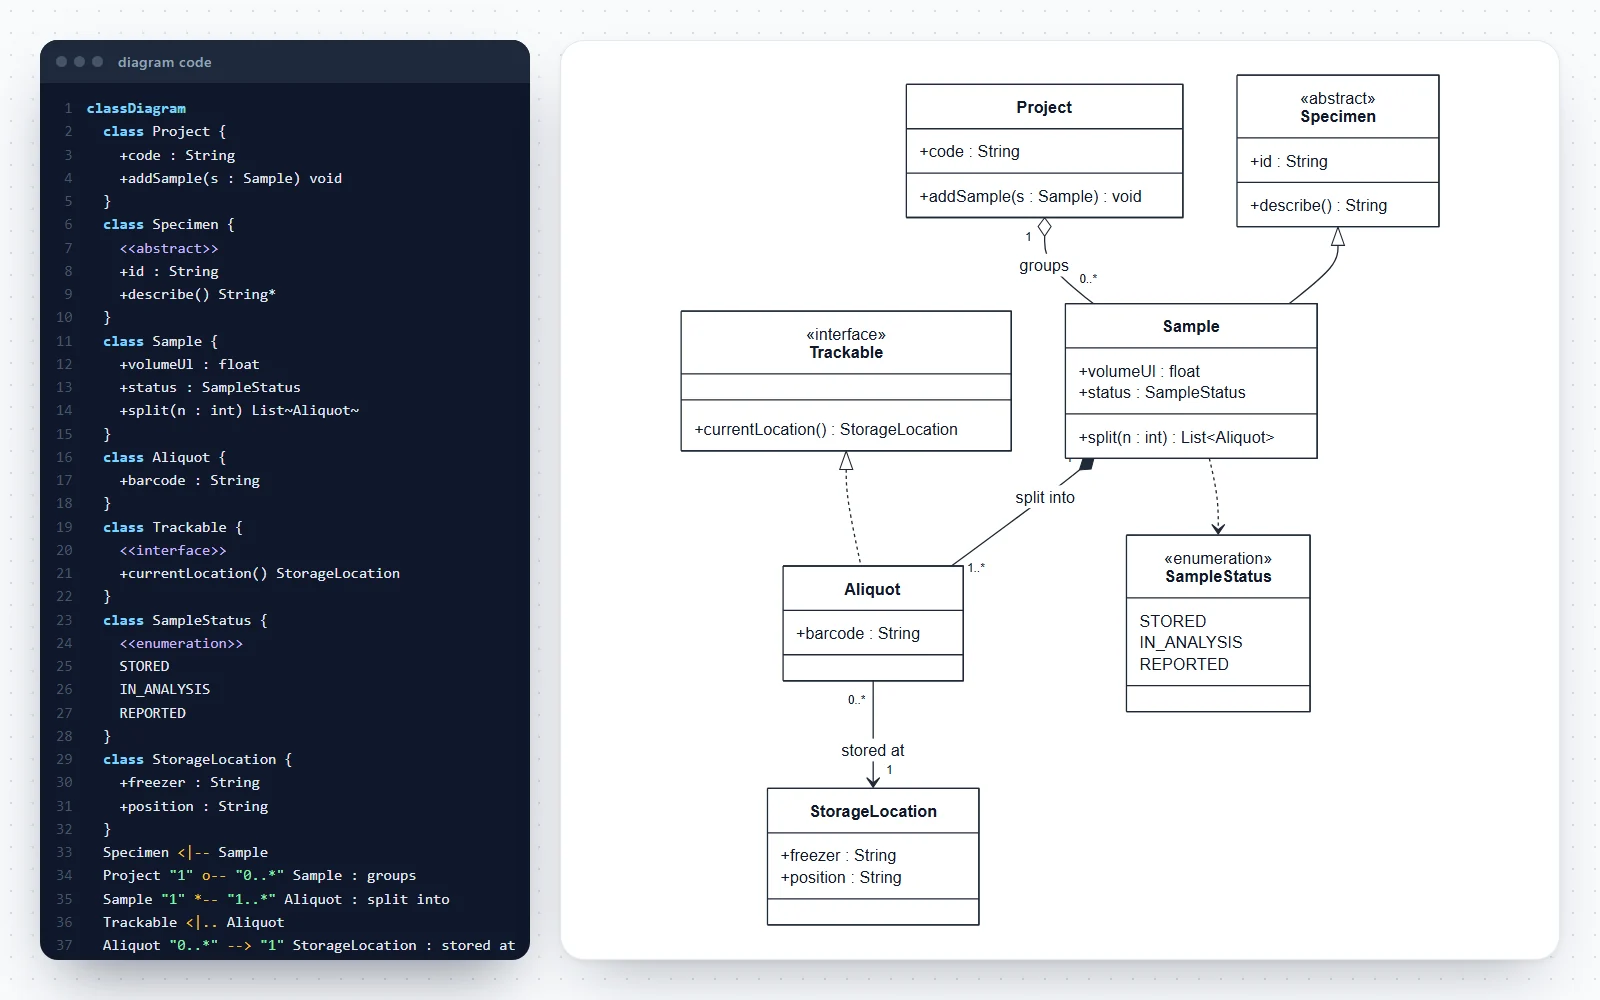
How this UML diagram creator works
The editor has three tabs beside the drawing. Whatever you do in one of them shows up in the diagram within a fraction of a second, and every change can be undone.
- Code: a plain-text description of the diagram, one class or relationship per line, with line numbers. If a line has a mistake, the line is marked in red, the error is explained in plain English, and the last diagram that worked stays on screen until you fix it.
- Build: short forms that write the code for you. Add a class, an attribute, an operation, a relationship, a note or a package; the form shows the exact lines it will add before you click.
- Style: four figure styles, text sizes from 12 to 18 px, the layout direction, and whether empty compartments are shown.
- Templates: seven ready-made models, from a laboratory information system to the observer design pattern, each a working example of the notation.
- Your diagram is saved in this browser as you work, so it is still there when you come back. Nothing is uploaded and there is no account.
What is UML?
The Unified Modeling Language (UML) is a standard graphical language for describing software and other systems: what they are made of, how they behave and how their parts talk to each other. It is maintained by the Object Management Group (OMG); the current version, UML 2.5.1, was published in December 2017, and UML 2.4.1 was also issued as the international standard ISO/IEC 19505.
- UML 2.5.1 defines 14 kinds of diagram. Seven are structure diagrams, such as the class diagram; seven are behavior diagrams, four of which are interaction diagrams such as the sequence diagram.
- A diagram is a view of a model. The same class can appear in several diagrams, each showing only the details that matter for one purpose.
- UML is not tied to one programming language. A class diagram can describe Java or Python classes, database tables, a laboratory’s data model or the concepts of a business.
- The notation is strict where it matters: a hollow and a filled diamond mean different things, and so do a solid and a dashed line. That is why a UML diagram generator that draws the symbols for you avoids most mistakes.
UML class diagram notation, compartment by compartment
A class is drawn as a rectangle with up to three compartments: the name at the top, the attributes in the middle and the operations at the bottom. Empty compartments may be left out.
- Name: centred and bold. An abstract class has its name in italics (or the property {abstract}); keywords such as «interface» and «enumeration» go above the name.
- Attribute, in the form UML 2.5.1 gives: visibility name : Type [multiplicity] = default, for example −volumeUl : float = 0.0 or +tags : String [0..*]. A slash before the name, as in /age : int, marks a derived attribute.
- Operation: visibility name(parameter : Type, …) : ReturnType, for example +split(n : int) : List<Aliquot>. Parameters can be marked in, out or inout.
- Static members (class-level rather than per object) are underlined. Abstract operations, which subclasses must implement, are in italics.
- In this tool, write the return type after the closing bracket (+split(n : int) List~Aliquot~) and it is drawn with the colon; ~T~ stands for a generic type such as List<T>; end a member with $ for static or * for abstract.
- An enumeration lists its literal values in the attribute compartment, such as REGISTERED, STORED and DISPOSED for a sample status.
Visibility: + public, − private, # protected, ~ package
The symbol in front of a member says who may use it. UML defines four visibilities.
- + public: any other element can use it.
- − private: only the class itself.
- # protected: the class and its subclasses (specializations).
- ~ package: any element in the same package.
- Visibility is optional. Leave it off in an early analysis model, and add it when the diagram documents real code.
The six class relationships and how to tell them apart
Most errors in class diagrams are the wrong line or the wrong end. These are the relationships UML 2.5.1 defines between classes, with the symbol and the sentence each one stands for.
- Association (solid line): objects of one class are linked to objects of the other, as Member makes Loan. An open arrowhead shows navigability: Loan → Copy means a loan knows its copy.
- Aggregation (hollow diamond at the whole): a whole–part link where parts can be shared or outlive the whole, as a project groups samples. UML leaves its exact meaning to the modeller, so use it sparingly.
- Composition (filled diamond at the whole): a part belongs to at most one whole at a time and is deleted with it, as a sample is split into aliquots or an order contains order lines.
- Generalization (solid line, hollow triangle at the parent): “is a kind of”. Circle and Rectangle are kinds of Shape and inherit its attributes and operations.
- Realization (dashed line, hollow triangle at the interface): the class implements the interface’s operations, as PlateReaderDriver realizes InstrumentDriver.
- Dependency (dashed line, open arrowhead): one class uses another without keeping a link to it, for example as a parameter or a return type. Keywords such as «use» or «create» can say how.
Multiplicity: reading 1, 0..1, * and 1..*
A multiplicity at an association end says how many objects at that end are linked to one object at the other end. It is written lower..upper, with * for “no upper limit”.
- 1: exactly one. 0..1: zero or one (optional). * or 0..*: any number, including none. 1..*: at least one. 2..4: between two and four.
- Read it from the far end: Sample "1" *-- "1..*" Aliquot says each sample has one or more aliquots, and each aliquot belongs to exactly one sample.
- Composition implies the whole end is 1 (or 0..1): a part cannot belong to two wholes at once.
- Generalization and realization never carry multiplicities: they relate classes, not objects.
- Attributes have multiplicities too, written in brackets after the type: +authors : String [1..*].
Class diagrams for laboratory and research software
Class diagrams are not only for programmers. In research groups and core facilities they are a quick way to agree on what data exist and how they relate before anyone builds a database or a spreadsheet template.
- Sample tracking: projects, samples, aliquots, storage locations and measurements, as in the LIMS template. The composition from sample to aliquot is where most traceability rules live.
- Instrument control: an interface for drivers and one class per instrument, so new hardware can be added without changing the acquisition code (the instrument-drivers template).
- Clinical and field studies: study, site, participant, visit and observation, the backbone of most trial and cohort databases.
- Data pipelines: raw files, processed datasets, parameters and provenance records; dependencies show which step uses which input.
- For tables, keys and foreign keys rather than classes and operations, an entity-relationship diagram is the better fit.
From UML code to diagram: the text format behind the editor
The code in the editor is the Mermaid diagram syntax, an open text format for diagrams. Keeping the diagram as text has practical advantages over drawing boxes by hand.
- The same code renders in GitHub and GitLab Markdown, in many wikis and note-taking apps, and in documentation generators, so a diagram in a README stays in sync with this one.
- Text diffs cleanly in version control: a reviewer sees “added Aliquot.barcode” instead of a changed image.
- Paste code from anywhere into the editor to draw it, check it or export it as a figure. Mistakes are reported with their line number.
- More, then Download code saves a .mmd file; Copy as Markdown block wraps it in a ```mermaid fence ready for a README.
- If an AI assistant wrote the code for you, paste it here: the drawing follows the code exactly, so you can see and fix anything it got wrong.
An exact UML generator, not an AI guess
This tool draws precisely what the code says: the same code always gives the same diagram, and every symbol follows the standard. Nothing is invented, so it suits documentation, coursework and figures that must be right.
- Free, unlimited and private: it runs in your browser and uses no credits.
- If you want to describe a system in words first, an AI chat can draft the code; paste it into the editor to render it, then correct the relationships with the builder.
- For illustrative figures rather than formal models, such as a schematic of an experiment or a pipeline, the AI-based scientific diagram maker on this site is the better tool.
Using UML diagrams in papers, theses and slides
A model that is correct still needs to read well on a page. A few habits help.
- Show one idea per diagram. Split a large model into packages or several diagrams rather than shrinking the text.
- Leave out private details in a paper: the reader needs the classes and relationships, not every getter.
- Use the Publication style for print: black lines on white, Arial or Helvetica text, as most journals ask. SVG and PDF keep the text as real, selectable text.
- For slides, the Blue accent or Dark style and a 16 or 18 px text size read better from the back of a room.
- Cite the notation (UML 2.5.1) in a methods section or a figure legend when the diagram documents software you release.
Frequently asked questions
Is this UML diagram generator free?
Yes. There is no sign-up, no watermark and no limit on diagrams or exports. It runs entirely in your browser, nothing you type is uploaded, and your last diagram is kept on your own device for when you come back.
How do I make a UML class diagram online?
Load a template or start blank, then either type the code (one class or relationship per line) or use the Build tab: Add class, Add attribute, Add operation and Add relationship write the code for you. The diagram updates as you work. When it is right, download it as SVG, PNG or PDF.
Do I need to know any code?
No. The Build tab covers everything a class diagram needs through short forms, and each form shows the code it will add, so you learn the syntax along the way if you want to. You can also start from a template and only change the names.
Which UML version does the tool follow?
The symbols follow UML 2.5.1, the current OMG specification: hollow and filled diamonds for aggregation and composition, a hollow triangle for generalization, dashed lines for realization and dependency, + − # ~ for visibility, underlined static members and italic abstract ones.
What is the difference between aggregation and composition?
Both are whole–part relationships with the diamond at the whole. In composition (filled diamond) each part belongs to at most one whole at a time and is deleted with it, like order lines in an order. In aggregation (hollow diamond) parts can be shared or outlive the whole, like samples grouped into a project. If in doubt, a plain association with multiplicities is always correct.
How do I show inheritance and interfaces?
Inheritance (generalization) is a solid line with a hollow triangle at the parent: write Parent <|-- Child. An interface is a class marked <<interface>>, and a class that implements it is joined by a dashed line with a hollow triangle: Interface <|.. Class.
How do I add multiplicity like 1..* or 0..1?
Put each multiplicity in quotes next to its class in the relationship line, for example Sample "1" *-- "1..*" Aliquot. In the builder, fill in the two multiplicity fields of Add relationship. The number next to a class says how many of that class are linked to one object at the other end.
Can I draw other UML diagrams here?
This page is built around class diagrams. Sequence diagrams and state machine diagrams have their own generators with their own builders and templates, and so do use case, ER and data flow diagrams. If you paste code for another diagram type here, it still renders, with a link to the page made for it.
Can I paste code from GitHub or an AI assistant?
Yes. The editor reads the Mermaid diagram syntax used in GitHub and GitLab Markdown, so code from a README, a wiki or an AI chat can be pasted straight in. If a line has an error, it is marked with its line number and a plain-English explanation.
Is this an AI UML diagram generator?
No, and that is deliberate: the diagram is drawn exactly from the code, so the same input always gives the same, standard-conforming diagram and nothing is invented. You can still use an AI chat to draft the code from a description and paste it here to render and correct it.
Which export format should I use for a paper or a thesis?
SVG or PDF. Both are vector formats that stay sharp at any size and keep the text as real text, so they can be edited in Illustrator, Inkscape or PowerPoint. Use PNG at 2× or 4× for slides, documents and web pages.
Why is my diagram not updating?
The code has an error. The status at the top of the editor says which line, the line is marked red, and the message explains what is missing, such as an unclosed { or a relationship with an unknown arrow. The last diagram that worked stays visible until the code is fixed.
How do I change the layout or make the diagram wider?
In the Style tab, choose top to bottom, left to right, bottom to top or right to left; this adds a direction line to the code. Grouping classes into packages, or splitting a large model into two diagrams, also helps more than shrinking the text.
Is my diagram saved?
Yes, automatically in this browser, and restored when you return. To move it to another device or keep versions, download the code as a .mmd file or copy it; pasting it back into the editor restores the diagram exactly.
What can this tool not draw?
A few rarer parts of the class notation have no symbol in the renderer: association classes, qualified associations and n-ary associations (the large diamond). Model them with an extra class and ordinary associations, and add a note to explain the choice.
Related diagram tools
Sequence Diagram Generator
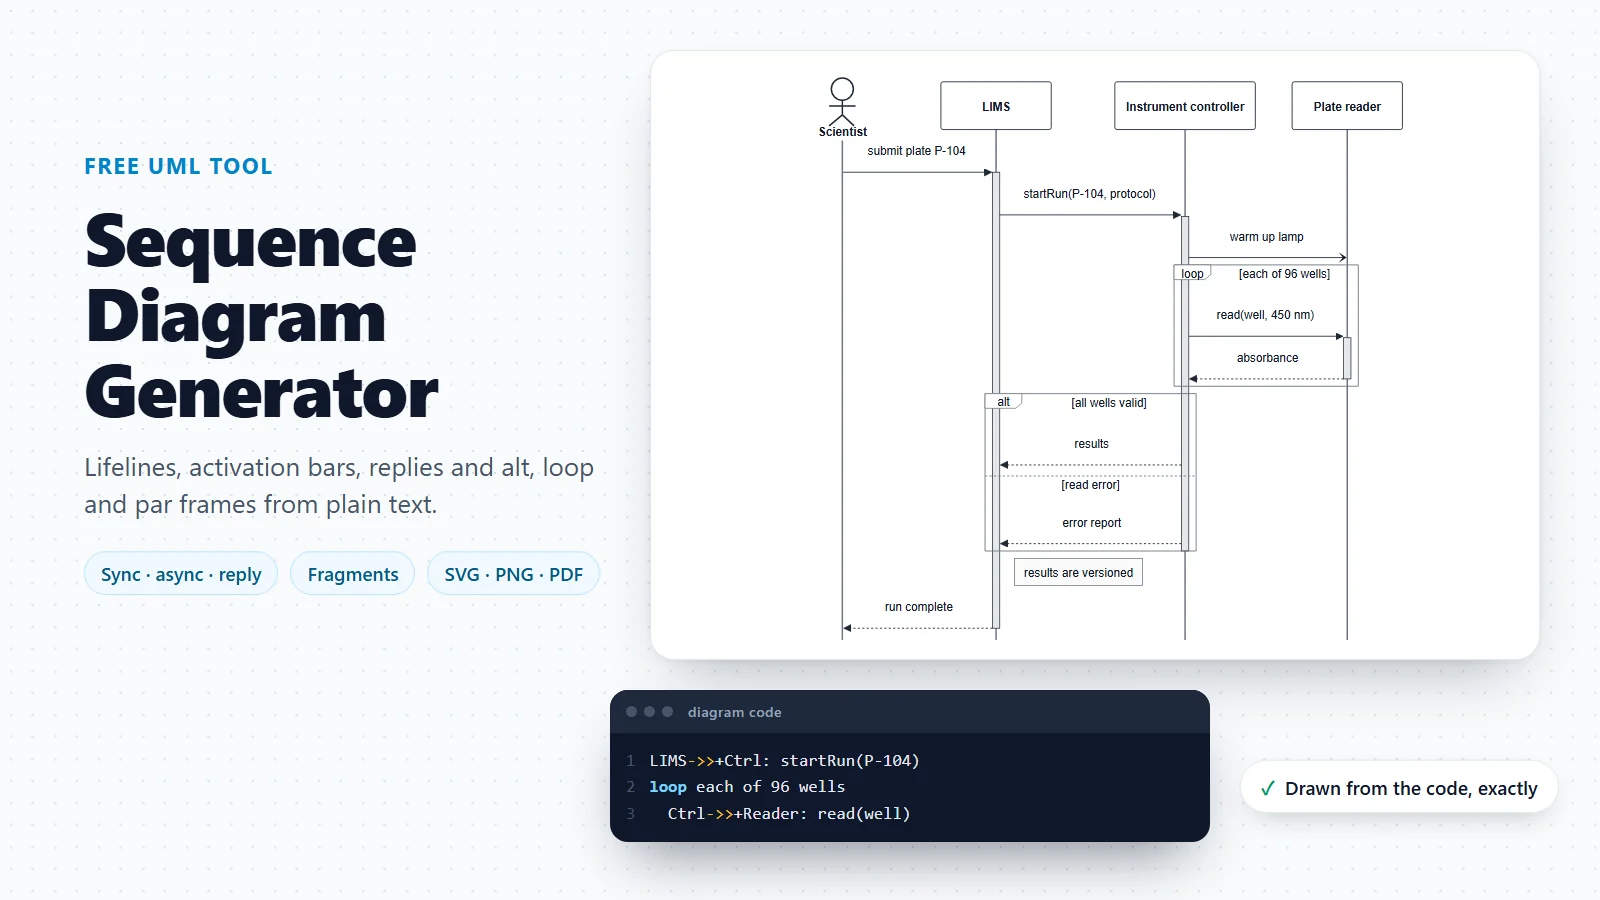
Lifelines, synchronous and asynchronous messages, activation bars and alt, opt, loop and par fragments.
State Diagram Generator
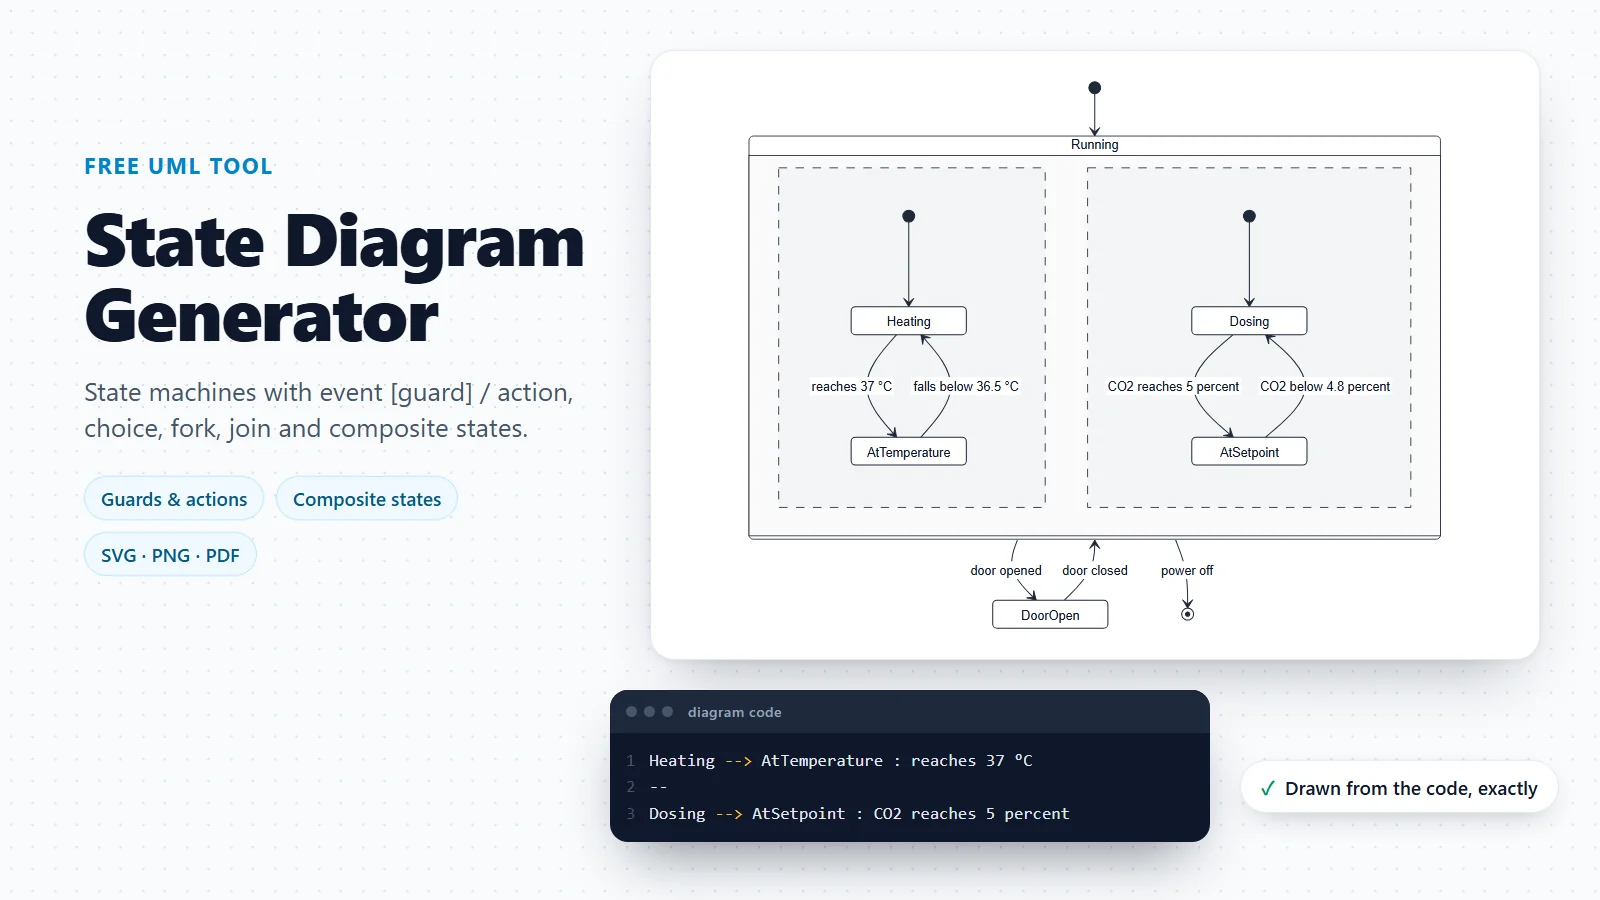
UML state machines with guards and actions, choice, fork and join, composite and concurrent states.
Workflow Diagram Generator
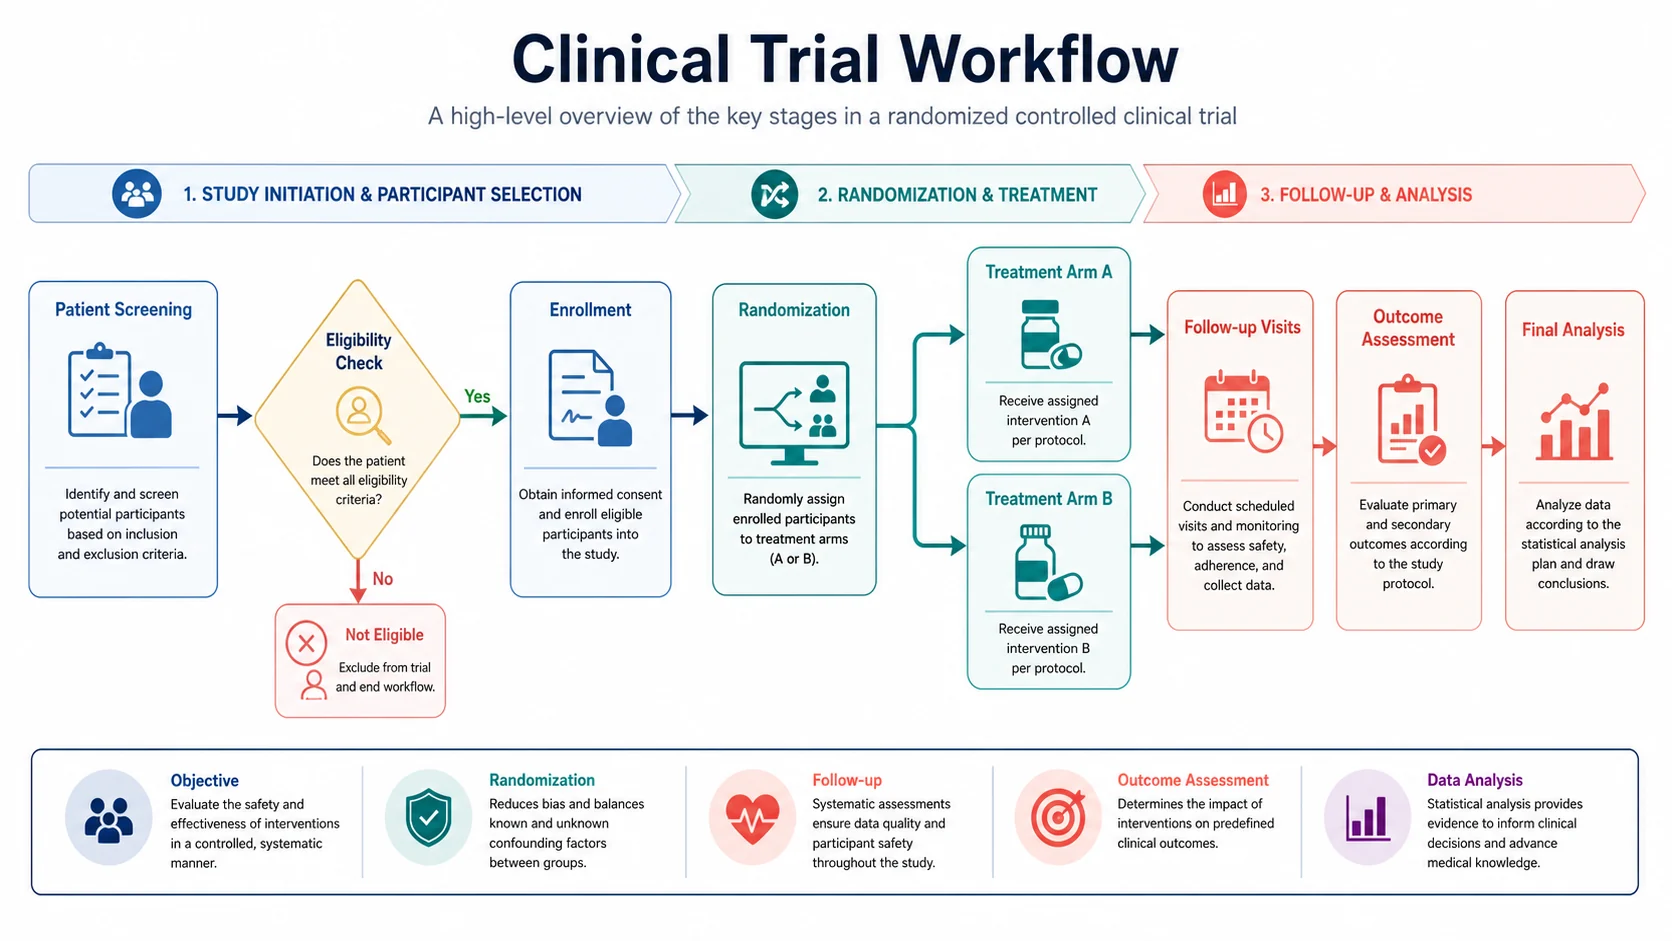
Turn a description of a process into a clean flowchart, the informal cousin of the activity diagram.
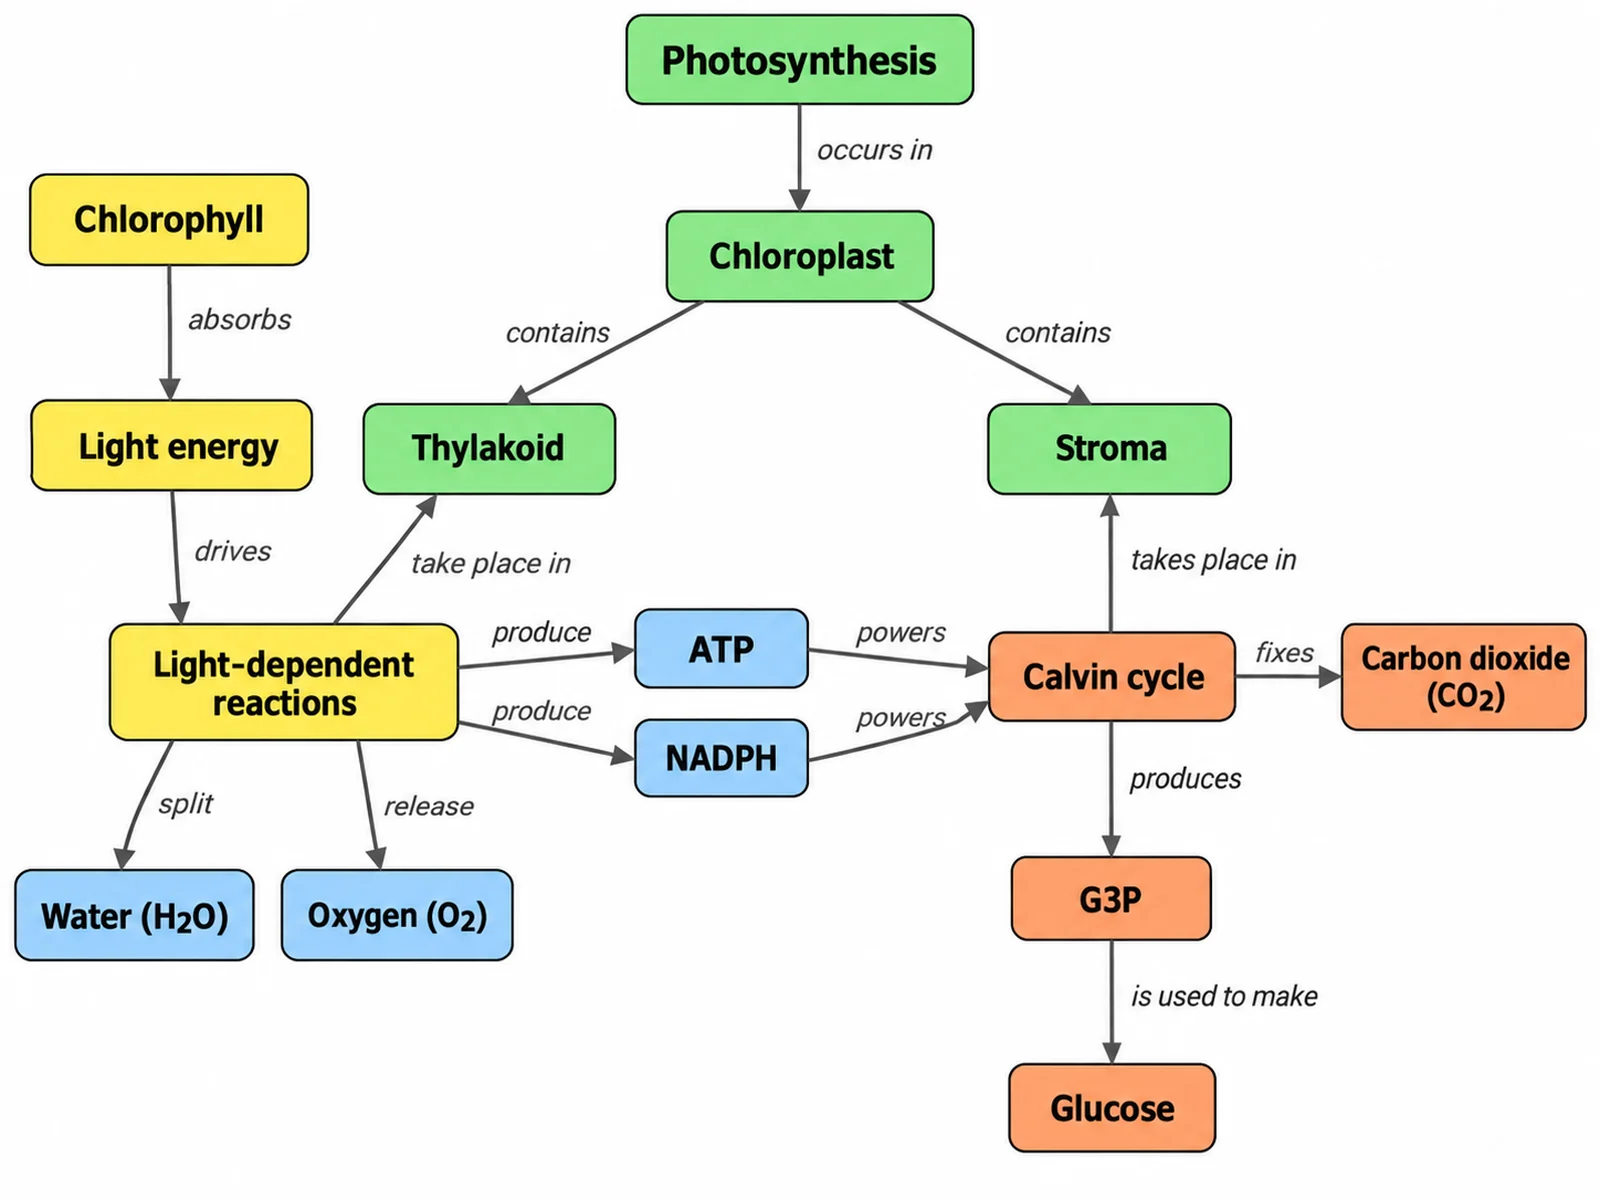
Concept Map Generator
Link ideas with labelled arrows when you are planning concepts rather than modelling software.
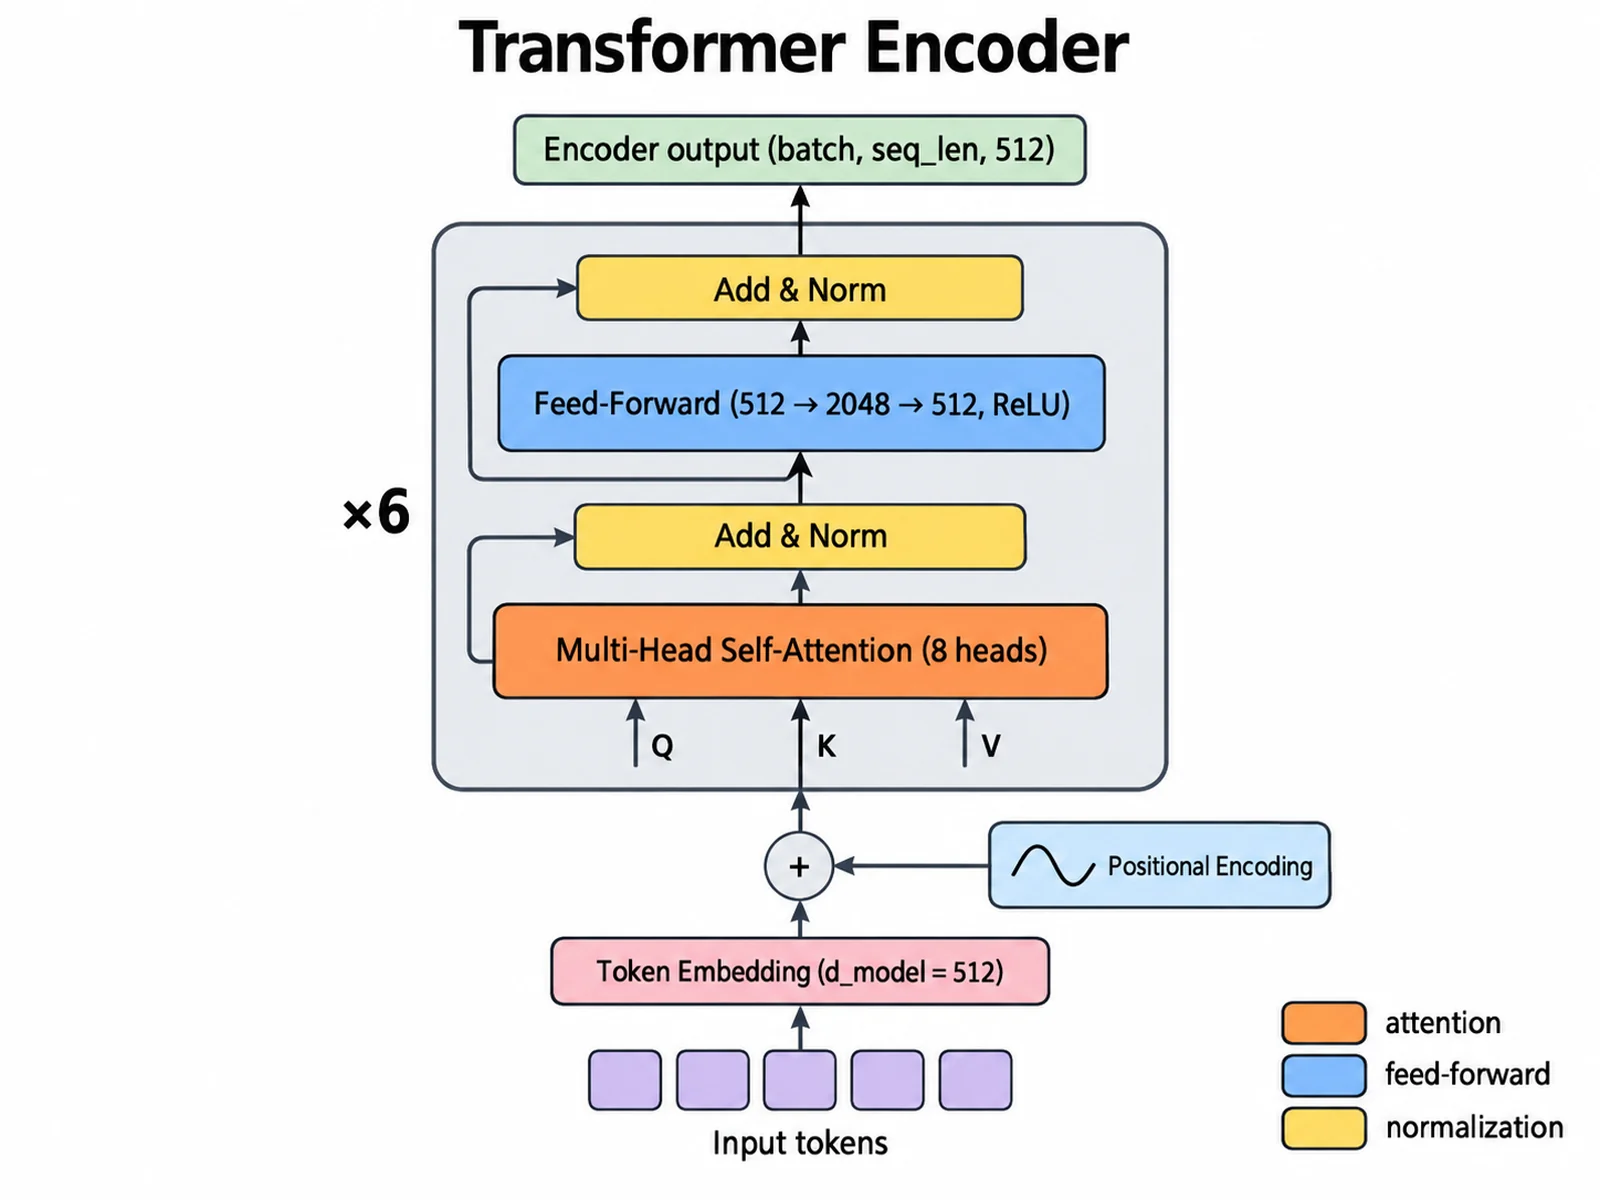
Neural Network Diagram Generator
Architecture figures for machine-learning models: layers, connections and tensor shapes.
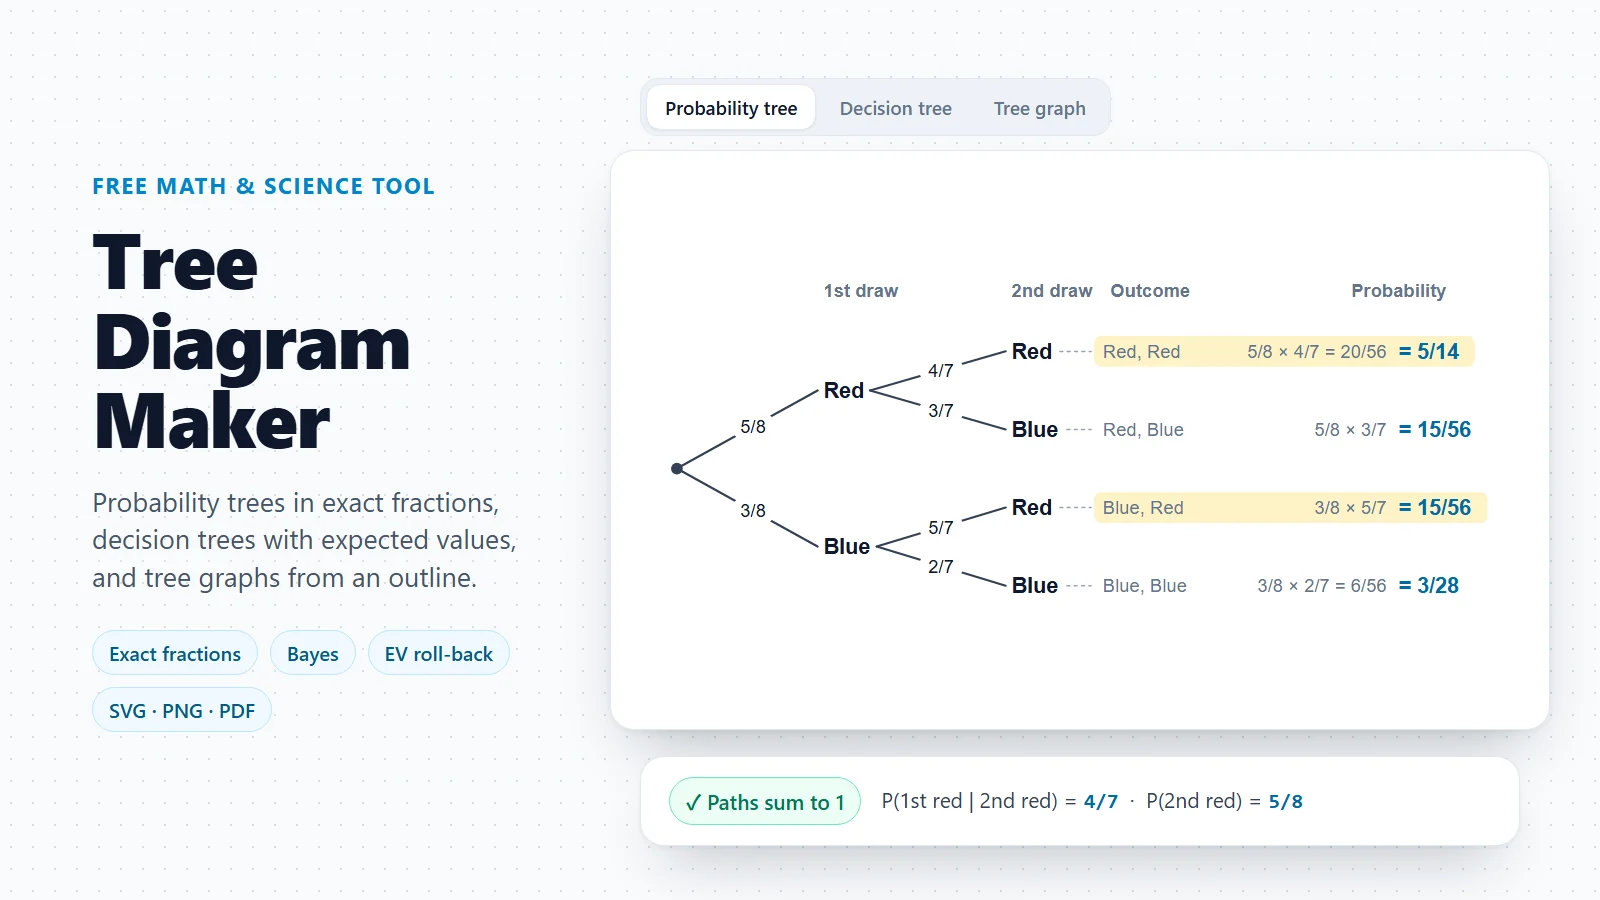
Tree Diagram Maker
Hierarchies, probability trees and decision trees, when every element has exactly one parent.
Need an illustrated figure instead of a formal model?
For a schematic of an experiment, a pipeline or a mechanism, the scientific diagram maker draws a publication-style illustration from a short description.
Open the scientific diagram makerLast checked: November 17, 2026. Sources: Object Management Group, Unified Modeling Language (UML) 2.5.1 specification; OMG, What is UML; Martin Fowler, UML Distilled, 3rd edition; Mermaid class diagram syntax.