Microscopes
Brightfield, widefield fluorescence, confocal, TEM and SEM compared on resolution, live imaging, 3D sectioning and sample preparation.
Free comparison chart maker
Put the options across the top and the criteria down the side, and the comparison chart draws itself: ✓, ✗ and partial marks, star ratings, numbers with units and short text, each measured so nothing spills out of its cell. Group the criteria, sort the options by price or score, highlight the one you recommend, and choose a colour-blind safe or greyscale theme. Paste a table from Excel or Google Sheets, or start from a template for microscopes, sequencing platforms, statistical software or reference managers. Free, and it runs in your browser.
Everything runs in your browser: nothing is uploaded, and your chart is kept on this device only. Undo with Ctrl+Z.
Templates
Each template is a finished comparison table with typical values, grouped criteria and a mix of ✓ / ✗, text, numbers and ratings. Open one and change any cell, or keep the layout and replace everything with your own options.
Brightfield, widefield fluorescence, confocal, TEM and SEM compared on resolution, live imaging, 3D sectioning and sample preparation.
Illumina short reads, PacBio HiFi, Oxford Nanopore and Sanger: read length, accuracy, methylation calling, portability and best uses.
R, Python, SPSS, Stata and GraphPad Prism compared on cost, licence, point-and-click analysis, scripting, mixed models and platforms.
Zotero, Mendeley, EndNote, JabRef and Paperpile compared on price, open source, free storage, the Word plugin and BibTeX export.
A generic three-plan product comparison with prices, star ratings, ✓/✗ features and a highlighted best-value column.
Every mark is drawn as a shape, not a font character, so it looks the same in PowerPoint, Word, Illustrator and print. Pasted values are read with these rules.
| Mark | Meaning | Type or paste | Use it for |
|---|---|---|---|
| Yes | ✓ ✔ yes y true x | The feature is present or the statement is true. | |
| Partial | partial, partly, limited, some, optional, add-on, ~ ◐ ½ | Present with limits: some models, an add-on, a paid tier. | |
| No | ✗ ✘ × no n false none | The feature is absent or the statement is false. | |
| Not stated | empty, -, –, —, ?, n/a, unknown | No information. Not the same as ✗. | |
| Star rating | ★★★½, 3.5/5, 3.5 stars, 3.5 out of 5 | A score out of five, to the nearest half star, from a stated source. | |
| Best value | any number, e.g. $1,299 or 4.5 kg | The highest or lowest number in a row that says which end is best. | |
| Recommended | Style → Recommended item | One option you suggest, with a badge that says what it is best for. |
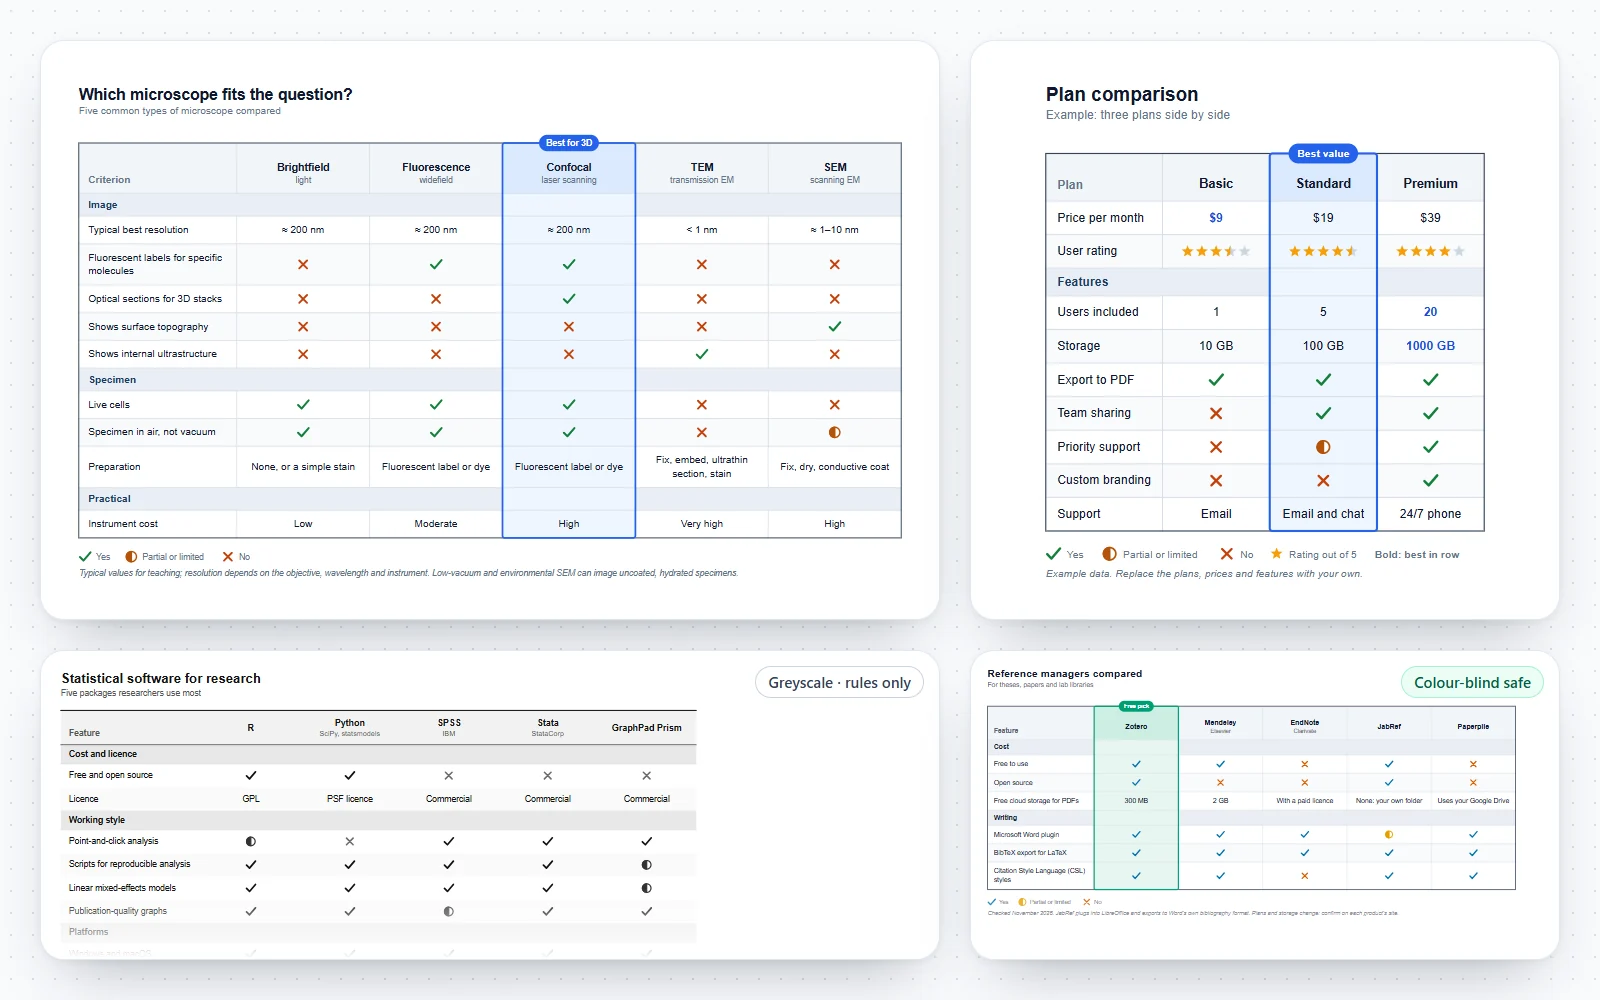
The chart above is the finished figure; the grid under it is where you type. Every change redraws the chart, Ctrl+Z undoes it, and your work is saved in this browser as you go.
The method is the same whether you create the chart here, in a spreadsheet or on paper. Most weak comparison charts fail at the first two steps, not at the drawing.
A comparison table is easiest to read when each row holds one kind of value. The table under this section lists every symbol the chart uses and the words it accepts when you paste data.
Comparison chart and comparison table usually mean the same thing: options in columns, criteria in rows. Other figures suit other questions.
Scientists compare things all the time: instruments before a purchase, methods before an experiment, software before a project. A clear chart makes that reasoning visible to a supervisor, a committee or a reader.
Good comparison tables follow the same rules as good scientific tables: few, clear rows, consistent units, and emphasis only where it carries meaning.
Select the table in your spreadsheet, copy it, and paste it into the Paste tab. Tab-separated text from a spreadsheet, CSV and semicolon-separated files all work.
A highlighted column is a strong signal. Readers will trust it only if the rest of the chart is fair.
A comparison chart is a table that sets two or more options side by side against the same criteria, so differences are easy to see. Options usually run across the top, criteria down the side, and each cell holds a ✓ or ✗, a number, a rating or a short note.
Open the editor at the top of this page, pick a template or the blank chart, type your options across the top and your criteria down the side, and fill in the cells. The chart redraws as you type. Export it as SVG, PNG, PDF or CSV; there is no sign-up, watermark or charge.
All three. A comparison chart and a comparison table are the same layout. This generator draws it as a finished figure with symbols, ratings and a highlighted column, and it also gives you the data as a CSV table.
Yes. Copy the cells in your spreadsheet and paste them into the Paste tab. The first row holds the option names and the first column holds the criteria. The tool detects whether each row is ✓ / ✗, numbers, star ratings or text, and keeps shared units such as $ or GB.
Yes, Y, true, x, ✓ and ✔ read as yes; No, N, false, ✗ and × read as no; partial, partly, limited, some, optional, add-on and ~ read as partial; and a dash, n/a, a question mark or an empty cell read as not stated. In the grid you choose from a menu, so you never need to type a symbol.
Open Style and choose the option under Recommended. Its column gets a tinted band, a coloured outline and a badge above it. Change the badge text to say what it is best for, such as “Best value”, or clear it to keep the band without a badge.
Yes. Open Arrange and sort the options by any criterion, from low to high or high to low, or by their ✓ score, where ✓ counts one and partial counts a half. Empty cells always sort last. You can also sort the criteria A to Z inside each group, and undo any sort with Ctrl+Z.
Choose the colour-blind safe theme, which uses the Okabe–Ito blue for ✓ and vermillion for ✗. Every mark also has its own shape, so the chart reads without colour, and the greyscale theme prints well in black and white.
SVG (vector), PNG at 2× or 4×, PDF through your browser’s print dialog, a copied image for slides, CSV for spreadsheets, tab-separated text for pasting, and a .json chart file you can open again in this tool.
Up to eight options and forty rows, including group headers. For a slide or a journal page, two to six options and about ten to fifteen criteria read best; split anything larger into two charts.
Columns, in most cases. Option names are short and criteria are long, so options across the top and criteria down the side fit a landscape slide or page and let readers scan each criterion across all options.
Click Copy image and paste it into the document or slide, or download the PNG. For a figure you will resize or edit, insert the SVG; recent versions of Word and PowerPoint accept SVG and keep it sharp.
They are typical, textbook-level values for teaching and planning, checked in November 2026. Instruments, plans and software change, so confirm the specification of the exact model or version and cite that source in the footnote before you publish or buy.
Type them into the footnote field under the grid, with the date you checked them. The footnote prints under the table in every export, in the same style as a table note in a journal.
Your chart is saved automatically in this browser and comes back when you return. Nothing is uploaded. To move it to another computer, use More, then Save chart file, and open the .json file there.
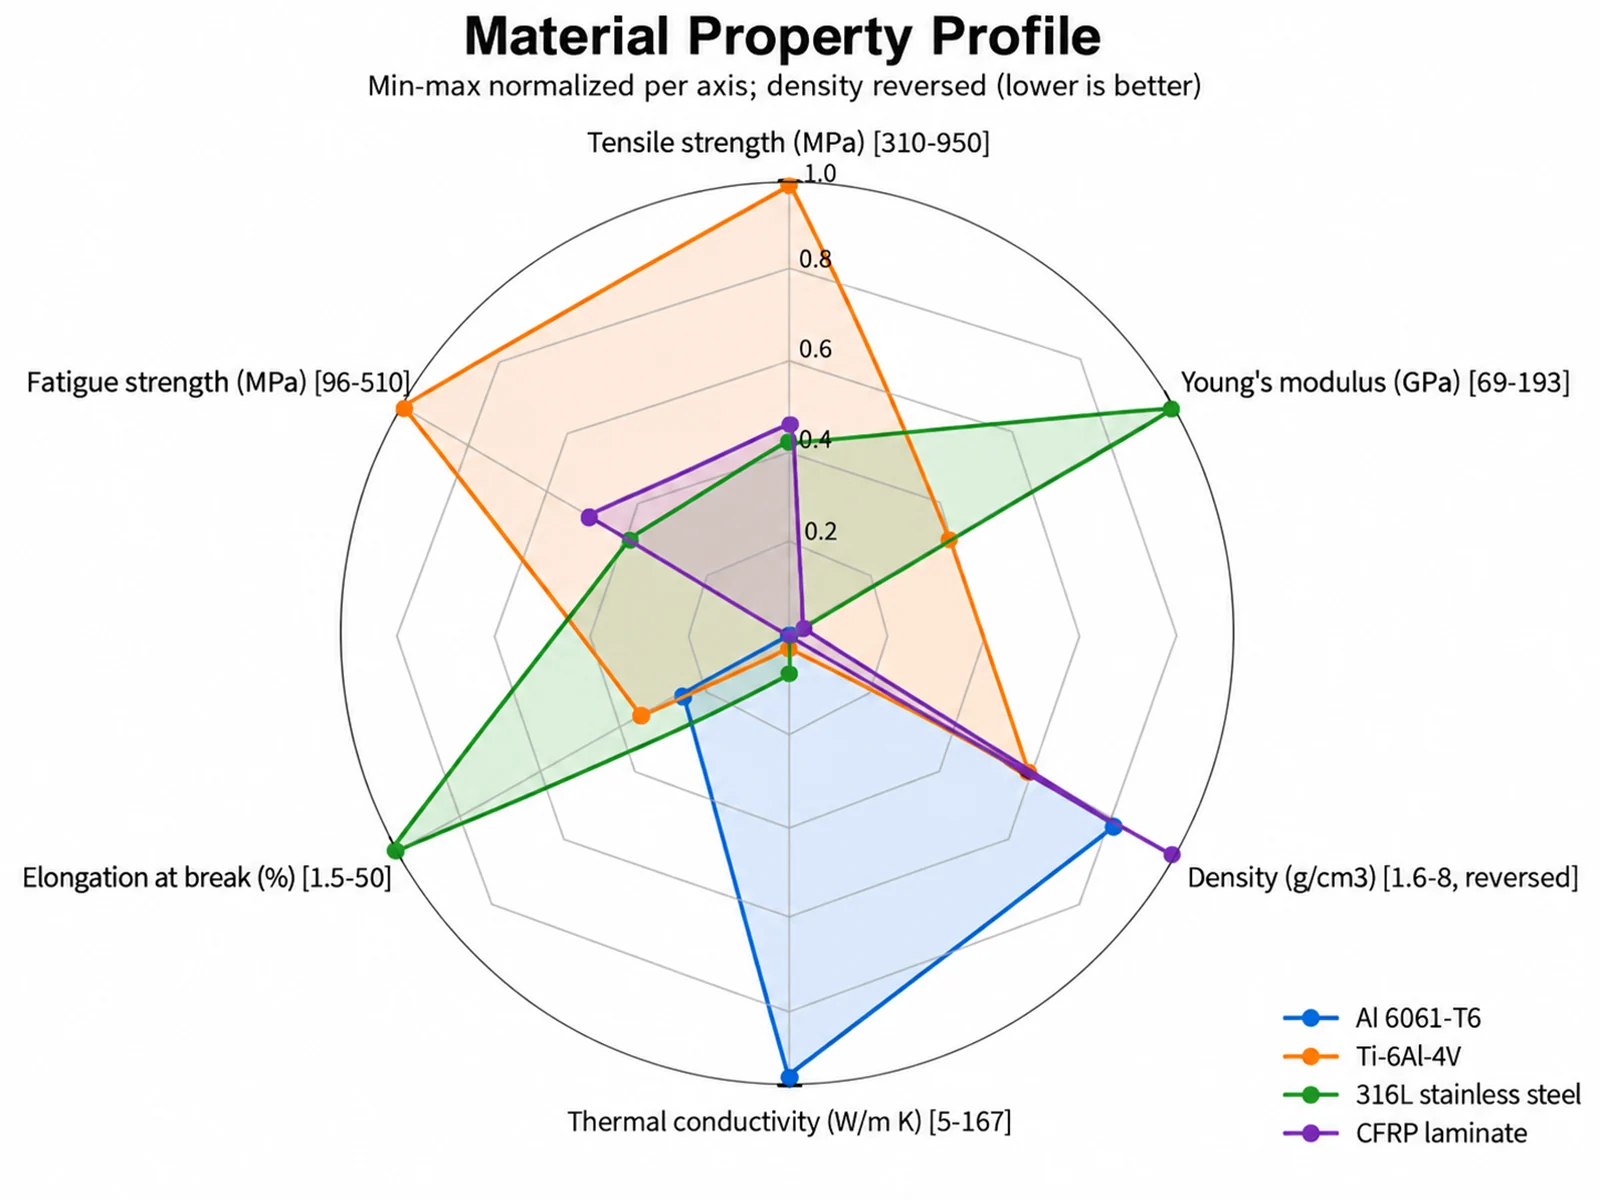
Radar Chart Maker
Show several scores on one scale as a shape per option, next to the comparison table that gives the exact values.
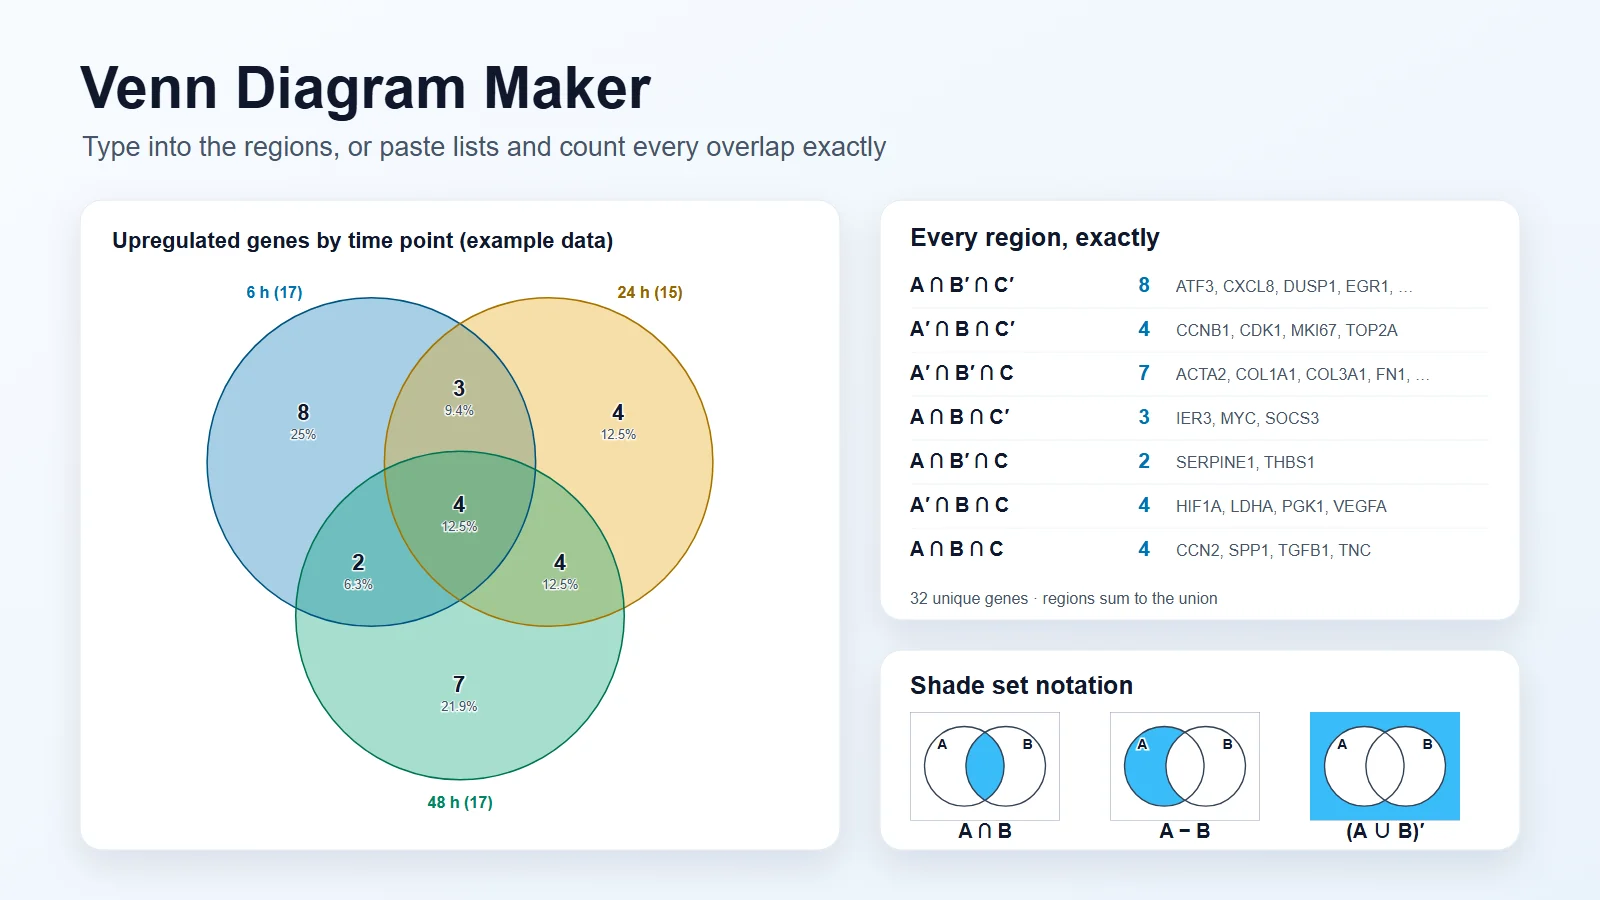
Venn Diagram Maker
When the question is overlap rather than ranking: what two or three groups share and what is unique to each.
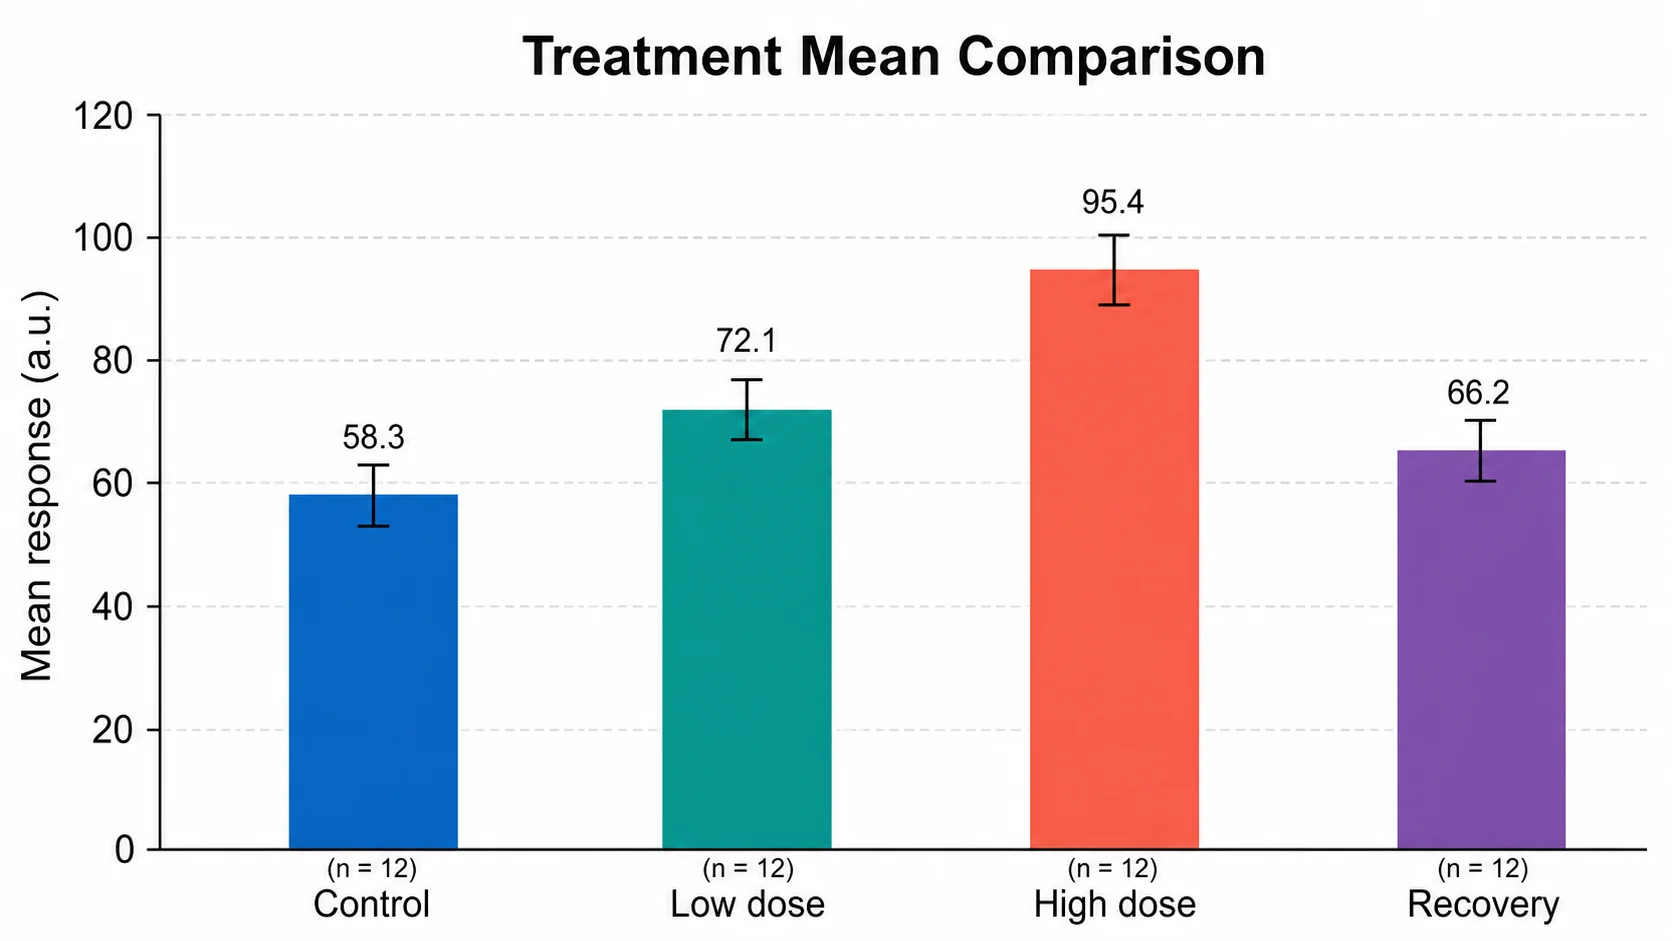
Bar Chart Generator
Plot one measured value across options when the size of the difference matters more than the number.
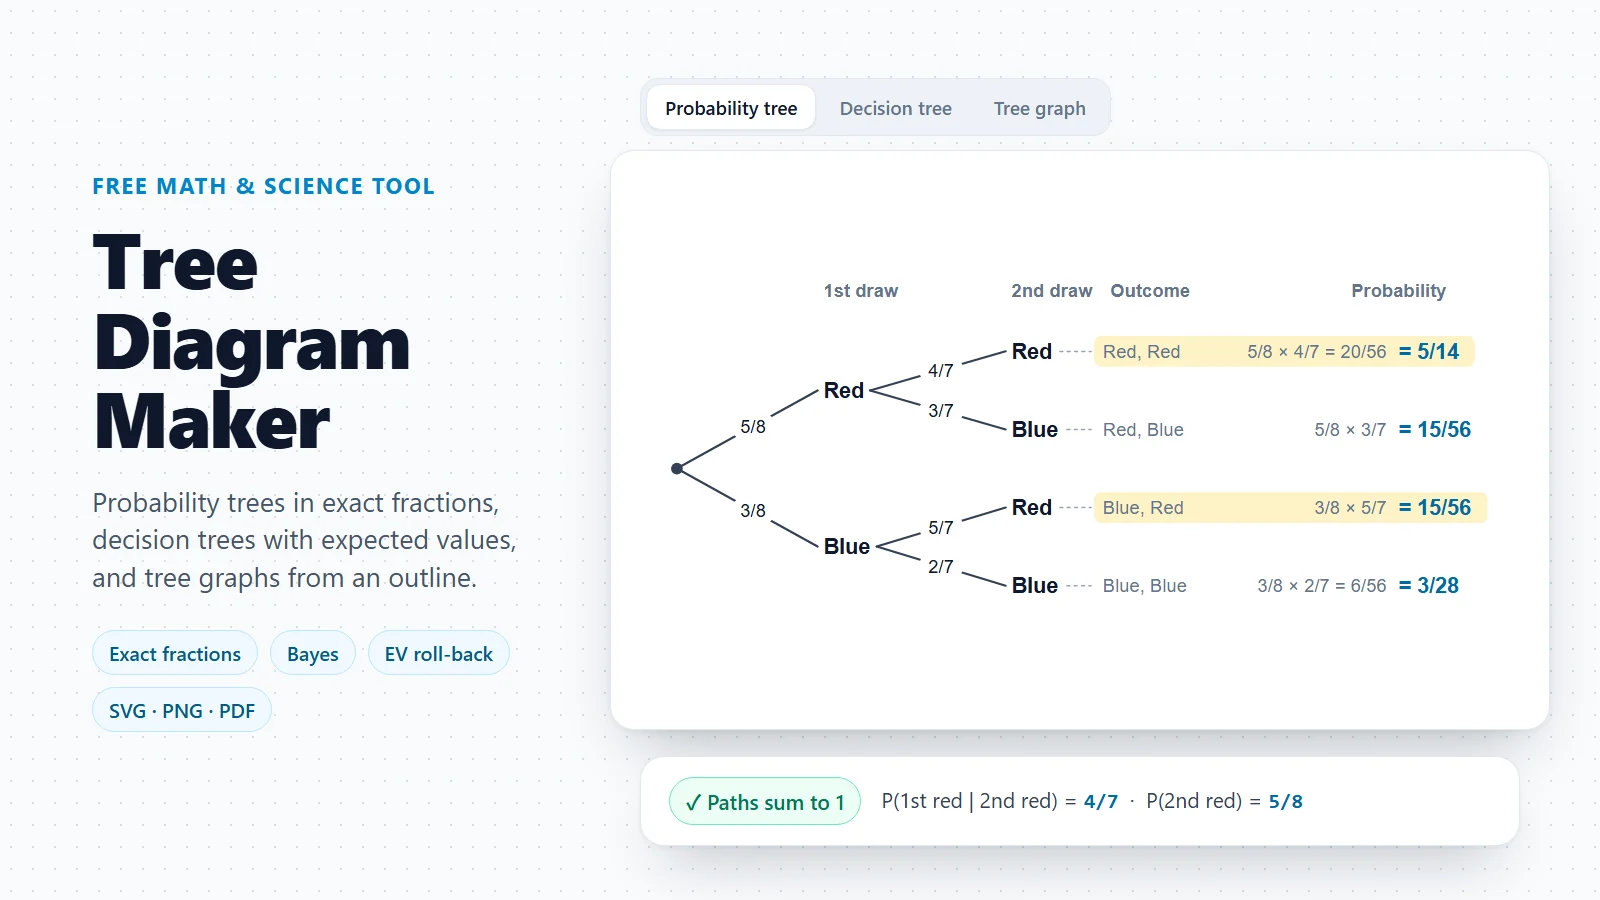
Tree Diagram Maker
Decision trees with probabilities and expected values, for choices that depend on uncertain outcomes.
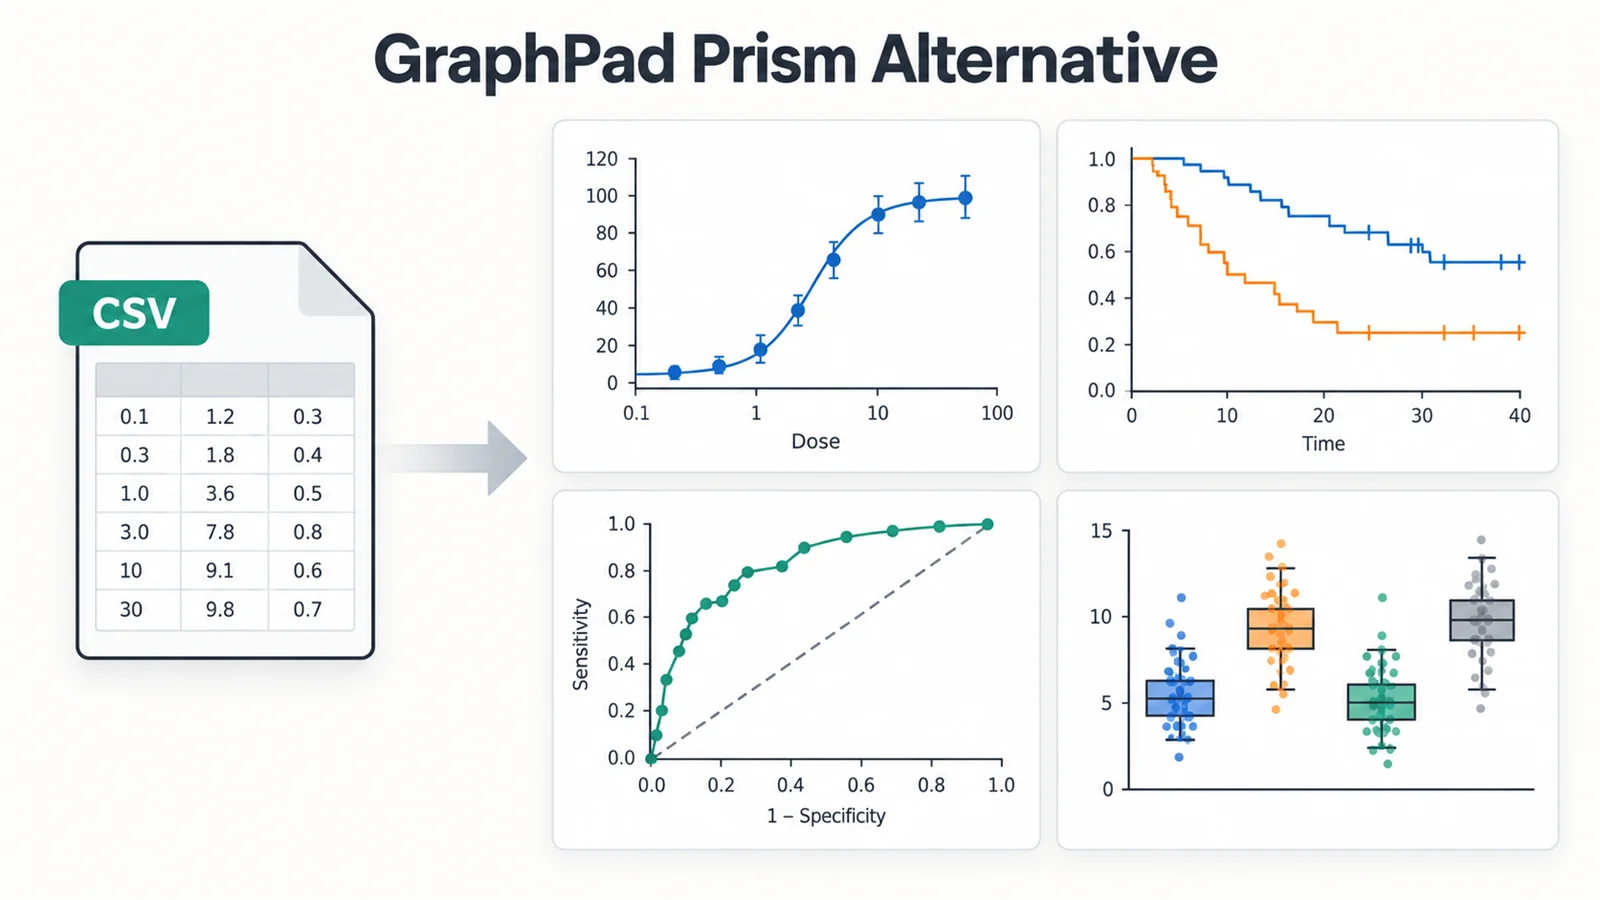
GraphPad Prism Alternative
Free statistics and publication graphs in the browser, for labs comparing analysis software.
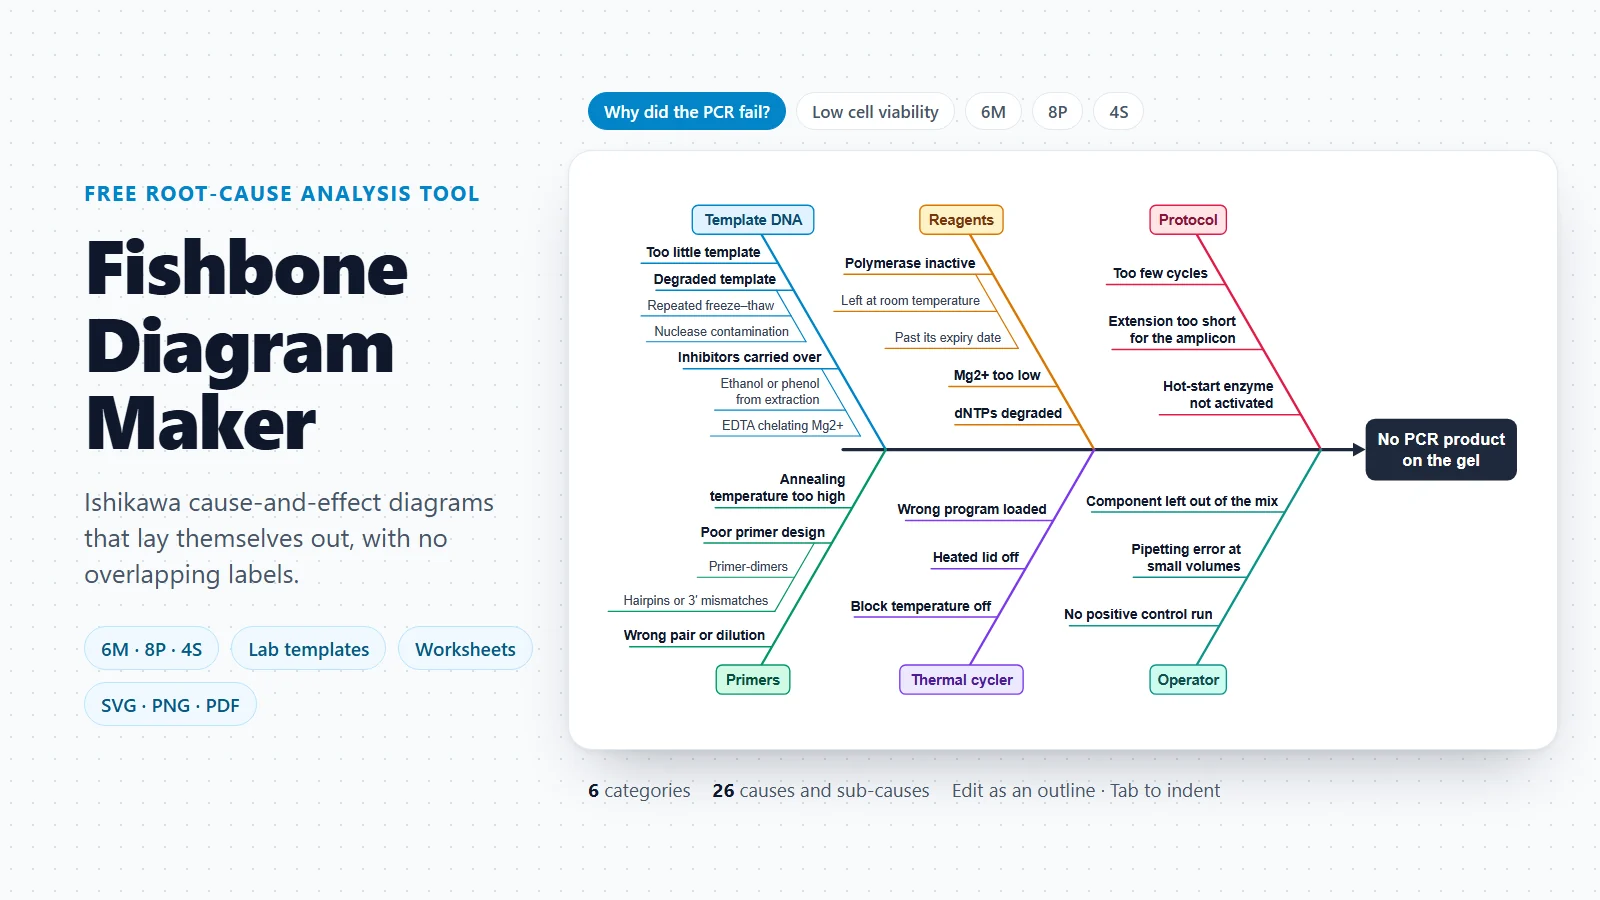
Fishbone Diagram Maker
Sort the possible causes of a problem before comparing the fixes side by side.
A radar chart shows each option’s overall profile at a glance. Put it next to the comparison table so readers get the picture and the exact numbers.
Open the radar chart makerLast checked: November 17, 2026. Sources: Okabe M. & Ito K., Color Universal Design (CUD): How to make figures and presentations that are friendly to colorblind people; Wong B., Points of view: Color blindness (Nature Methods, 2011); APA Style, Tables; OpenStax Microbiology, 2.3 Instruments of Microscopy; Logsdon G.A., Vollger M.R. & Eichler E.E., Long-read human genome sequencing and its applications (Nature Reviews Genetics, 2020); Zotero documentation, Storage; W3C Web Accessibility Initiative, Tables tutorial. Template values are typical figures for teaching and planning, not the specification of any particular instrument, plan or software version.