Describe a vector and generate a labeled circular plasmid map for a paper, thesis, poster, or slide. List the features with bp coordinates and the total size, and get promoter arrows, resistance genes, an origin of replication, the MCS, and scale ticks in one clean figure.
Circular vector mapsFeature arrows with bp positionsPaper and slide ready
AI Plasmid Map Maker
List the total size and every feature with its bp coordinates and direction.
Costs 5 credits599 / 2000 characters
Generate a publication-style PNG from your feature list.
Preview
Plasmid Map Example Previews
Target aspect ratio: 4:3
Sample previews. Describe your vector to generate your own plasmid map.
Plasmid Map Examples
Six example constructs with explicit bp coordinates: a T7 expression vector, a mammalian vector, a CRISPR sgRNA vector, a GFP reporter, a lentiviral transfer plasmid, and a cloning vector with its restriction sites.
Prompt
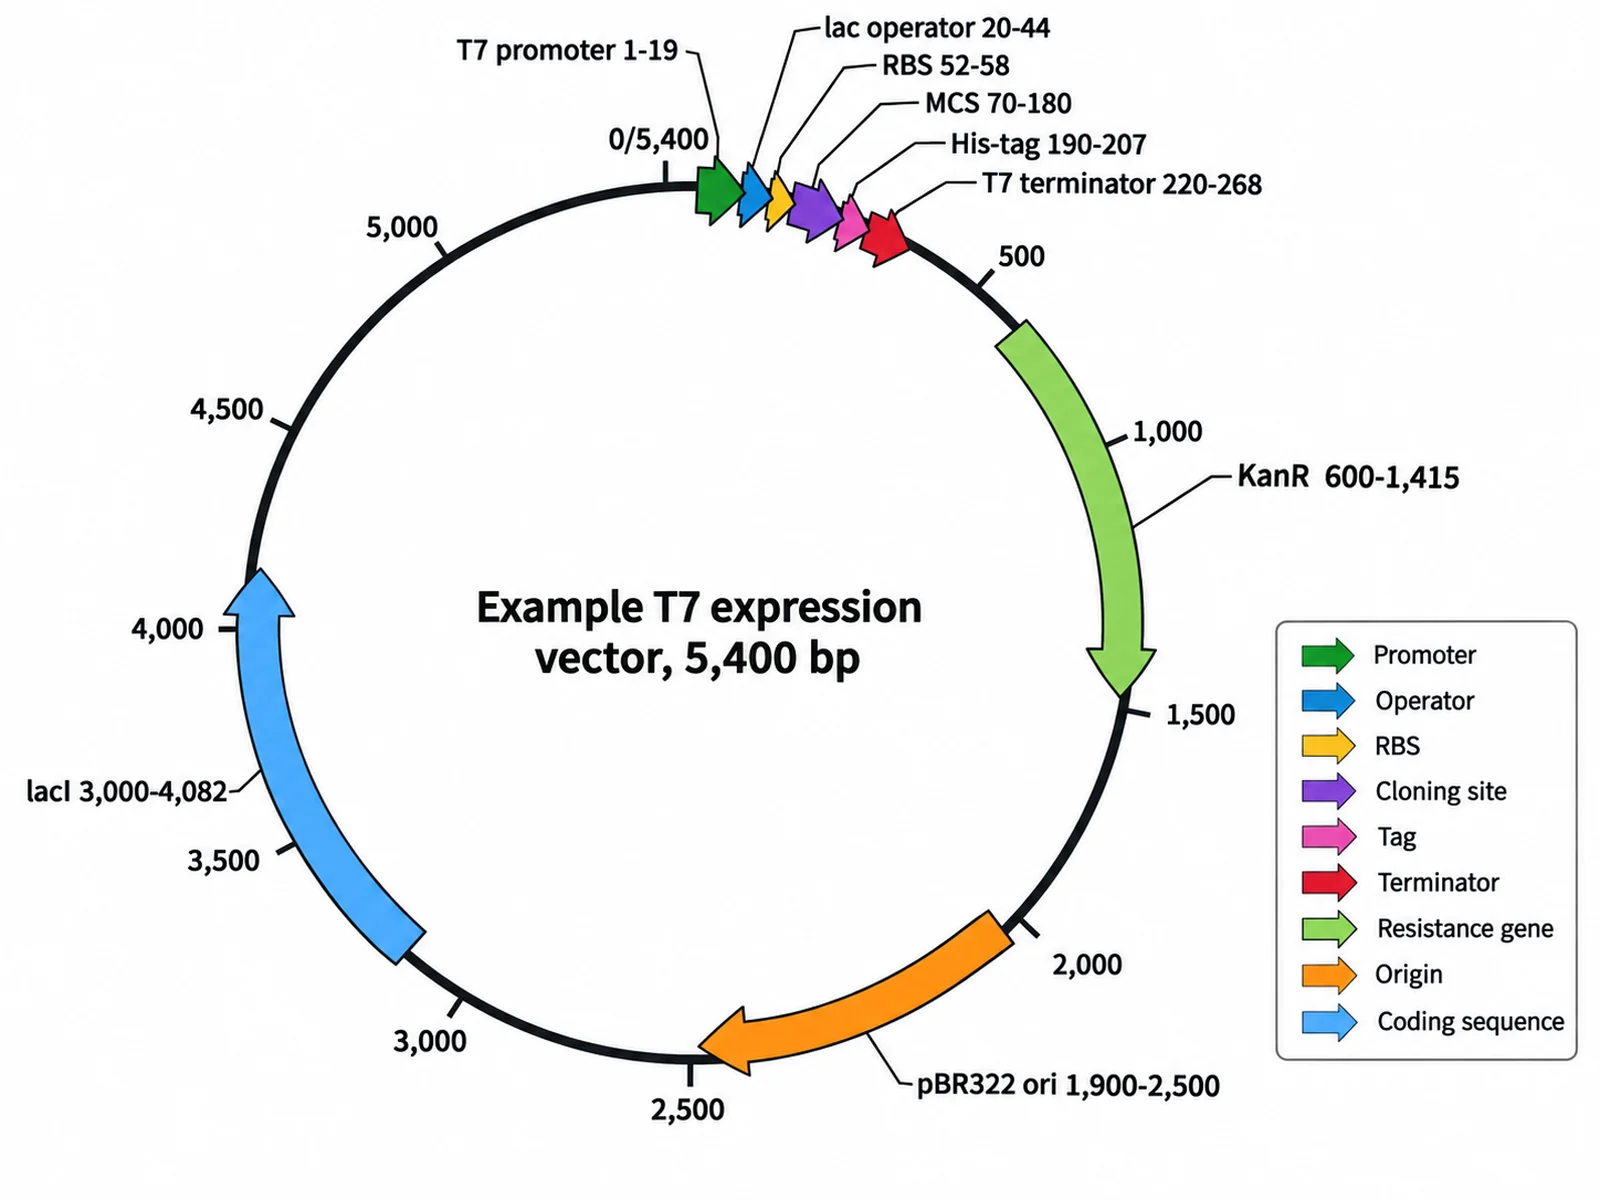
Create a labeled circular plasmid map for an example pET-style T7 expression vector, total size 5,400 bp, on a white background. Draw bp scale ticks every 500 bp with a 0/5,400 marker at the top. Place these features as colored arrows with name and bp range labels: T7 promoter 1-19, lac operator 20-44, RBS 52-58, MCS 70-180, His-tag 190-207, T7 terminator 220-268, KanR 600-1,415, pBR322 ori 1,900-2,500, lacI 3,000-4,082. Color by feature type, add a legend, and print "Example T7 expression vector, 5,400 bp" in the center.
T7 Expression Vector
Prompt
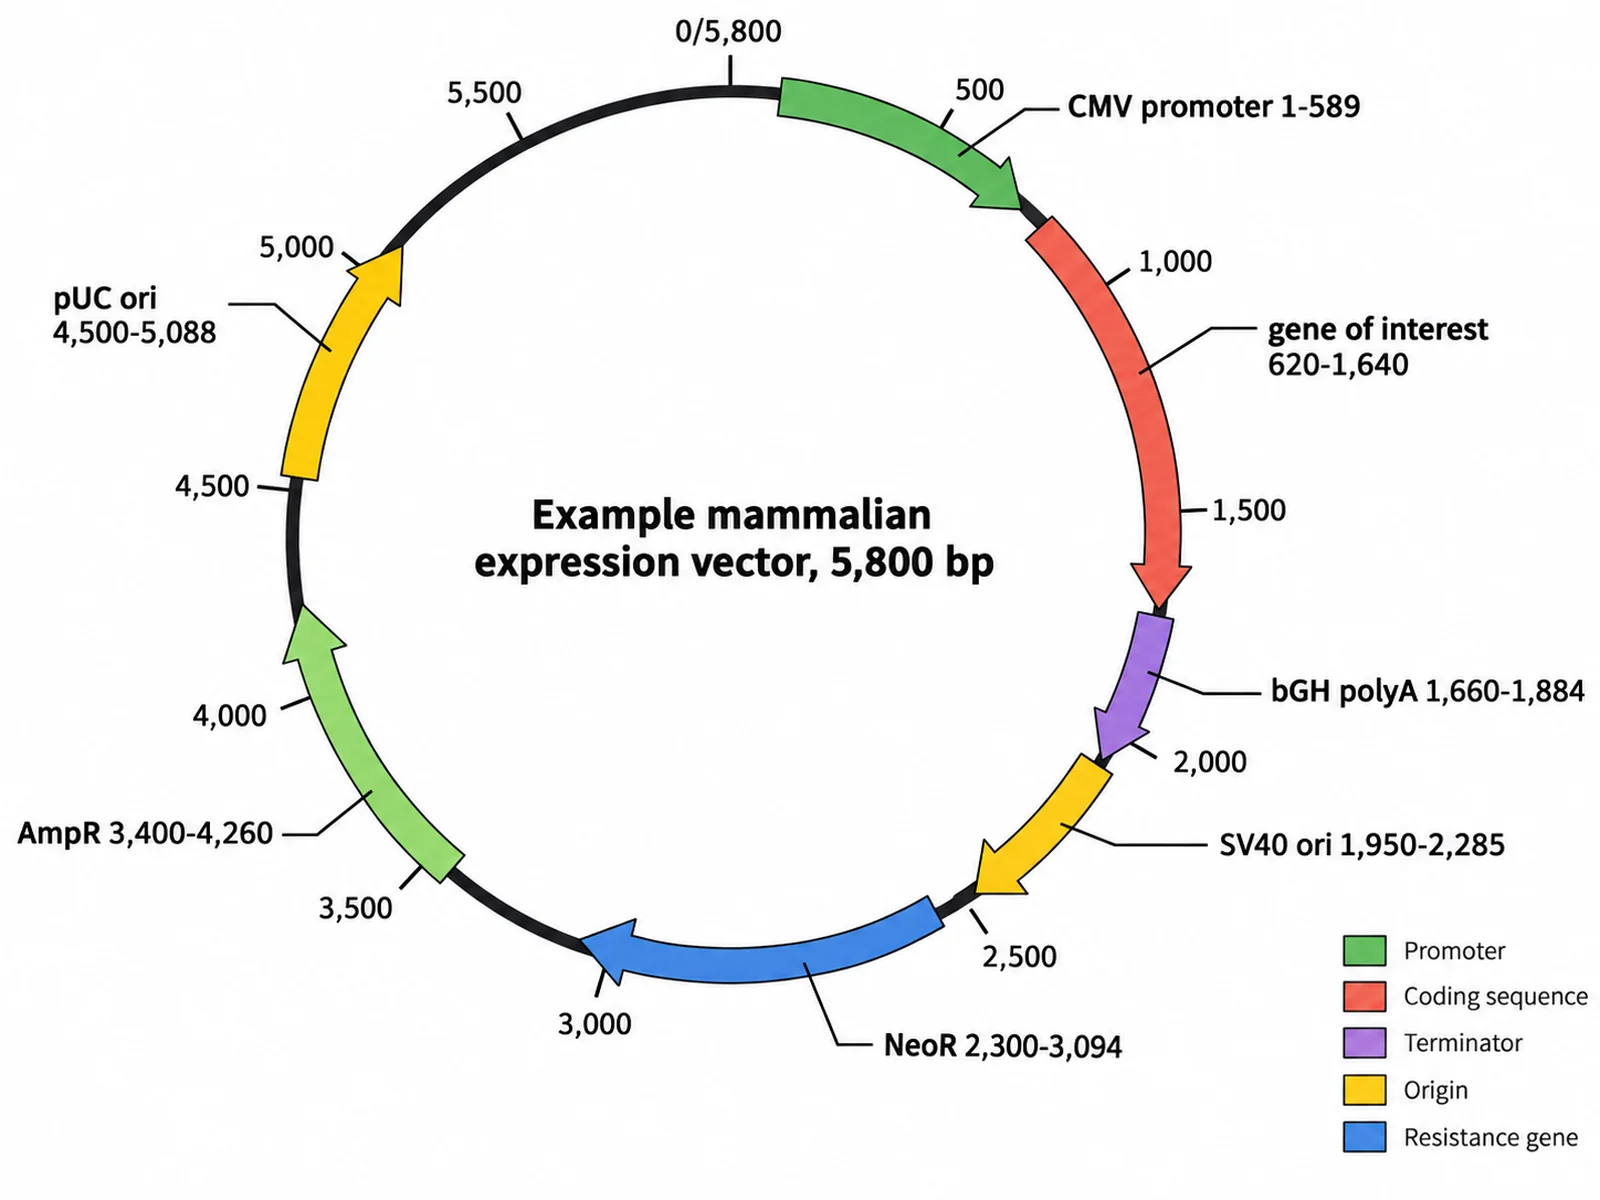
Create a labeled circular plasmid map for an example mammalian expression vector, total size 5,800 bp, on a white background. Draw bp scale ticks every 500 bp with a 0/5,800 marker at the top. Place these features as colored arrows with name and bp range labels: CMV promoter 1-589, gene of interest 620-1,640, bGH polyA 1,660-1,884, SV40 ori 1,950-2,285, NeoR 2,300-3,094, AmpR 3,400-4,260, pUC ori 4,500-5,088. Color by feature type, add a legend, and print "Example mammalian expression vector, 5,800 bp" in the center.
Mammalian Expression Vector
Prompt
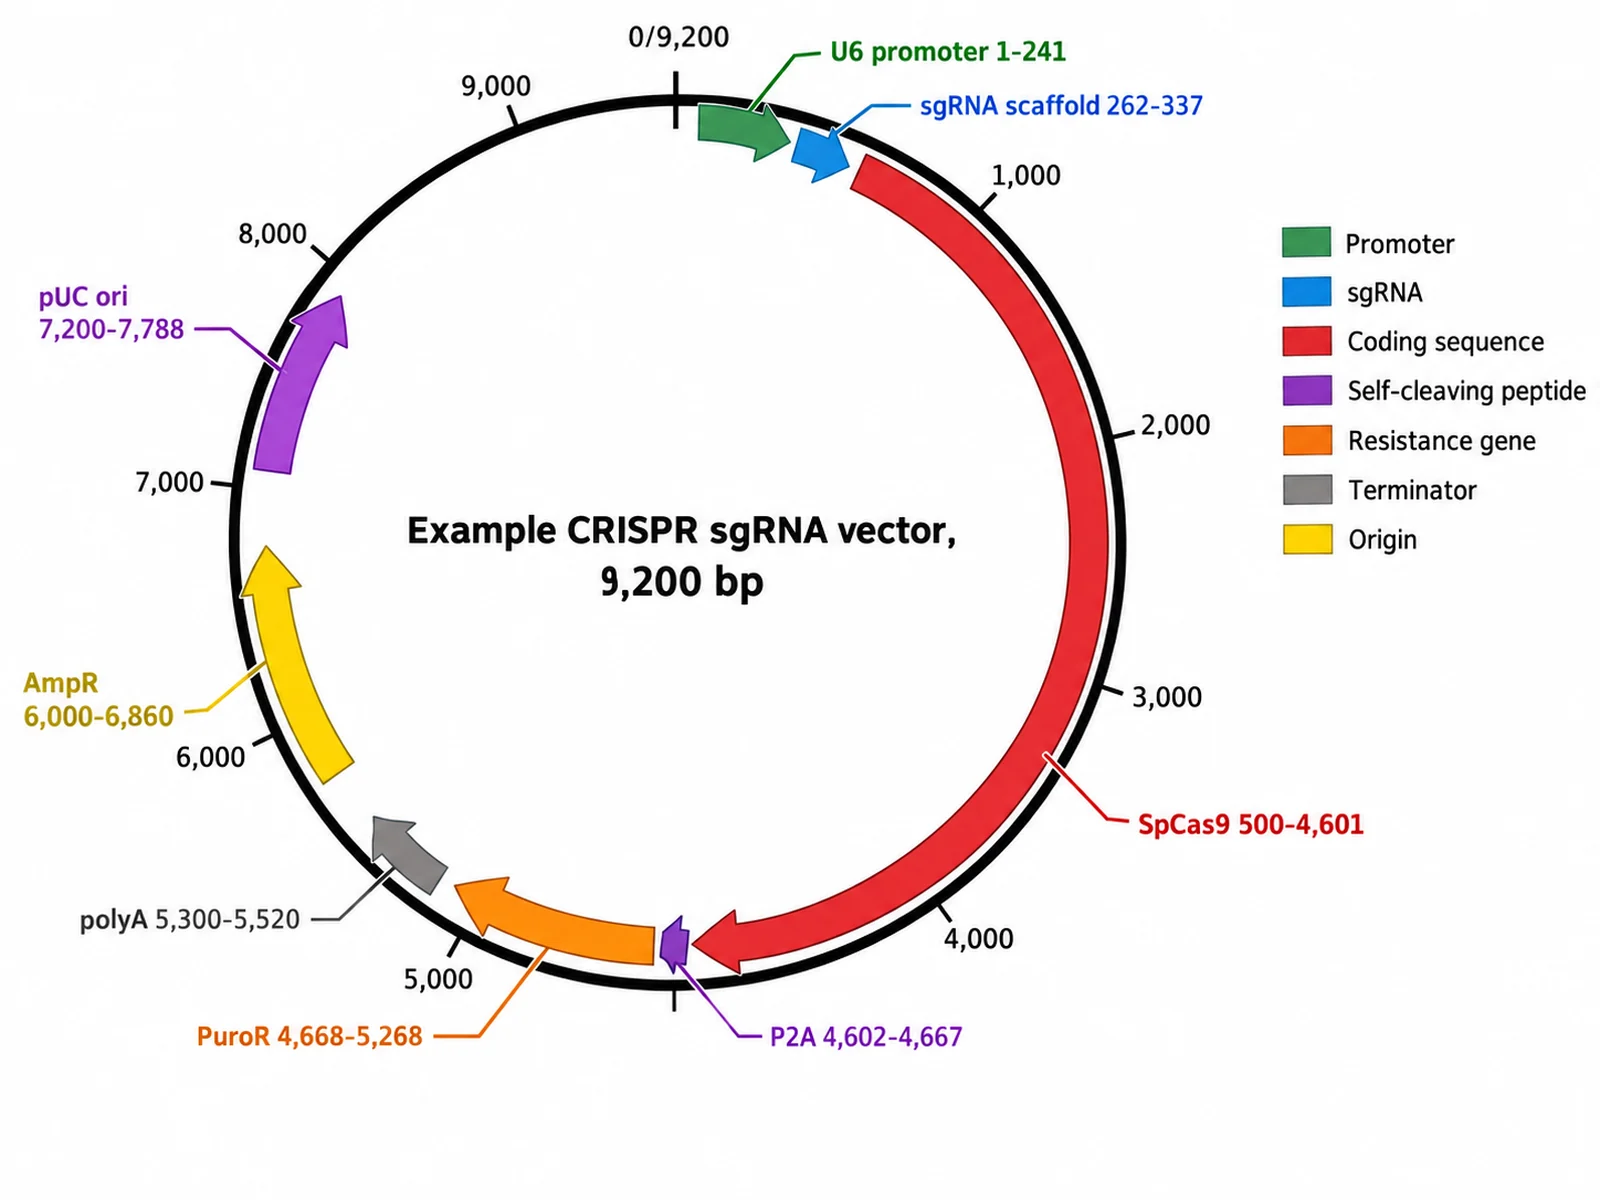
Create a labeled circular plasmid map for an example CRISPR guide RNA and Cas9 vector, total size 9,200 bp, on a white background. Draw bp scale ticks every 1,000 bp with a 0/9,200 marker at the top. Place these features as colored arrows with name and bp range labels: U6 promoter 1-241, sgRNA scaffold 262-337, SpCas9 500-4,601, P2A 4,602-4,667, PuroR 4,668-5,268, polyA 5,300-5,520, AmpR 6,000-6,860, pUC ori 7,200-7,788. Color by feature type, add a legend, and print "Example CRISPR sgRNA vector, 9,200 bp" in the center.
CRISPR Guide RNA Vector
Prompt
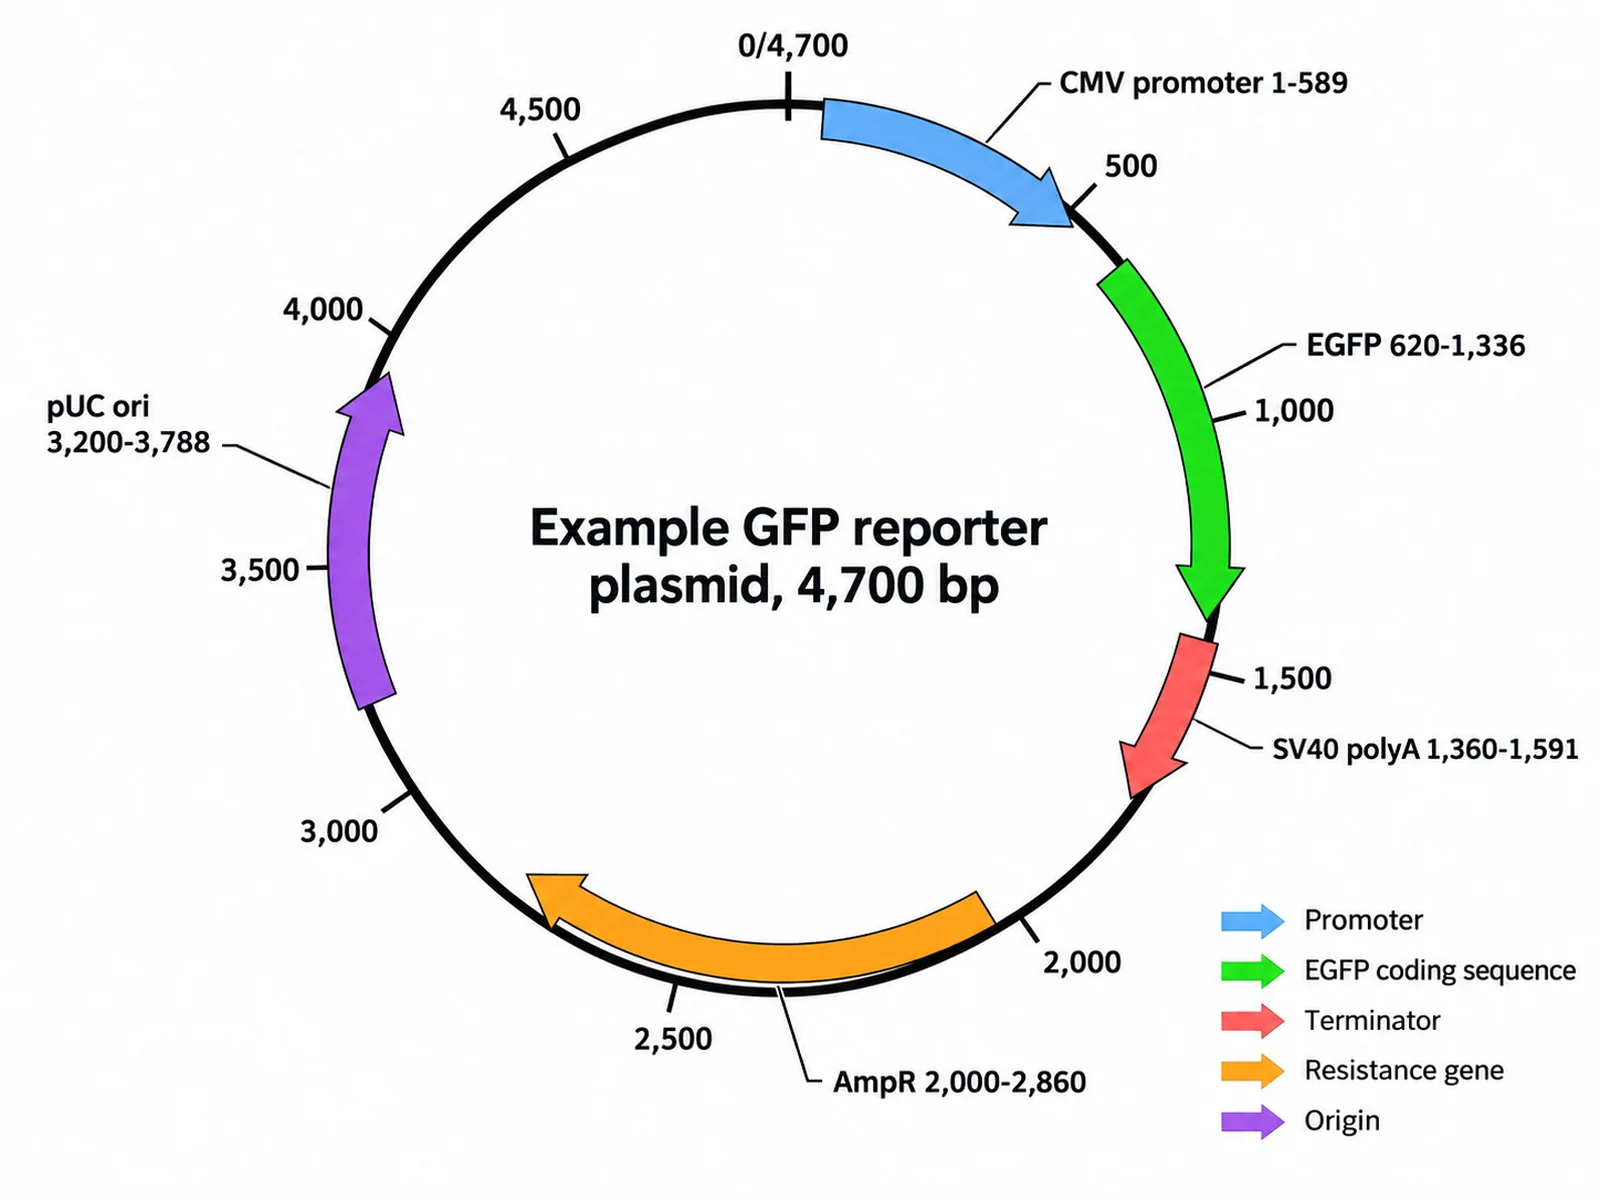
Create a labeled circular plasmid map for an example GFP reporter plasmid, total size 4,700 bp, on a white background. Draw bp scale ticks every 500 bp with a 0/4,700 marker at the top. Place these features as colored arrows with name and bp range labels: CMV promoter 1-589, EGFP 620-1,336, SV40 polyA 1,360-1,591, AmpR 2,000-2,860, pUC ori 3,200-3,788. Render the EGFP coding sequence in green, color the other features by type, add a legend, and print "Example GFP reporter plasmid, 4,700 bp" in the center.
GFP Reporter Plasmid
Prompt
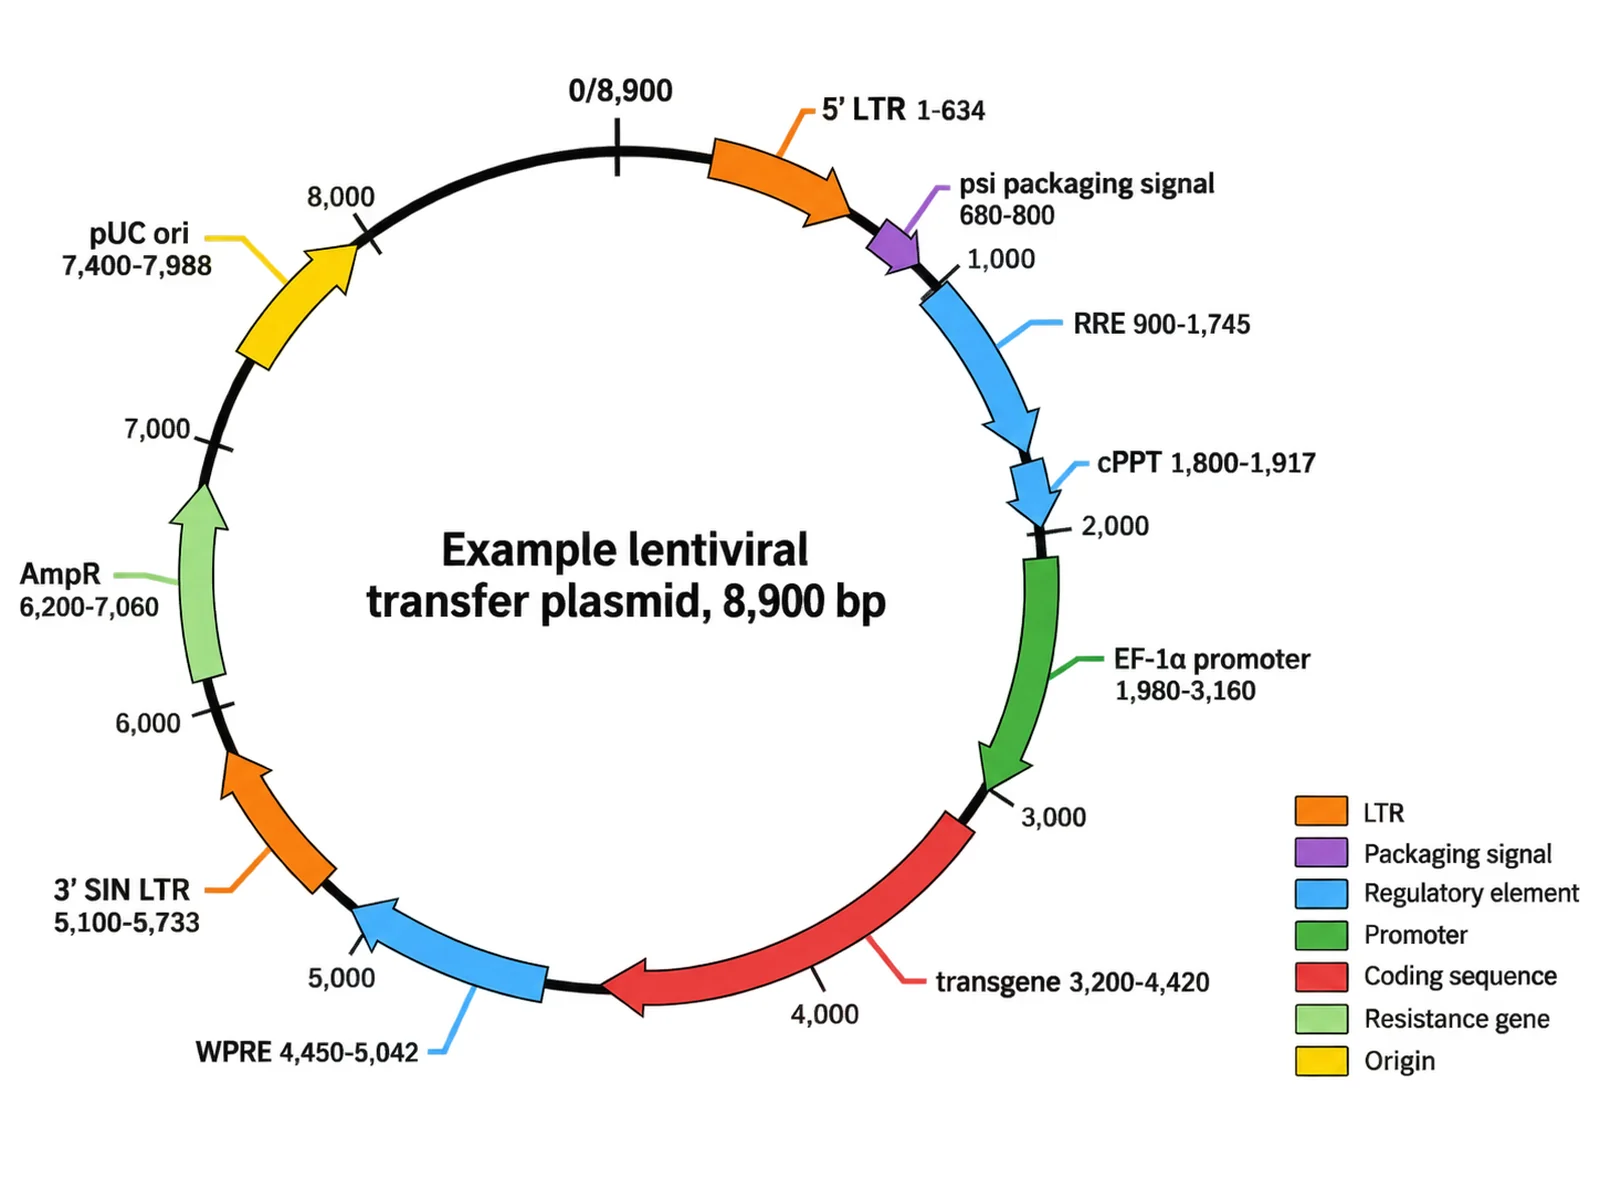
Create a labeled circular plasmid map for an example lentiviral transfer plasmid, total size 8,900 bp, on a white background. Draw bp scale ticks every 1,000 bp with a 0/8,900 marker at the top. Place these features as colored arrows with name and bp range labels: 5′ LTR 1-634, psi packaging signal 680-800, RRE 900-1,745, cPPT 1,800-1,917, EF-1α promoter 1,980-3,160, transgene 3,200-4,420, WPRE 4,450-5,042, 3′ SIN LTR 5,100-5,733, AmpR 6,200-7,060, pUC ori 7,400-7,988. Color by feature type, add a legend, and print "Example lentiviral transfer plasmid, 8,900 bp" in the center.
Lentiviral Transfer Plasmid
Prompt
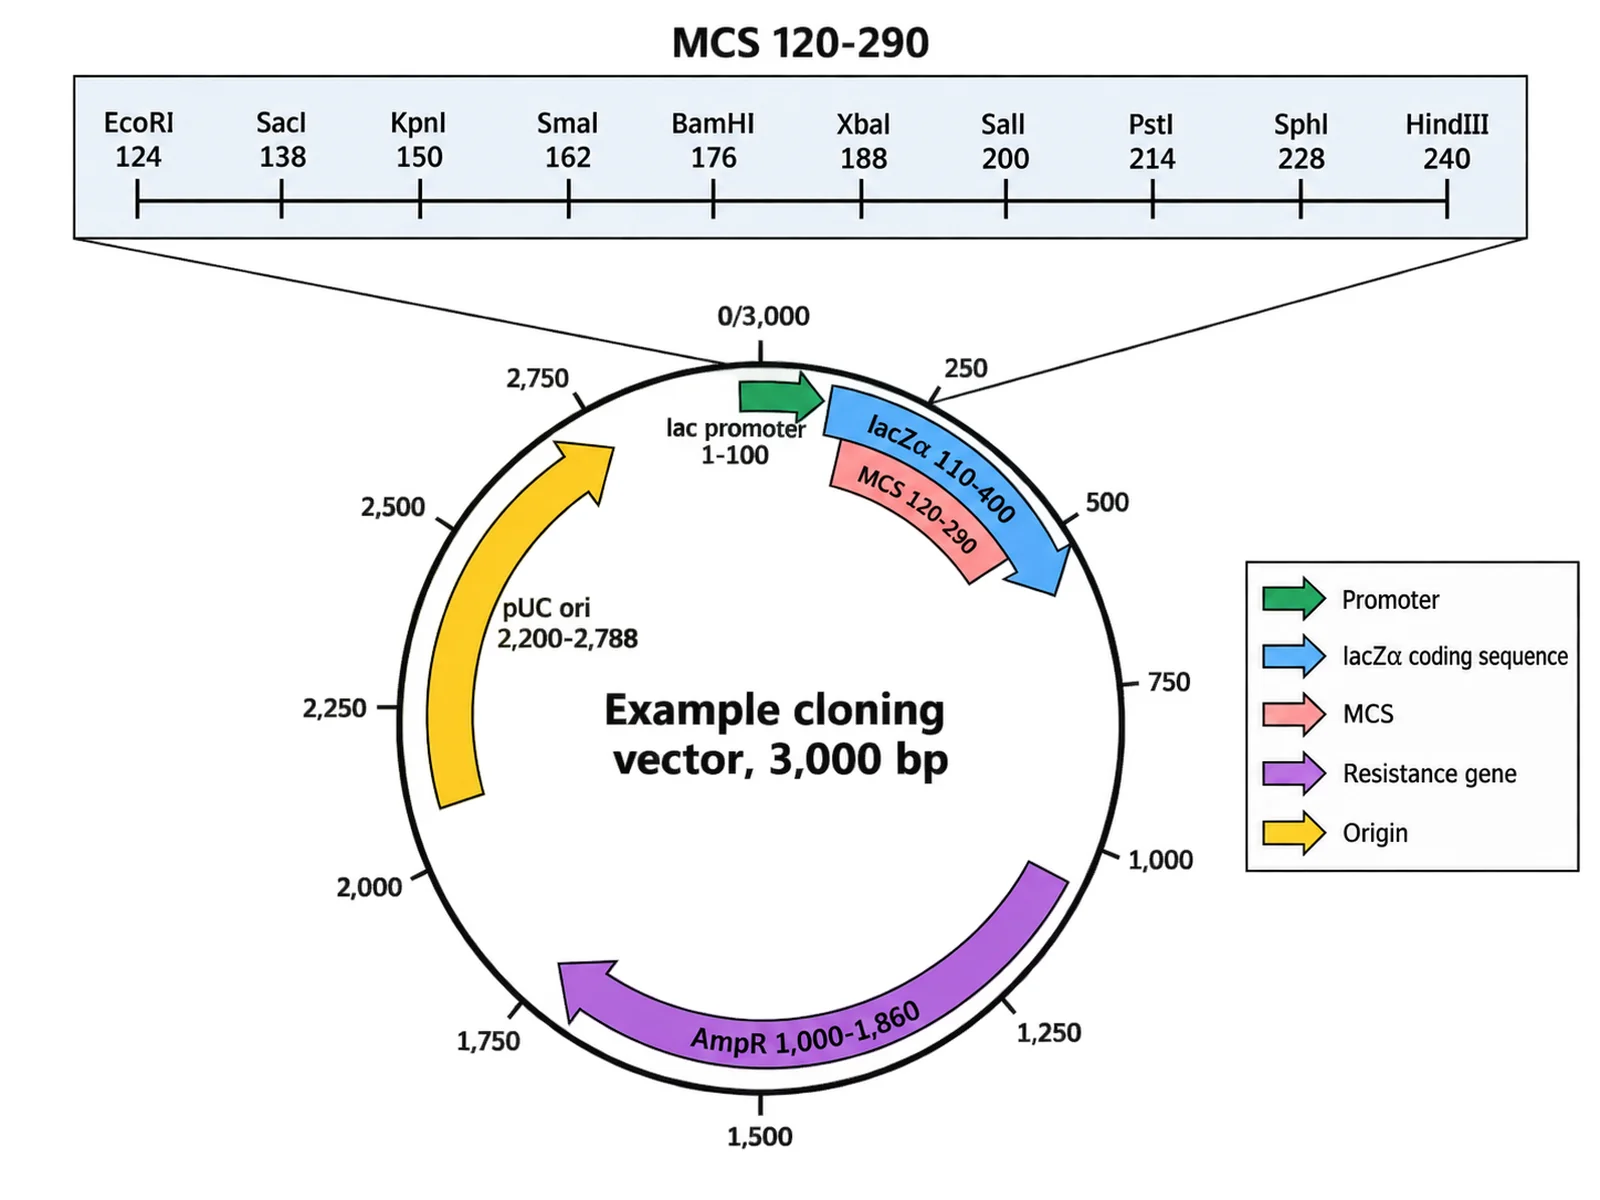
Create a labeled circular plasmid map for an example pUC-style cloning vector, total size 3,000 bp, on a white background. Draw bp scale ticks every 250 bp with a 0/3,000 marker at the top. Place these features as colored arrows with name and bp range labels: lac promoter 1-100, lacZα 110-400 with the MCS 120-290 nested inside it, AmpR 1,000-1,860, pUC ori 2,200-2,788. Add a magnified straight-line callout of the MCS above the circle showing single cutters in order with their positions: EcoRI 124, SacI 138, KpnI 150, SmaI 162, BamHI 176, XbaI 188, SalI 200, PstI 214, SphI 228, HindIII 240. Color by feature type and add a legend.
Cloning Vector with Restriction Sites
How to make a plasmid map
1
Write down the total size
Start with the full length of the construct in bp. Every coordinate you give has to fall inside it, and the number belongs in the center of the finished map.
2
List features with coordinates
Give each element a name, a start and end position, and a direction, for example CMV promoter 1-589 clockwise. Note anything nested on purpose, such as an MCS inside lacZ alpha.
3
Generate and proofread
Generate the map, then check each arrow against your list for position, direction, and spelling, and confirm the sequence itself in a sequence tool before publication.
Plasmid map conventions
Promoter arrows show direction. A promoter is drawn as an arrow or bent flag pointing the way transcription runs, and every coding feature downstream should point the same way.
Resistance genes mark selection. AmpR, KanR, PuroR, and NeoR are usually given their own strong color so a reader can see the selection scheme immediately.
The origin of replication sets copy number and host range. pUC and pBR322 origins are bacterial, while SV40 ori supports replication in permissive mammalian cells.
The MCS holds the cloning sites. Draw the multiple cloning site as a short segment and, when the sites matter, expand it into a straight-line callout listing single cutters in order with their bp positions.
bp scale ticks anchor the figure. Ticks at a regular interval with a 0 marker let a reader convert any arrow back into a coordinate.
Color by feature type, not by whim. Keep one color per category across every map in a paper, and add a small legend.
Keep the coordinates internally consistent
Most errors in a generated map are arithmetic, not artistic. Before you generate, check that every coordinate is smaller than the total size, that features do not overlap unless the overlap is real, and that the lengths are plausible: a fluorescent protein coding sequence is roughly 700 bp, a typical antibiotic resistance cassette runs 800 to 900 bp, and SpCas9 is about 4.1 kb.
Say which overlaps are deliberate. An MCS nested inside lacZ alpha is correct and is the basis of blue-white screening, so write it as nested rather than letting the model guess. Where a feature runs counterclockwise, such as a resistance gene transcribed opposite the insert, state the direction explicitly.
Label these as example constructs. The maps here are generic, plausible layouts, not the exact map of any named commercial plasmid, and they should be described that way in a figure legend.
Common mistakes to avoid
Coordinates that exceed the stated total size, or a ring whose ticks do not add up to it.
Promoter and coding sequence arrows that point in opposite directions with no reason given.
A missing origin of replication or selection marker, which leaves the construct unable to replicate or be selected.
Restriction sites shown in the callout in a different order from their bp positions on the ring.
Feature names misspelled by the image model, such as a mangled AmpR or a duplicated label; proofread every word.
Use sequence tools for the real map
A generated plasmid map is a figure, not a record of your construct. The authoritative map comes from your sequence, rendered in a sequence tool, and several options cost nothing.
SnapGene Viewer is free and lets you view plasmid maps and sequence trace files, annotate features, and share sequences, while the full SnapGene is sold as a subscription or permanent license with a free trial. Benchling offers an academic plan free of charge whose free tier includes Notebook and Molecular Biology for sequence design and cloning work. The Addgene Sequence Analyzer is free and analyzes a pasted DNA sequence to show restriction sites and a map.
A practical workflow is to confirm the construct in one of those tools, then use this page to produce the clean schematic figure that goes into the manuscript or the talk. Last checked: September 15, 2026. Sources: https://www.snapgene.com/snapgene-viewer , https://www.snapgene.com/pricing , https://www.benchling.com/academic , and https://www.addgene.org/analyze-sequence/
Plasmid Map Maker FAQ
It is a tool that turns a written description of a vector into a labeled circular plasmid map figure. You list the features, their bp coordinates, and the total size, and it draws the ring, the feature arrows, and the labels for a paper, poster, or slide.