Volcano Plot Generator for Scientific Data

Create publication-ready volcano plots from differential-expression results.

Upload fold-change and adjusted p-value data, describe thresholds and labels, then generate a clean AI-made volcano plot with manuscript-ready PNG output.

Differential-expression readyThresholds & feature labelsPublication-ready PNG

AI Volcano Plot Generator

Upload data and describe the AI chart you need.

Aspect ratio
328 / 2000 characters

Costs 5 credits. Uses your uploaded data and prompt to generate a publication-ready PNG.

Preview

Volcano Plot Example Previews

Aspect ratio: 16:9

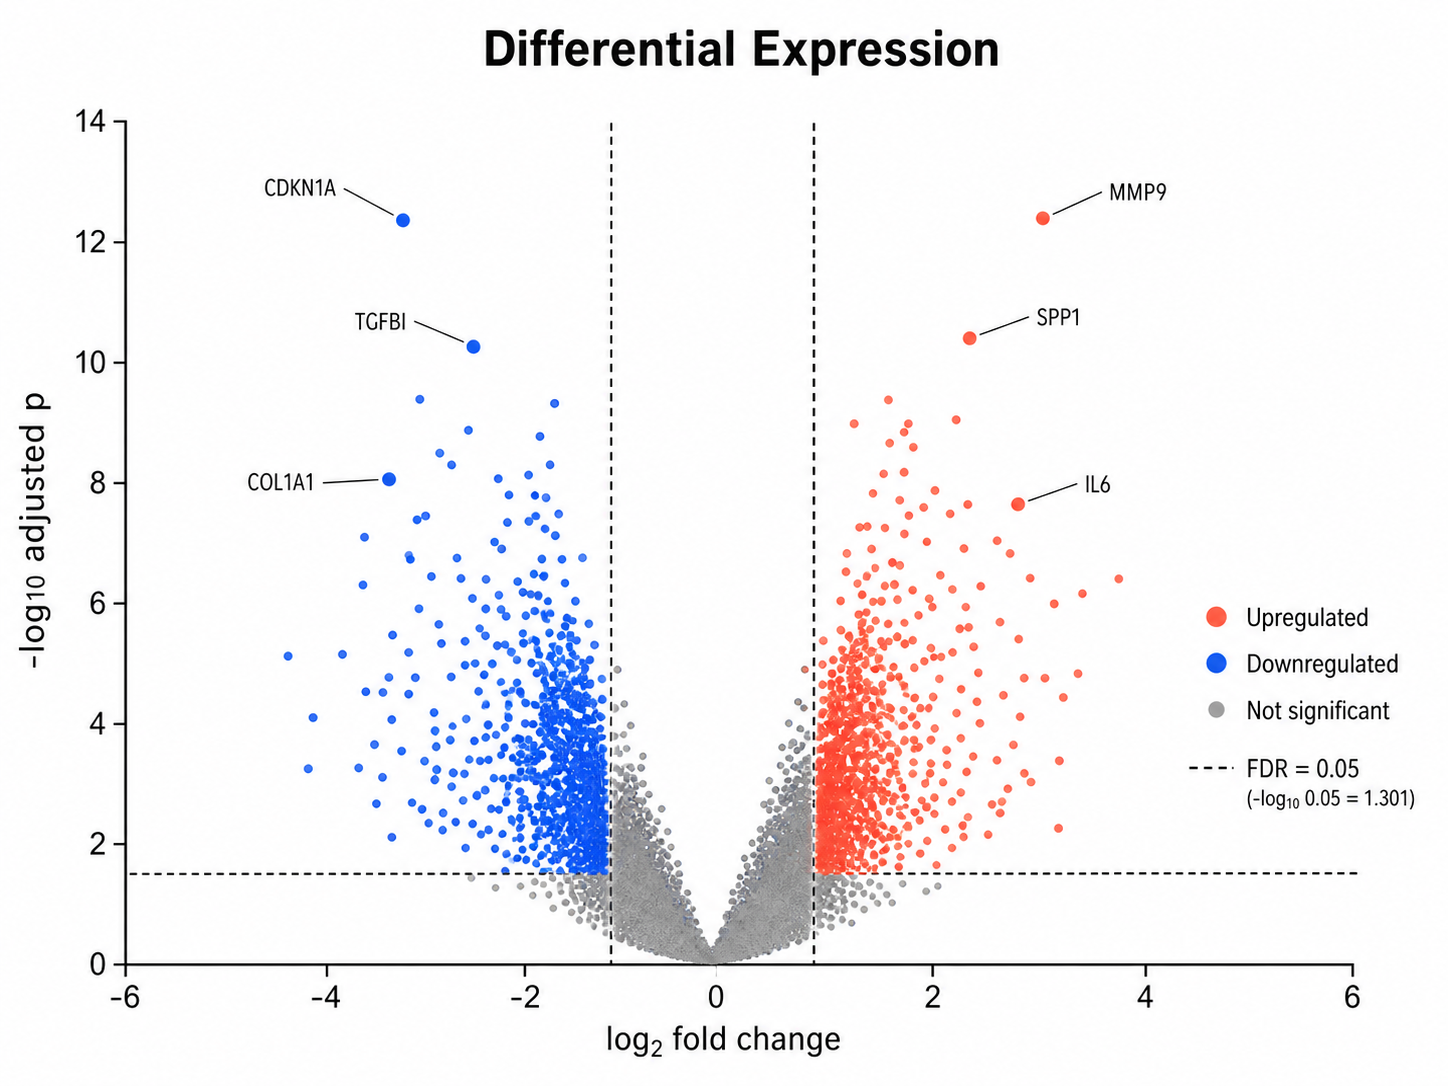
Differential Expression volcano plot example preview
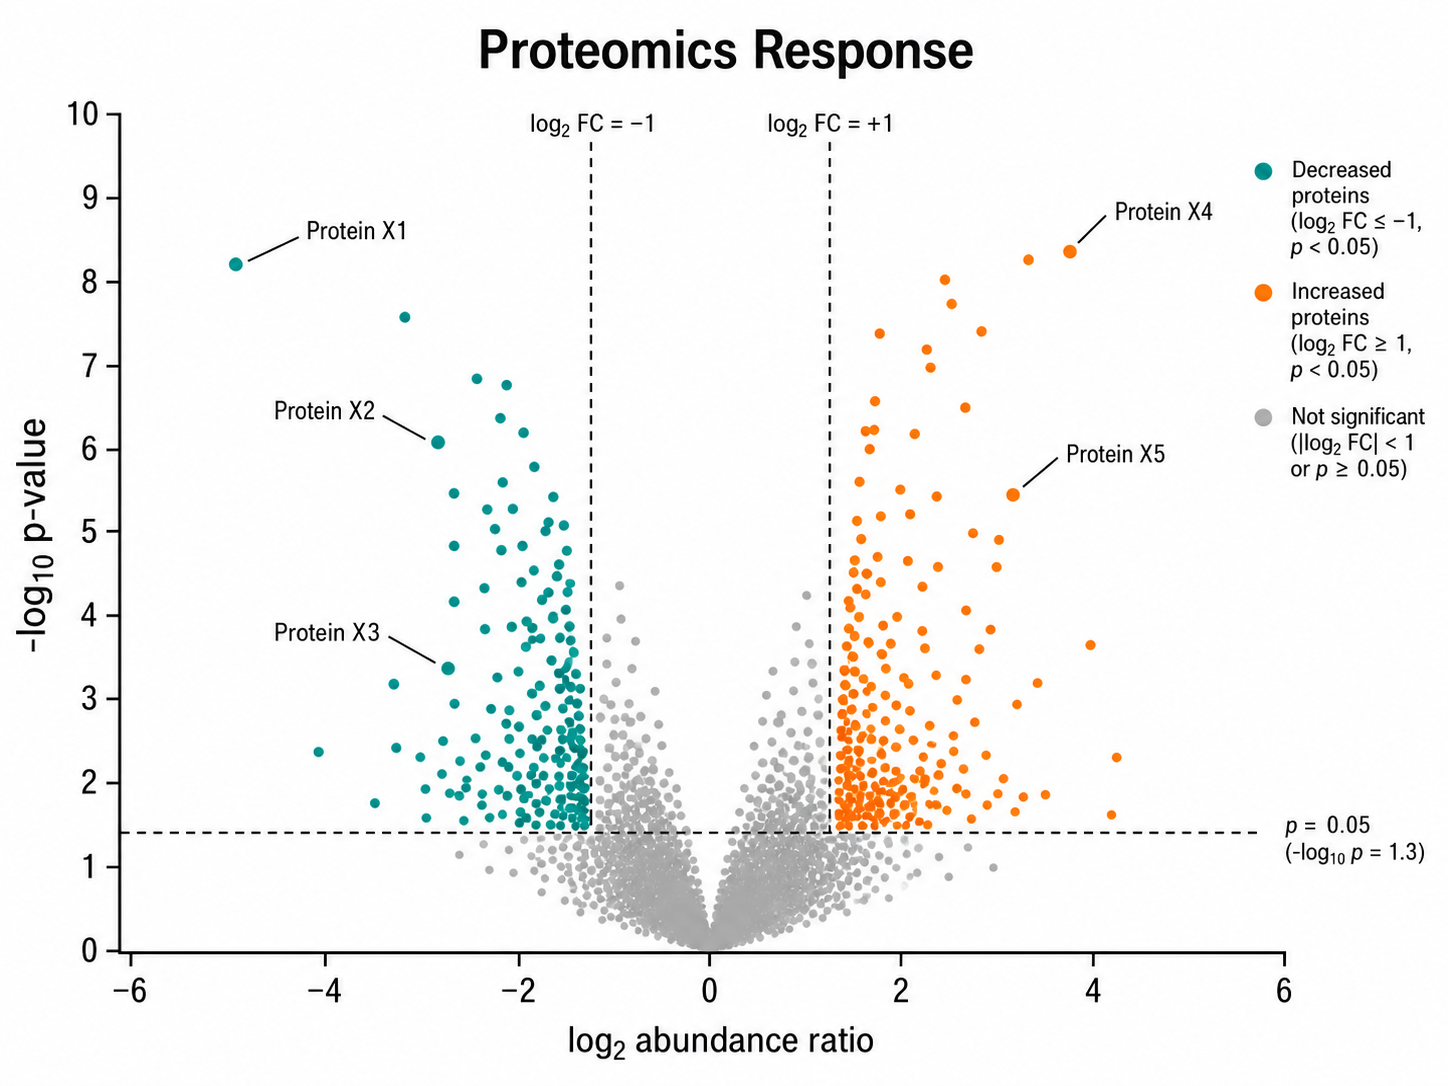
Proteomics Response volcano plot example preview
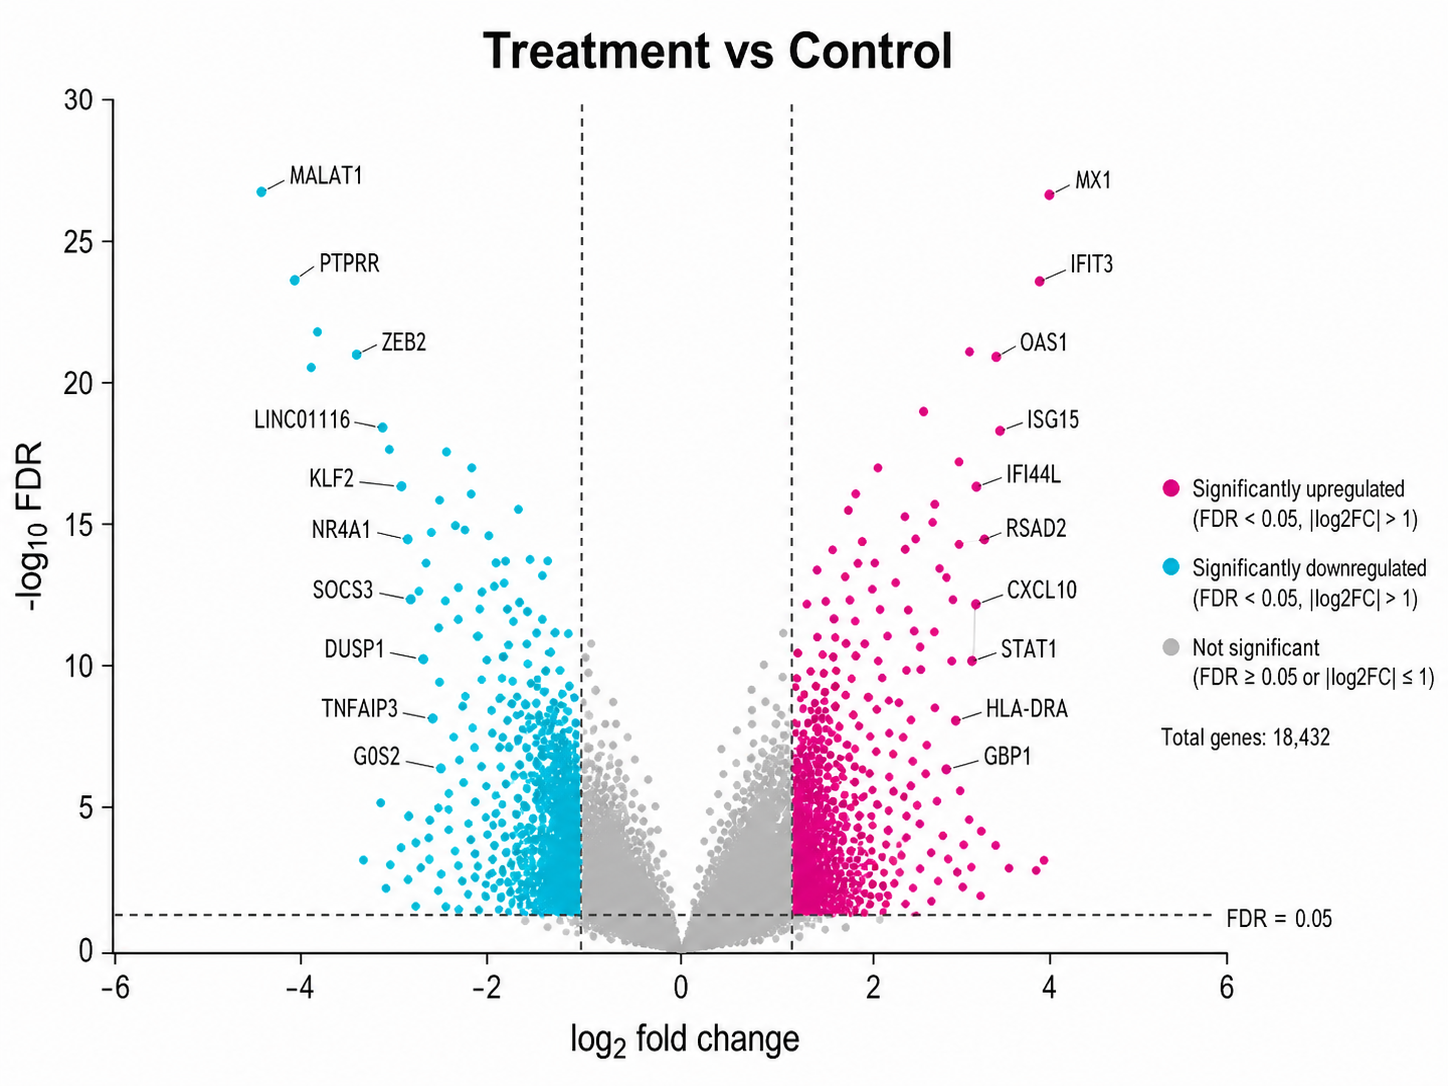
RNA-Seq Treatment volcano plot example preview

These are sample previews. Upload your dataset to generate your own volcano plot.

Volcano plot examples

Use these examples as visual directions for RNA-seq, proteomics, biomarker screens, threshold views, and manuscript-ready volcano plots.

Volcano Plot Generator: Differential Expression scientific chart example

Prompt

Based on the uploaded rna_seq_differential_expression.csv file, create a publication-ready volcano plot for RNA-seq differential expression. Use log2 fold change on the x-axis, adjusted significance on the y-axis, dashed threshold guides, red upregulated hits, blue downregulated hits, light gray nonsignificant points, and concise labels for the strongest genes.
Differential Expression

Volcano Plot Generator: Proteomics Response scientific chart example

Prompt

Based on the uploaded proteomics_abundance_response.xlsx file, create a volcano plot showing protein abundance changes after treatment. Plot log2 fold change against adjusted p-value significance, highlight increased and decreased proteins with distinct colors, label only high-confidence proteins, and keep the white-background scientific style clean.

Proteomics Response

Volcano Plot Generator: RNA-Seq Treatment scientific chart example

Prompt

Based on the uploaded treatment_control_rnaseq.tsv file, create a treatment-versus-control volcano plot. Use symmetric x-axis limits around zero, color significant positive and negative fold changes separately, keep dense nonsignificant genes subtle, add compact threshold annotations, and label selected genes from the uploaded feature column.

RNA-Seq Treatment

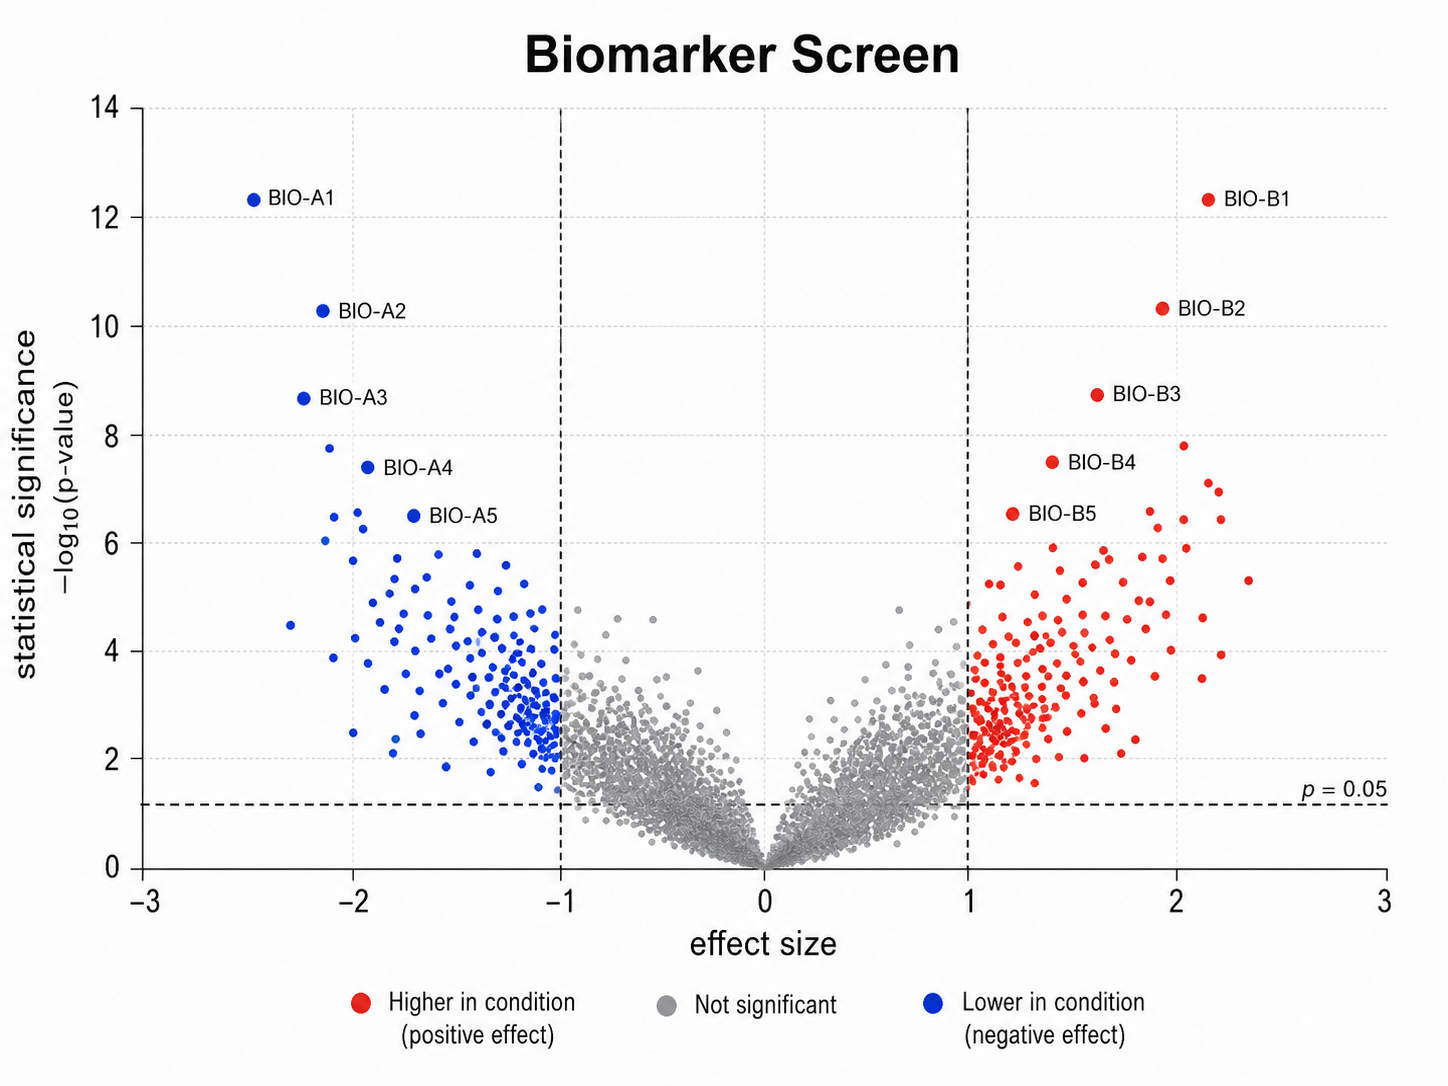
Volcano Plot Generator: Biomarker Screen scientific chart example

Prompt

Based on the uploaded biomarker_screen_results.csv file, create a volcano plot for biomarker screening results. Emphasize large-effect candidates with high adjusted significance, label the top biomarkers, use a clean legend for upregulated, downregulated, and nonsignificant groups, and avoid labeling crowded background points.

Biomarker Screen

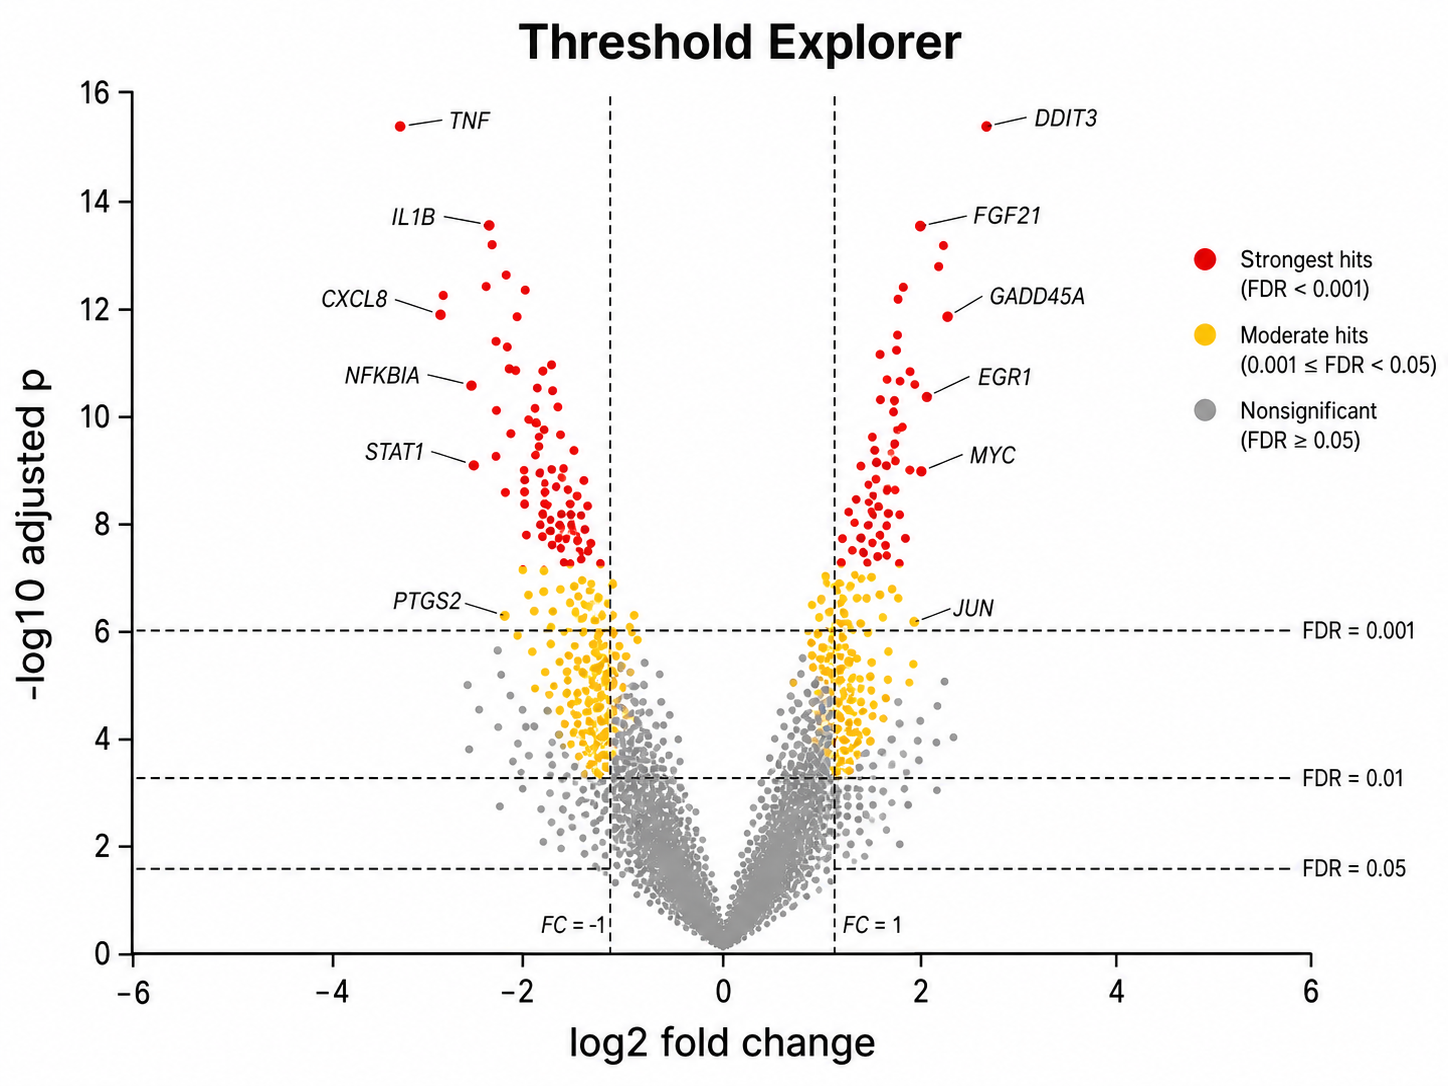
Volcano Plot Generator: Threshold Explorer scientific chart example

Prompt

Based on the uploaded multi_threshold_screen.csv file, create a volcano plot that clearly shows fold-change and FDR threshold boundaries. Add vertical and horizontal guide lines, use restrained colors for significant groups, keep nonsignificant points pale, and label only points that pass both the effect-size and significance thresholds.

Threshold Explorer

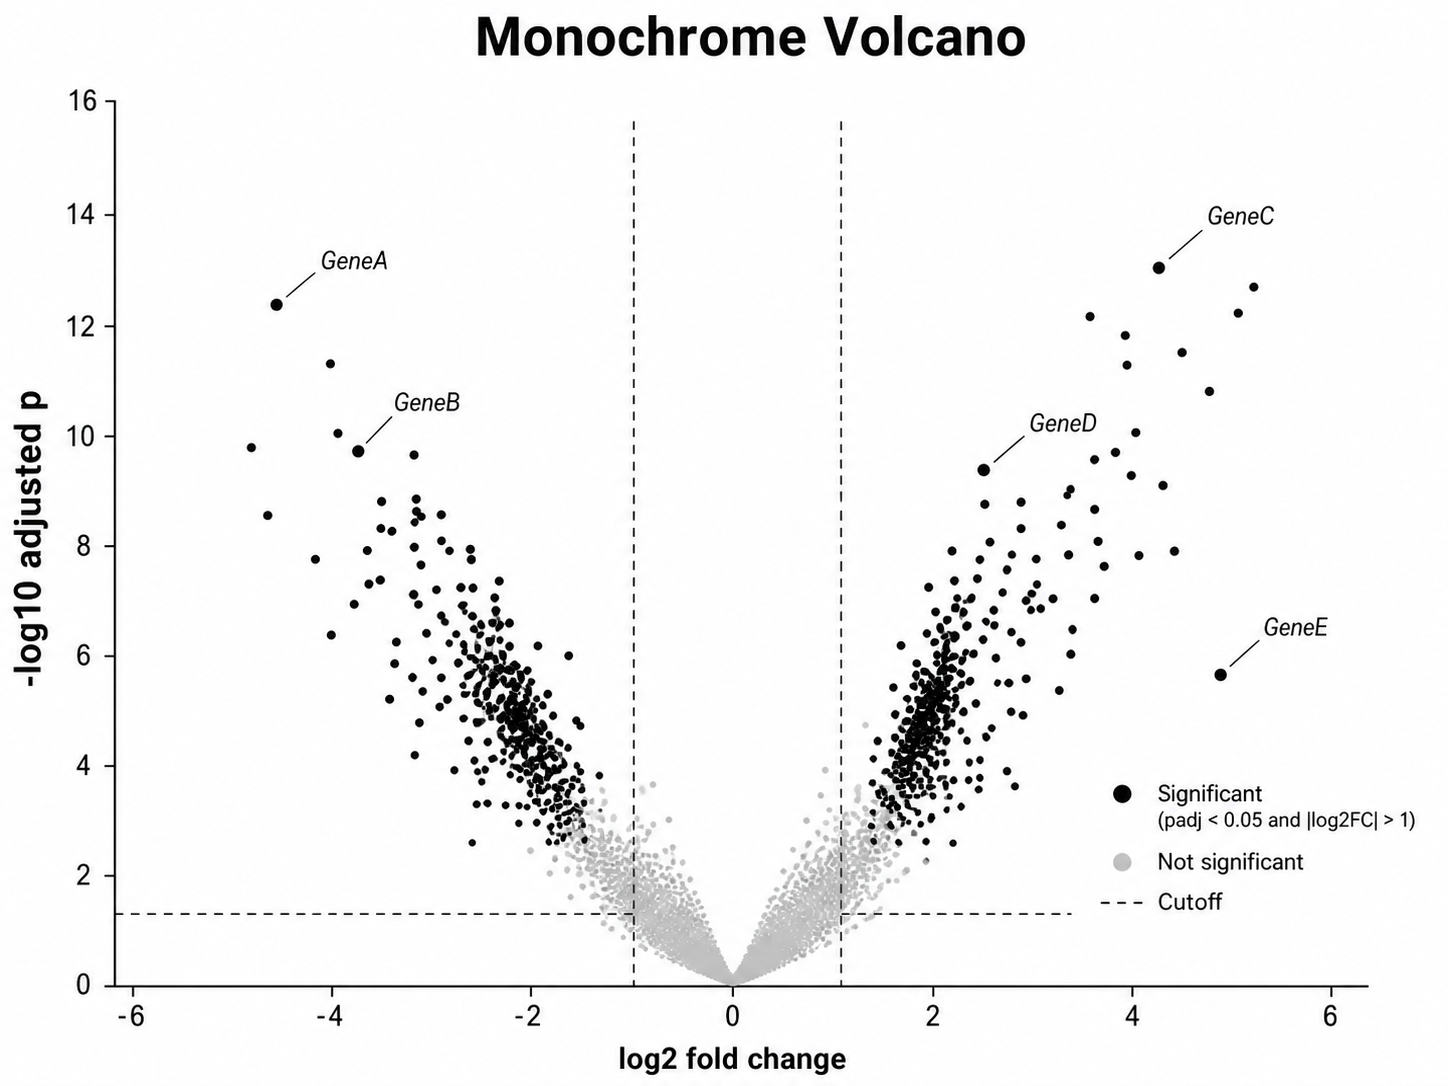
Volcano Plot Generator: Monochrome Volcano scientific chart example

Prompt

Based on the uploaded publication_volcano_hits.xlsx file, create a clean monochrome volcano plot suitable for a journal figure. Use black and gray points with a limited blue accent for selected hits, clear threshold lines, readable gene labels, balanced margins, and no decorative elements.

Monochrome Volcano

How to make a volcano plot

1

Upload your dataset

Add CSV, TSV, TXT, or Excel results with a feature label, log fold-change column, and adjusted p-value or transformed significance column.

2

Describe the chart

Tell SciFigure AI the thresholds, labels, colors, significance categories, and figure title you need.

3

Generate, review & download

Create a clean AI volcano plot, verify labels and thresholds, then download PNG for papers and slides.

What does this volcano plot generator do?

It turns differential-expression or high-throughput screening results into a clean volcano plot that combines effect size and statistical evidence in one figure. The result is designed for manuscripts, lab reports, posters, and research presentations.

Why use a volcano plot generator

  • Compare effect magnitude and adjusted significance in one readable view.
  • Highlight upregulated, downregulated, and nonsignificant features without redrawing the plot by hand.
  • Add threshold lines, feature labels, legends, and clean scientific styling from your uploaded data.
  • Move from differential-analysis tables to a polished figure faster.

Types and parts of a volcano plot

  • The x-axis usually shows log2 fold change or another signed effect size.
  • The y-axis usually shows adjusted significance, often as -log10 adjusted p-value.
  • Threshold guides separate large-effect significant features from background points.
  • Feature labels should stay sparse so the strongest or most relevant hits remain readable.

Volcano Plot Generator FAQ

What data does the volcano plot need?

Use a feature label column, a numeric effect-size column such as log2 fold change, and a numeric significance column such as adjusted p-value, FDR, q-value, or -log10 adjusted p-value.

Can I use adjusted p-values instead of -log10 values?

Yes. Map the adjusted p-value column and describe the intended y-axis. The generator can use the mapped column without double-transforming already transformed values.

Can I label selected genes or proteins?

Yes. Include a feature label column and describe which hits should be labeled, such as top FDR hits, named genes, or pathway members.

Can I control thresholds and colors?

Yes. Describe fold-change and significance thresholds, then specify the colors for upregulated, downregulated, and nonsignificant points.

Can I use the result in a paper?

Yes, but verify the uploaded values, multiple-testing method, thresholds, labels, and caption before submission.

Need clearer differential-analysis figures?

Generate volcano plots, heatmaps, scatter plots, and other research-ready visualizations with SciFigure AI.