Prompt
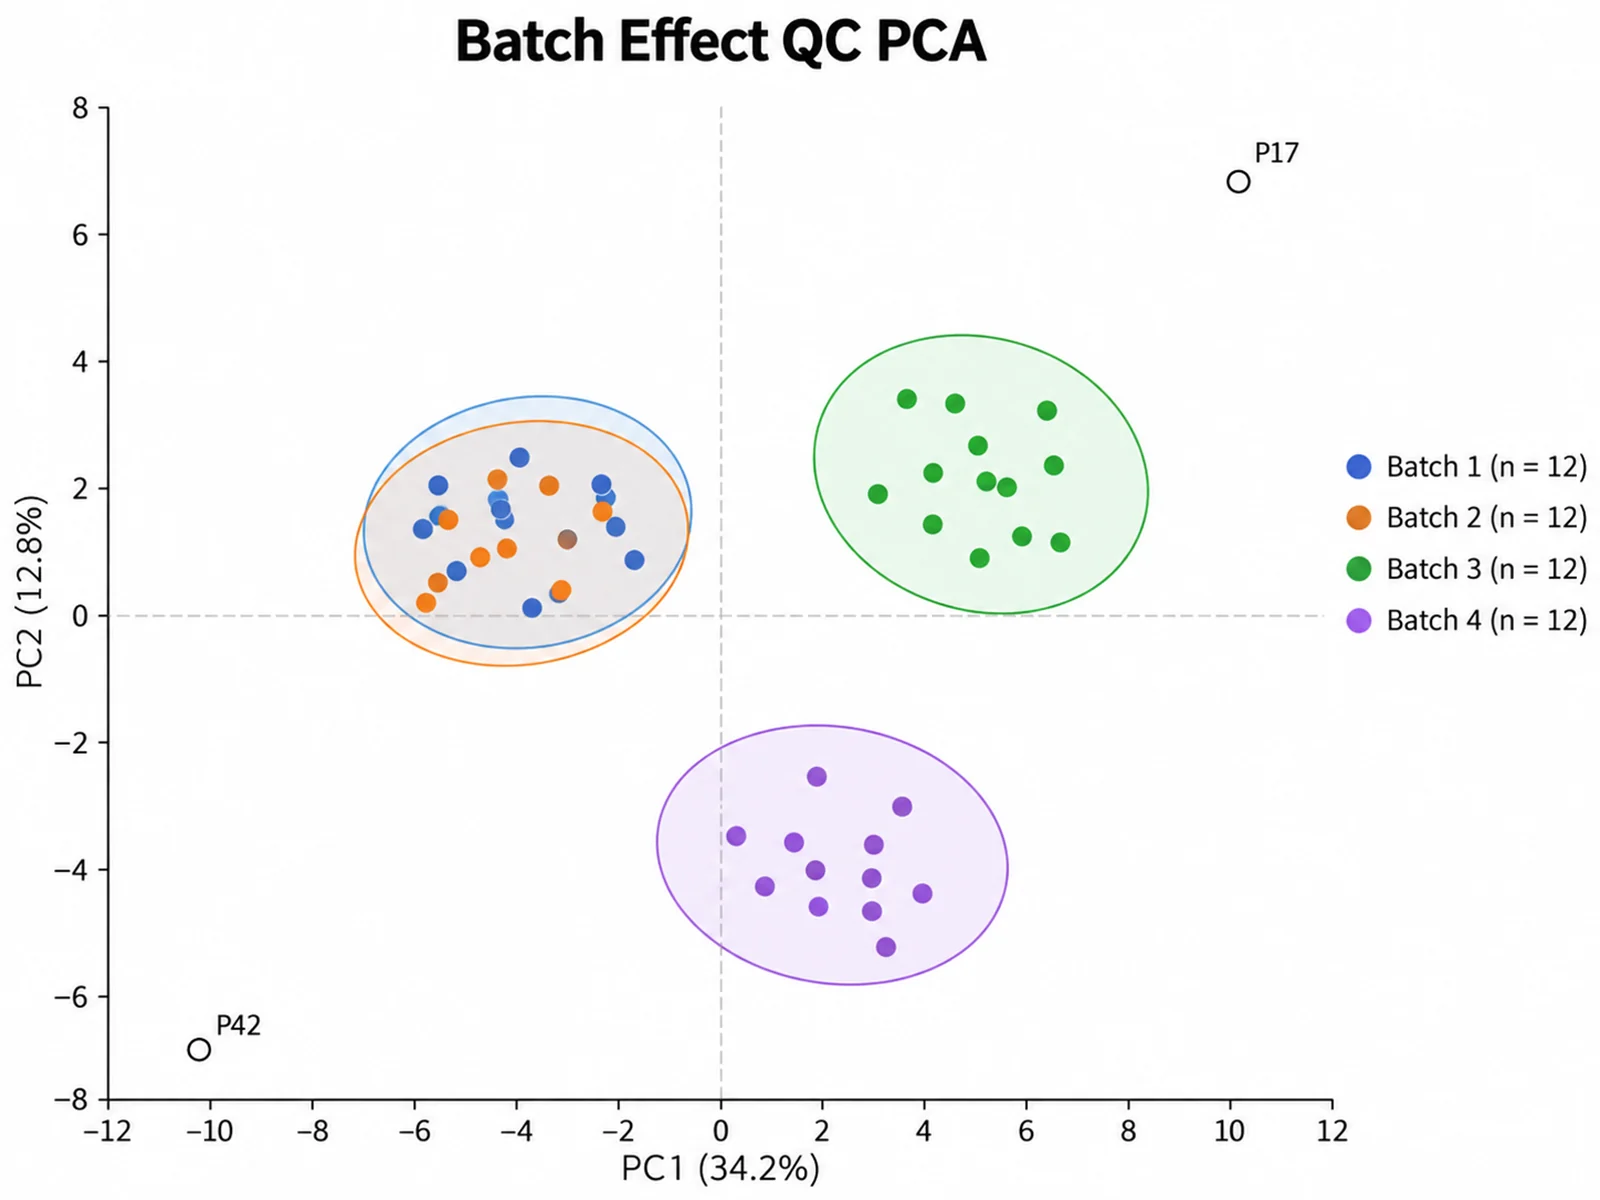
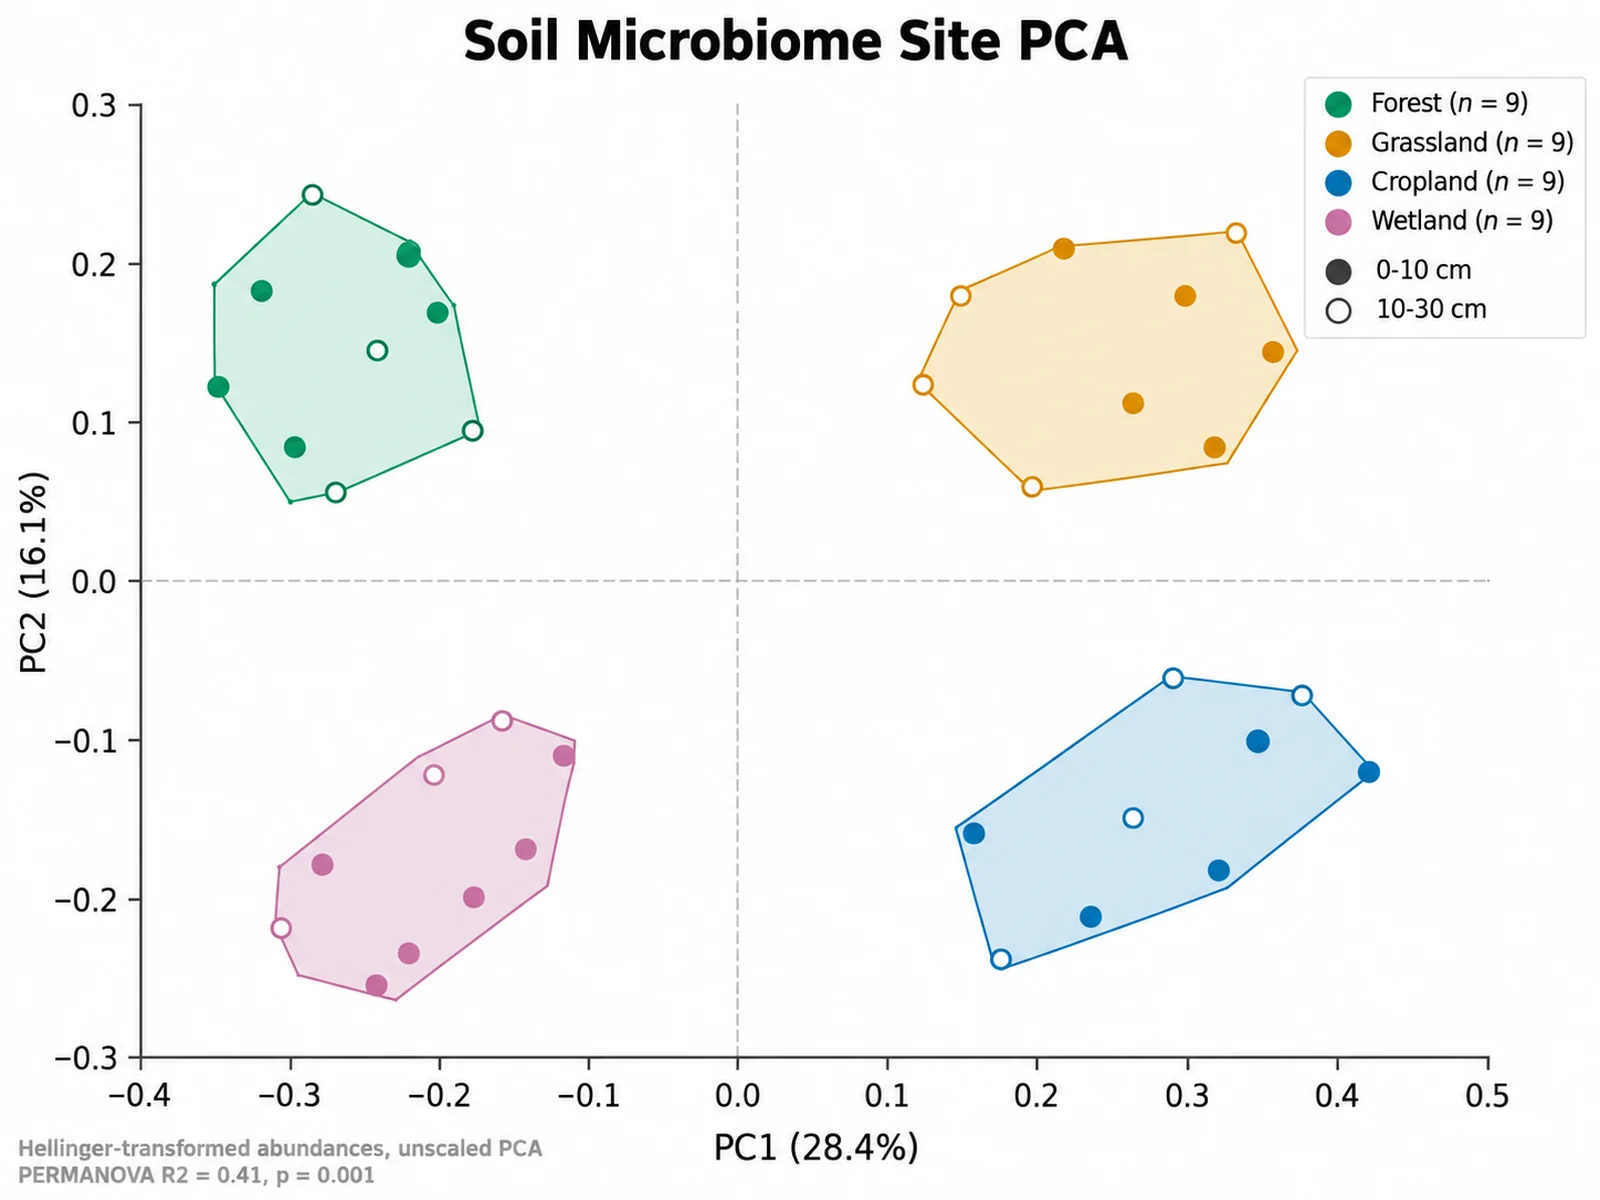
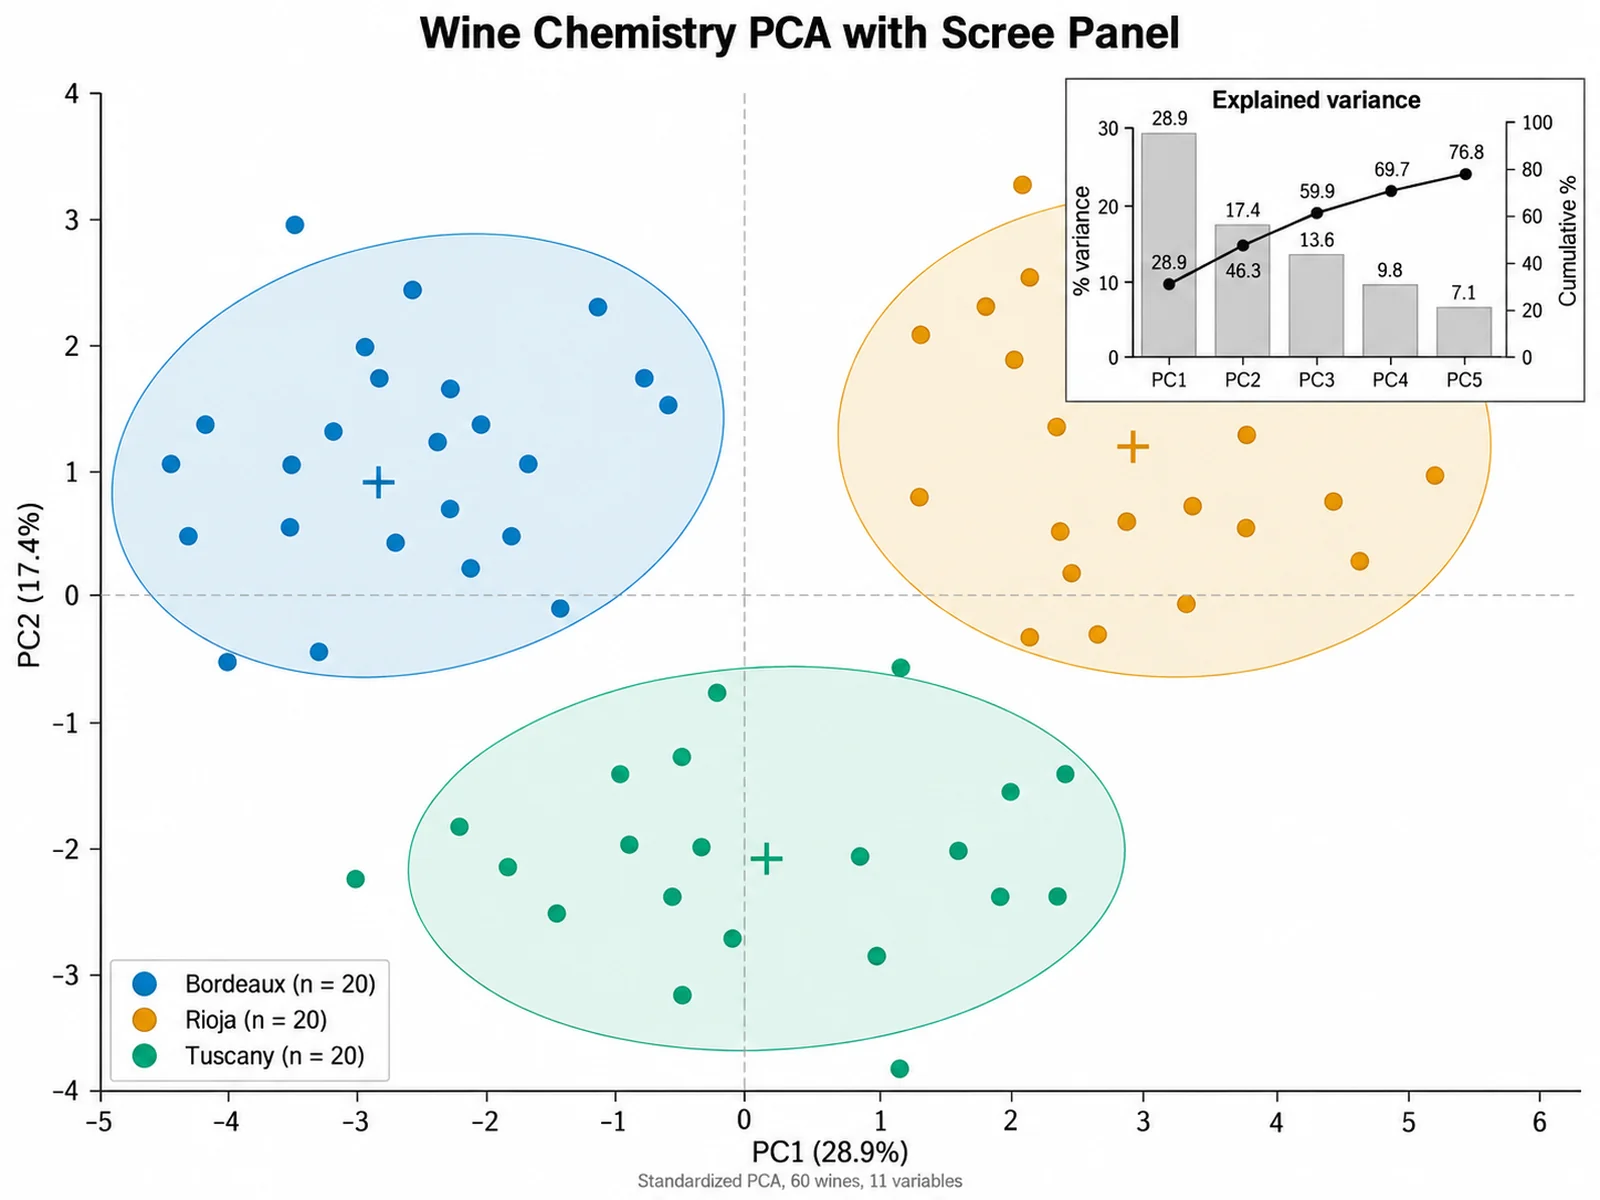
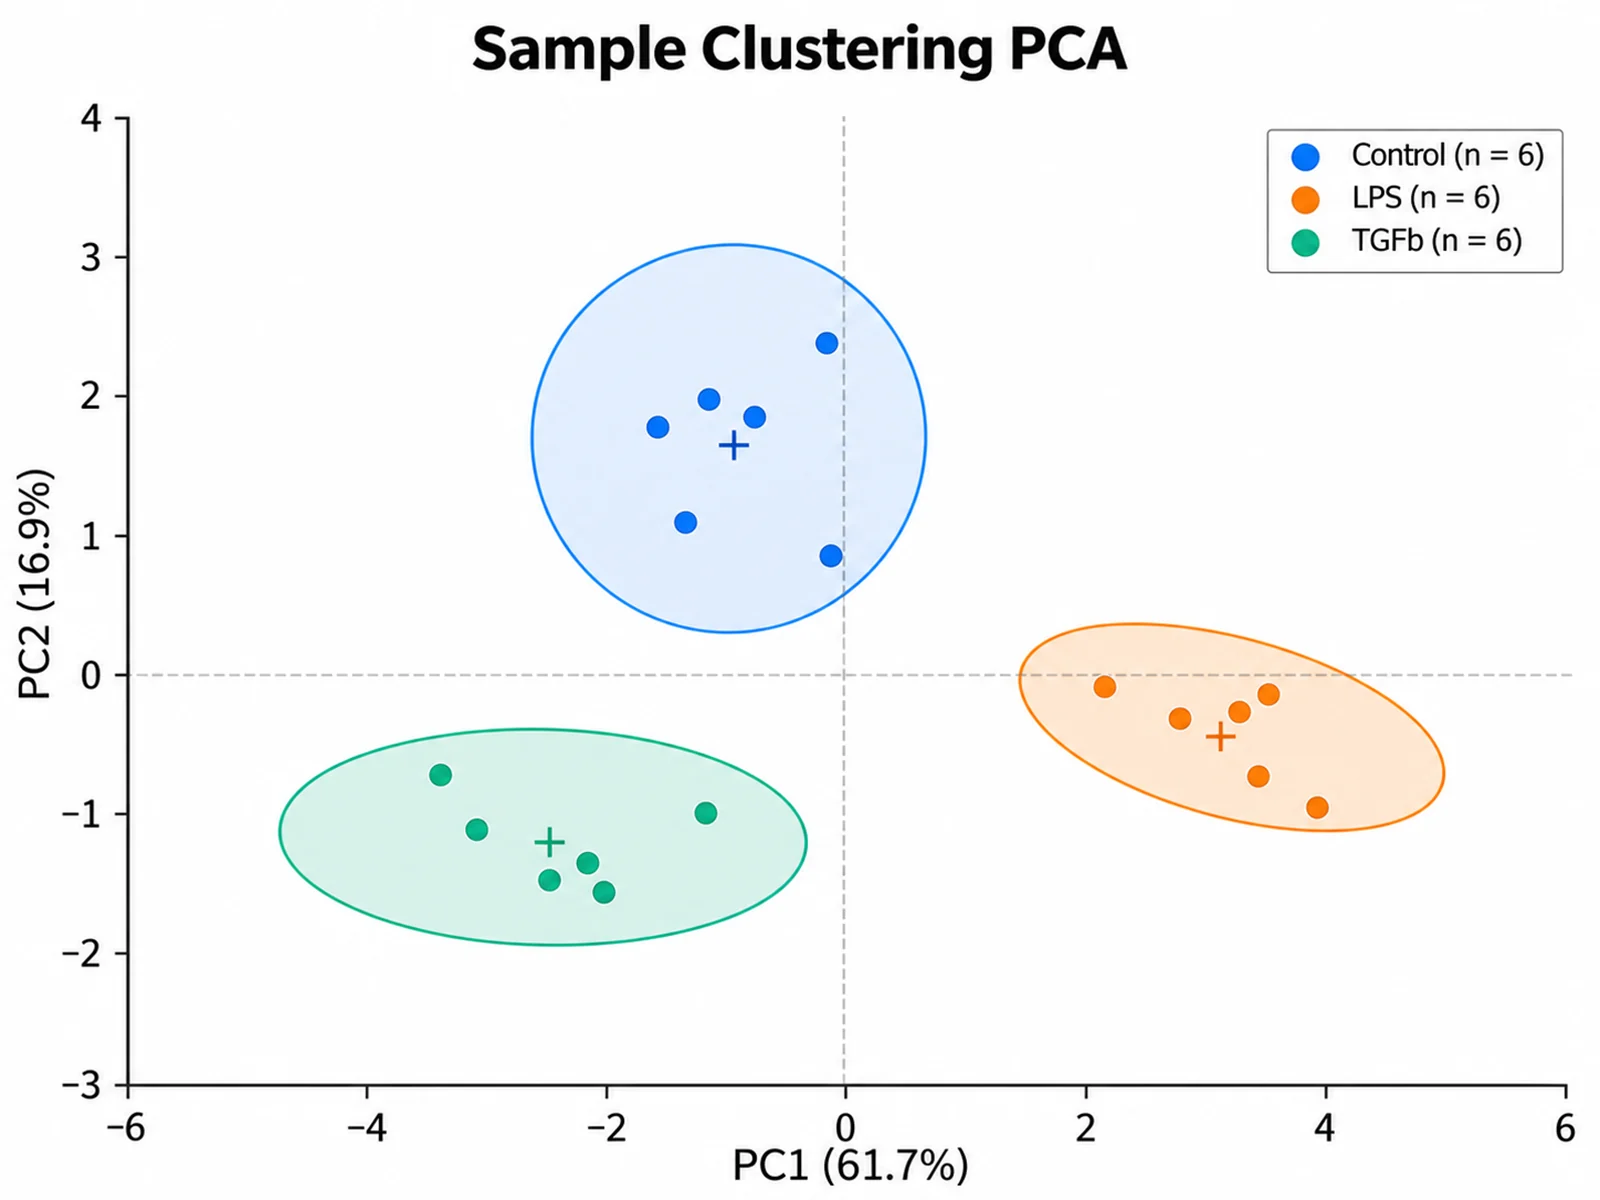
Based on the uploaded rnaseq_log2cpm.csv file, create a PCA score plot of PC1 vs PC2 for 18 samples across Control, LPS, and TGFb conditions. Standardize genes before PCA, color points by condition, draw 95% confidence ellipses, and show explained variance in the axis titles.