
Tool comparison
GraphPad Prism alternative for publication-quality graphs online
GraphPad Prism is a full statistics and graphing package. SciFigure AI is narrower: 26 browser-based chart generators that take a CSV or Excel file, compute the statistics each chart needs, and return a publication-ready PNG. If you mainly use Prism to draw figures, this GraphPad Prism alternative may be enough; if you need t test and ANOVA menus or reproducible analysis projects, it is not.
GraphPad Prism vs SciFigure AI at a glance
Keep GraphPad Prism for
- t tests, ANOVA, and other analysis menus
- Nonlinear regression with 105 built-in equations or your own
- Projects where graphs and results update when data change
- Desktop work on Mac and Windows
Use SciFigure AI for
- A publication-ready PNG chart from CSV or Excel, in a browser
- Chart statistics such as 4PL IC50, log-rank, ROC AUC, and Bland-Altman limits
- 5 credits per chart; free signup and daily credits work
- Outputs with no watermark
Free open-source options
- JASP: frequentist and Bayesian analyses without code
- jamovi: free and open statistics package built on R
- R with ggplot2: free, code-based graphics
- Python with matplotlib: free, code-based plotting
GraphPad Prism, SciFigure AI, and free tools compared
Price
- SciFigure AI
- 5 credits per chart; plans from $15/month or $90/year
- GraphPad Prism
- Student $142/year, Academic $260/year, Corporate $520/year, or $50/month
- JASP, jamovi, R, Python
- Free
Perpetual license
GraphPad notes that perpetual licenses include no upgrades, no future support, and no group or license management features.
- SciFigure AI
- No
- GraphPad Prism
- Academic $1,600; Corporate $3,200
- JASP, jamovi, R, Python
- Not needed
Free usage
- SciFigure AI
- 10 signup credits (7 days) plus 5 bonus credits per day, usable for charts
- GraphPad Prism
- See official site
- JASP, jamovi, R, Python
- Yes
Install
- SciFigure AI
- None, runs in a browser
- GraphPad Prism
- Desktop app for Mac and Windows
- JASP, jamovi, R, Python
- Desktop apps; jamovi Cloud in a browser; R and Python run as code
Statistical test menus (t tests, ANOVA)
- SciFigure AI
- No
- GraphPad Prism
- Yes
- JASP, jamovi, R, Python
- JASP and jamovi menus; code in R and Python
Curve fitting
- SciFigure AI
- 4PL dose-response fits with IC50 or EC50
- GraphPad Prism
- 105 built-in equations or your own
- JASP, jamovi, R, Python
- Packages and code
Survival and diagnostic statistics
- SciFigure AI
- Kaplan-Meier with log-rank; ROC AUC with DeLong CI
- GraphPad Prism
- Kaplan-Meier survival analysis and Cox regression
- JASP, jamovi, R, Python
- Packages and code
Reproducible projects
- SciFigure AI
- No
- GraphPad Prism
- Yes
- JASP, jamovi, R, Python
- Scripts in R and Python; saved analysis files in jamovi
Coding required
- SciFigure AI
- No
- GraphPad Prism
- No
- JASP, jamovi, R, Python
- No for JASP and jamovi; yes for R and Python
Charts SciFigure AI computes from your data
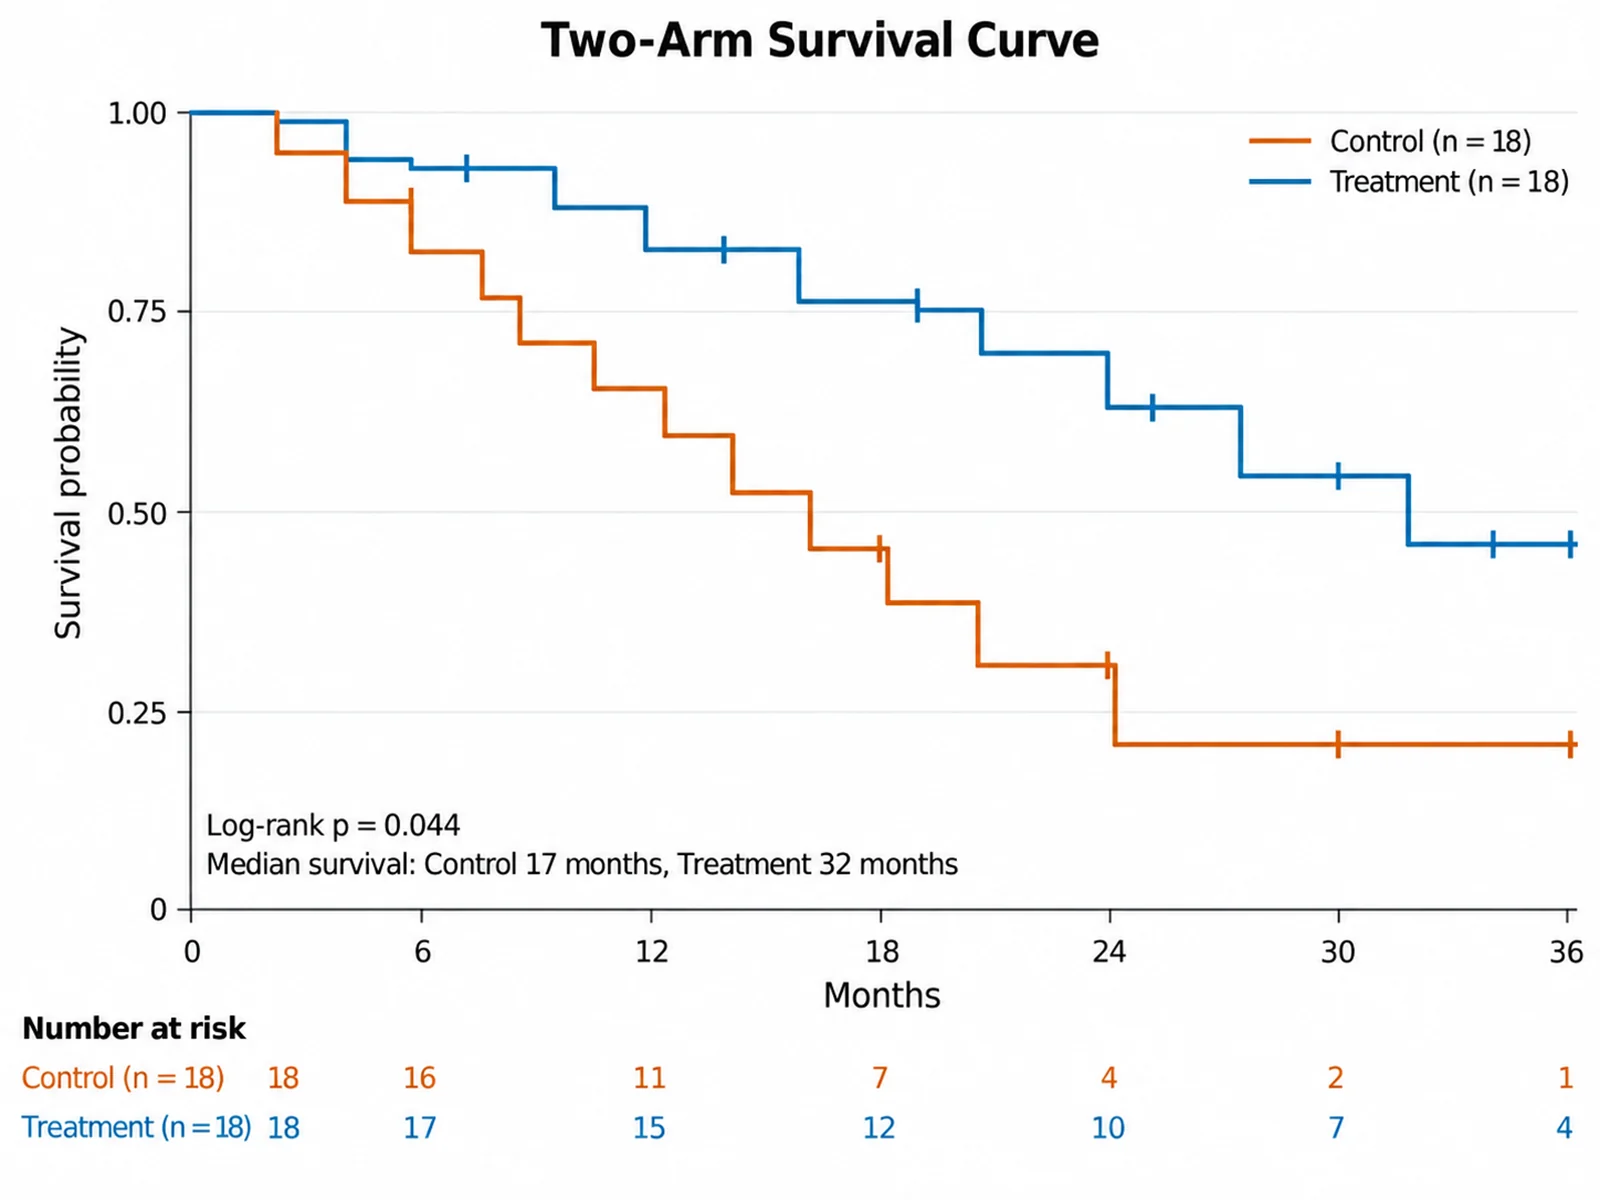
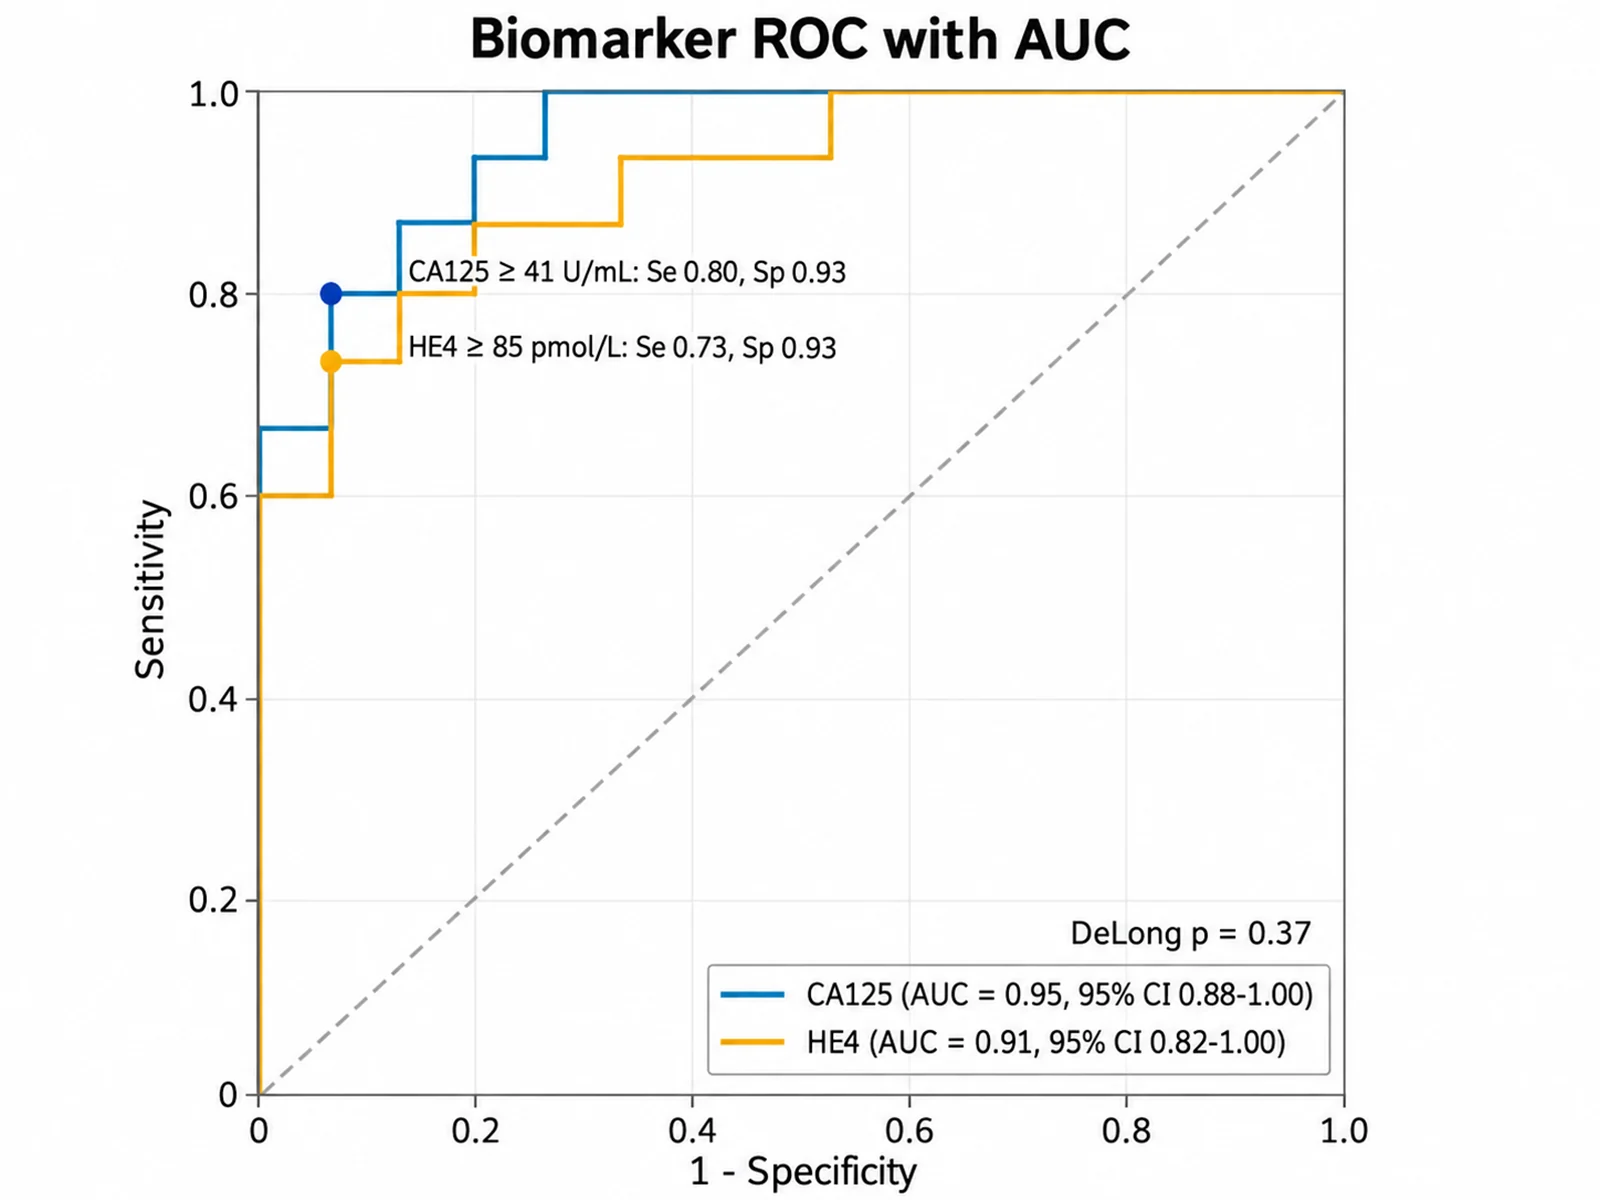
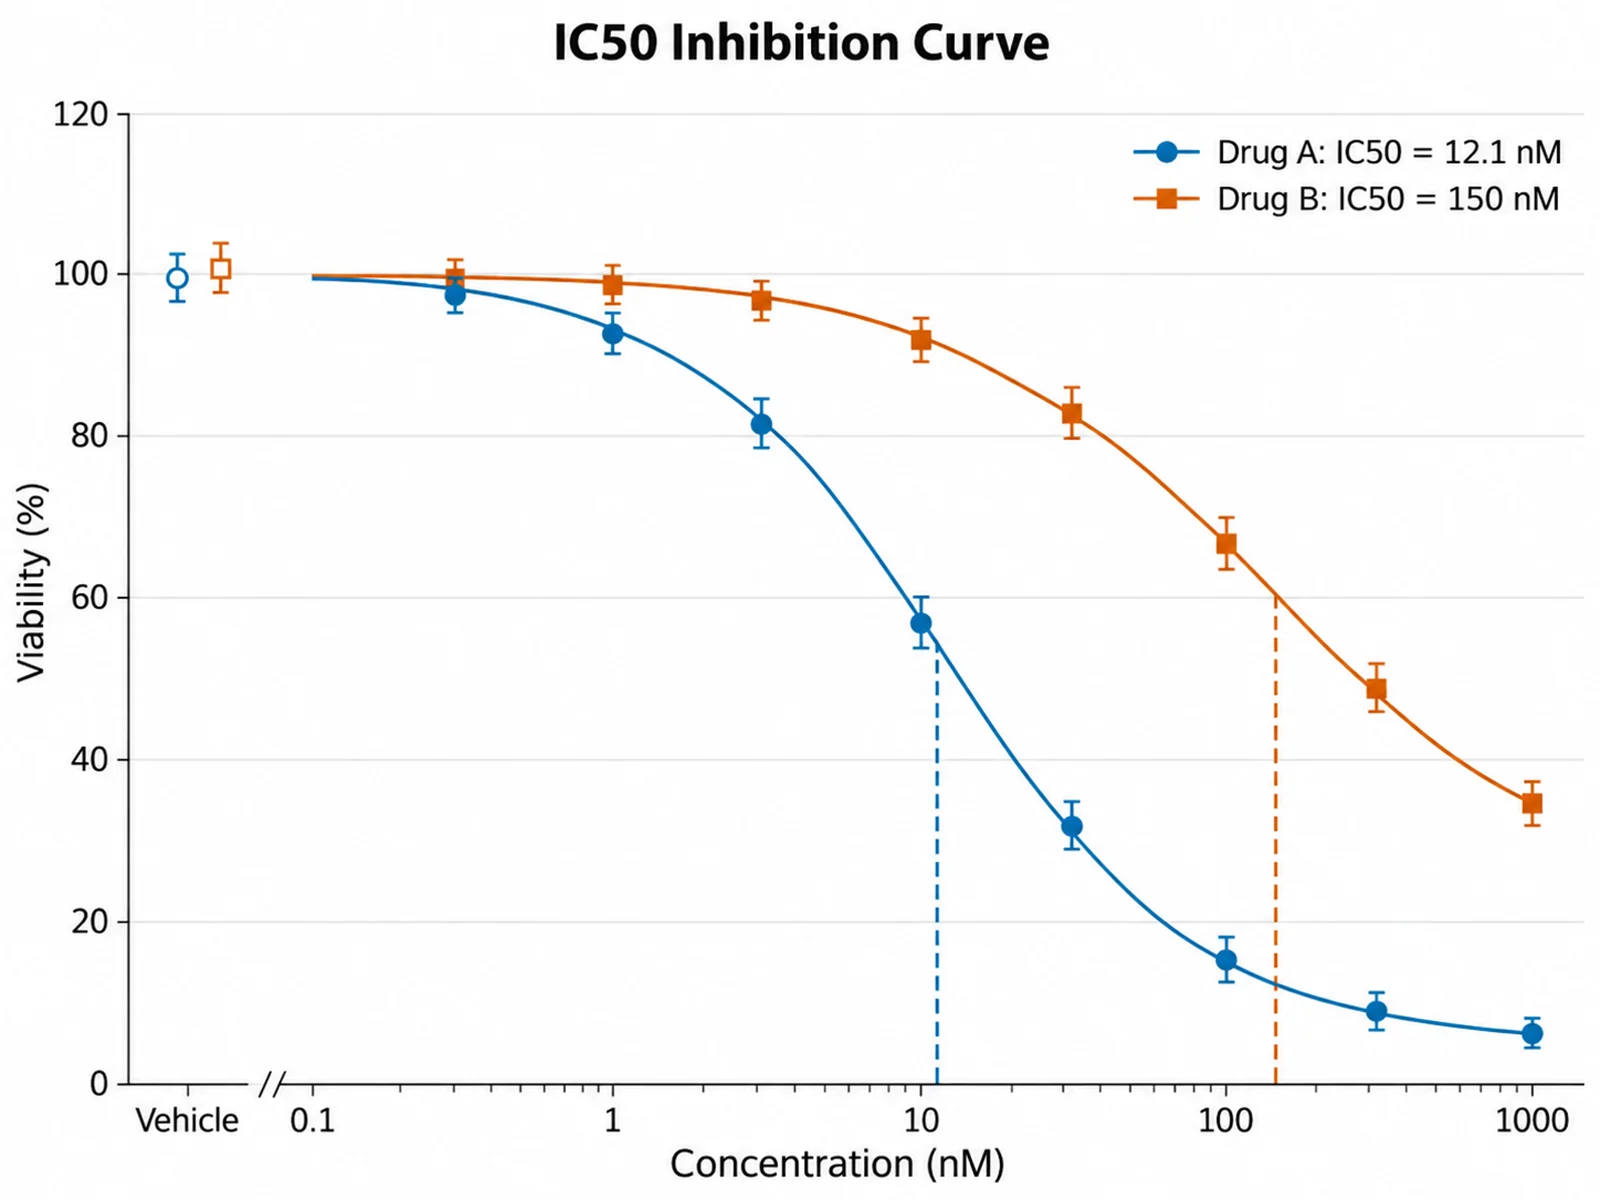
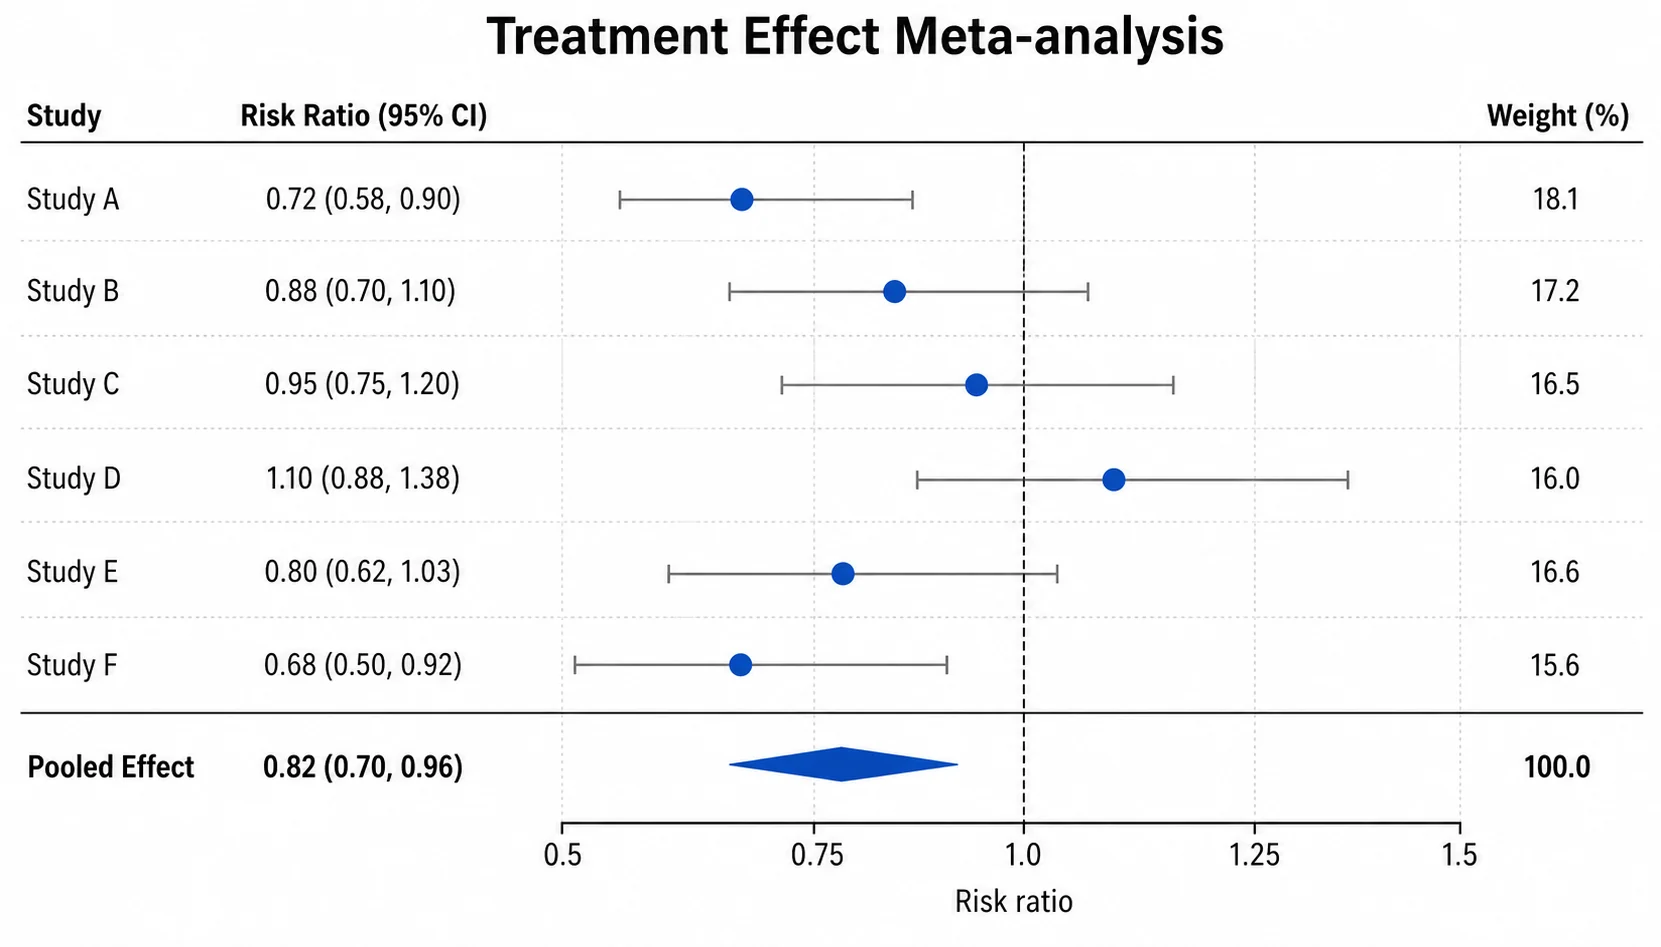
Upload a CSV or Excel file and the statistics are computed from your numbers before the figure is drawn. Each example links to its generator.
All 26 chart generators
Each page takes a CSV or Excel file and returns a publication-ready PNG for 5 credits per chart.
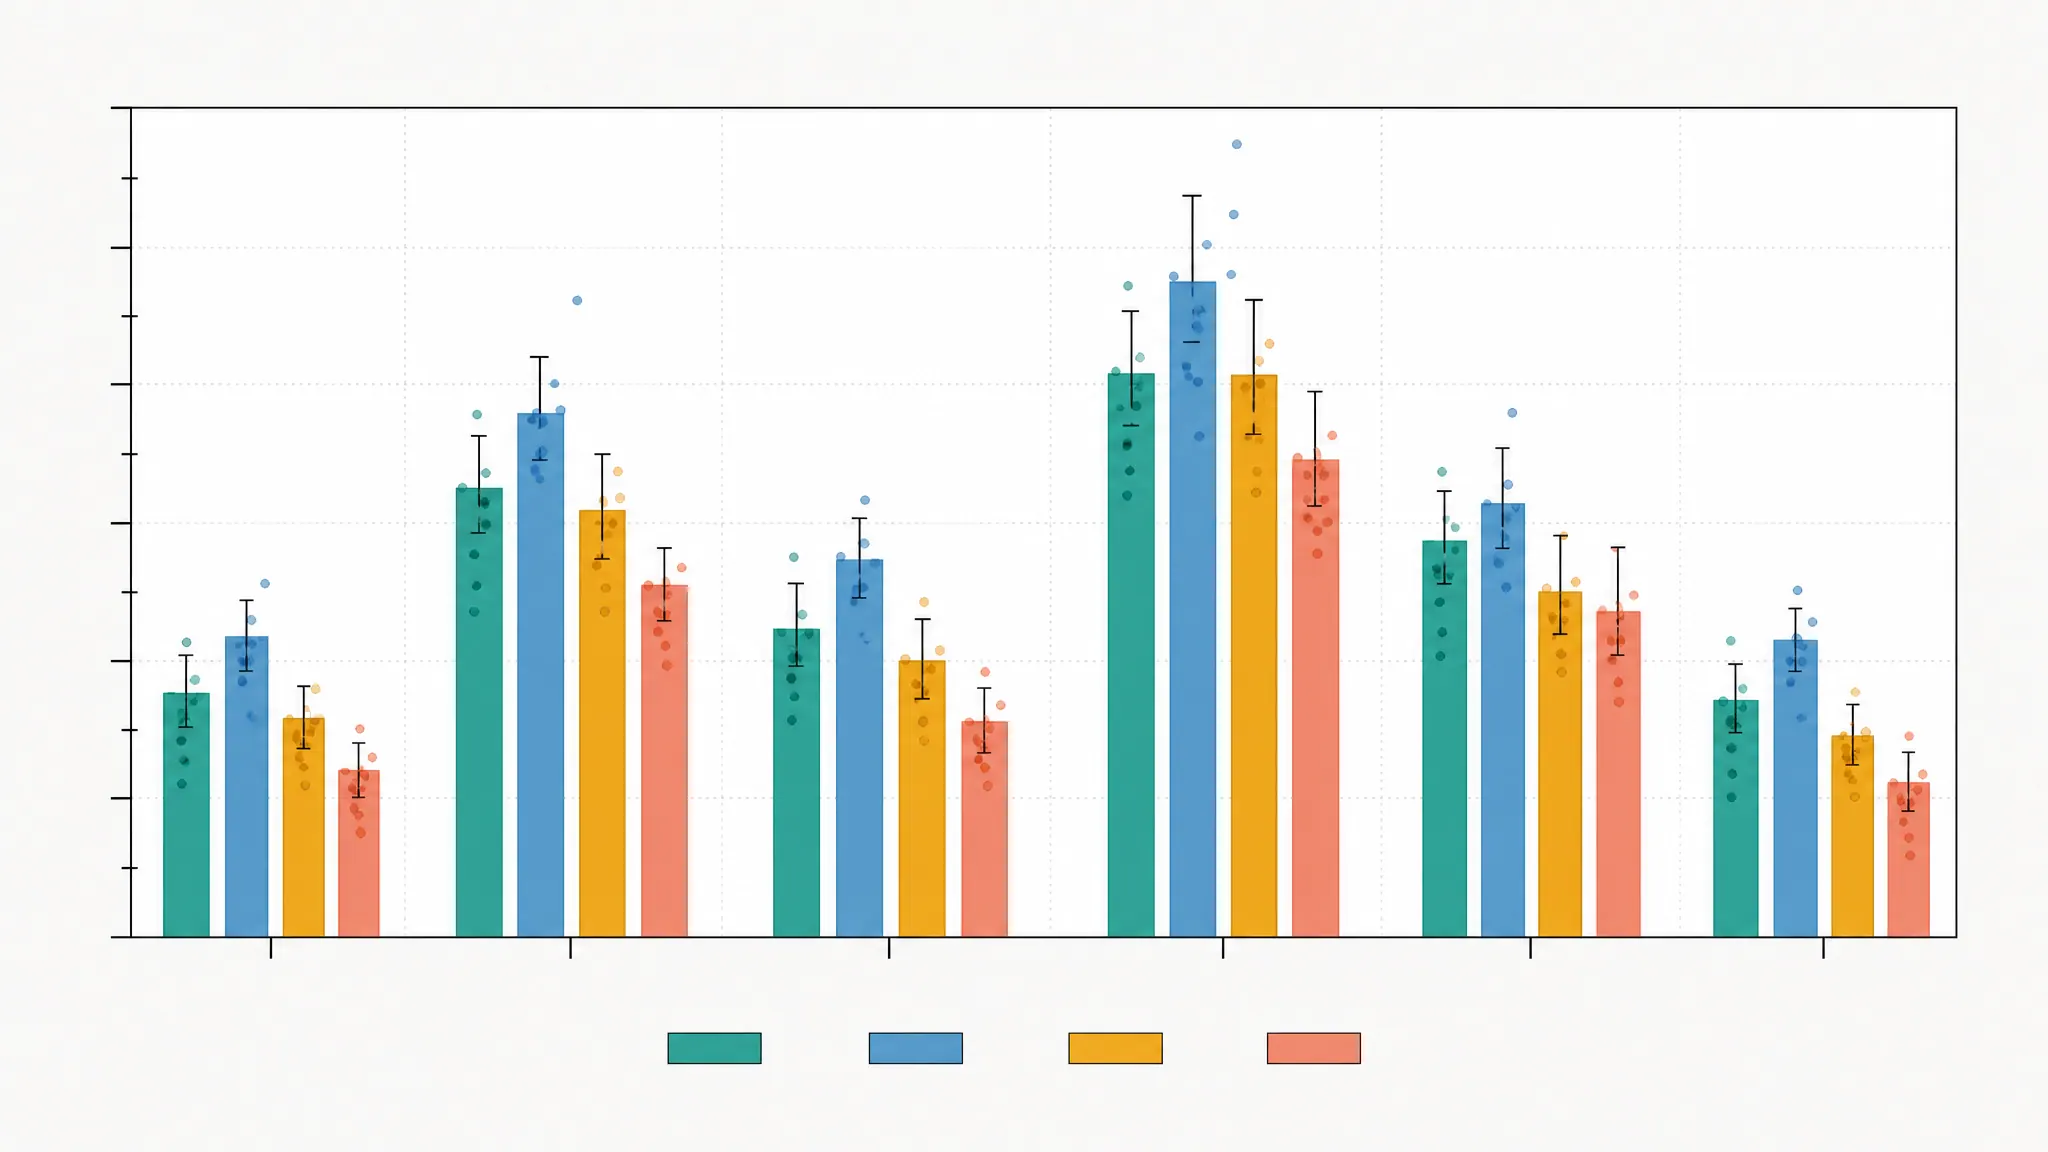
Bar Chart Generator
Grouped bars from categorical or summary data.
Box Plot Generator
Medians, quartiles, and outliers across groups.
Violin Plot Generator
Group distributions with box summaries and points.
Scatter Plot Generator
Paired numeric measurements with optional trend cues.
Regression Plot Generator
Fitted regression lines over paired data.
Error Bar Chart Generator
Group means with error bars.
Forest Plot Generator
Effect sizes with confidence intervals across studies.
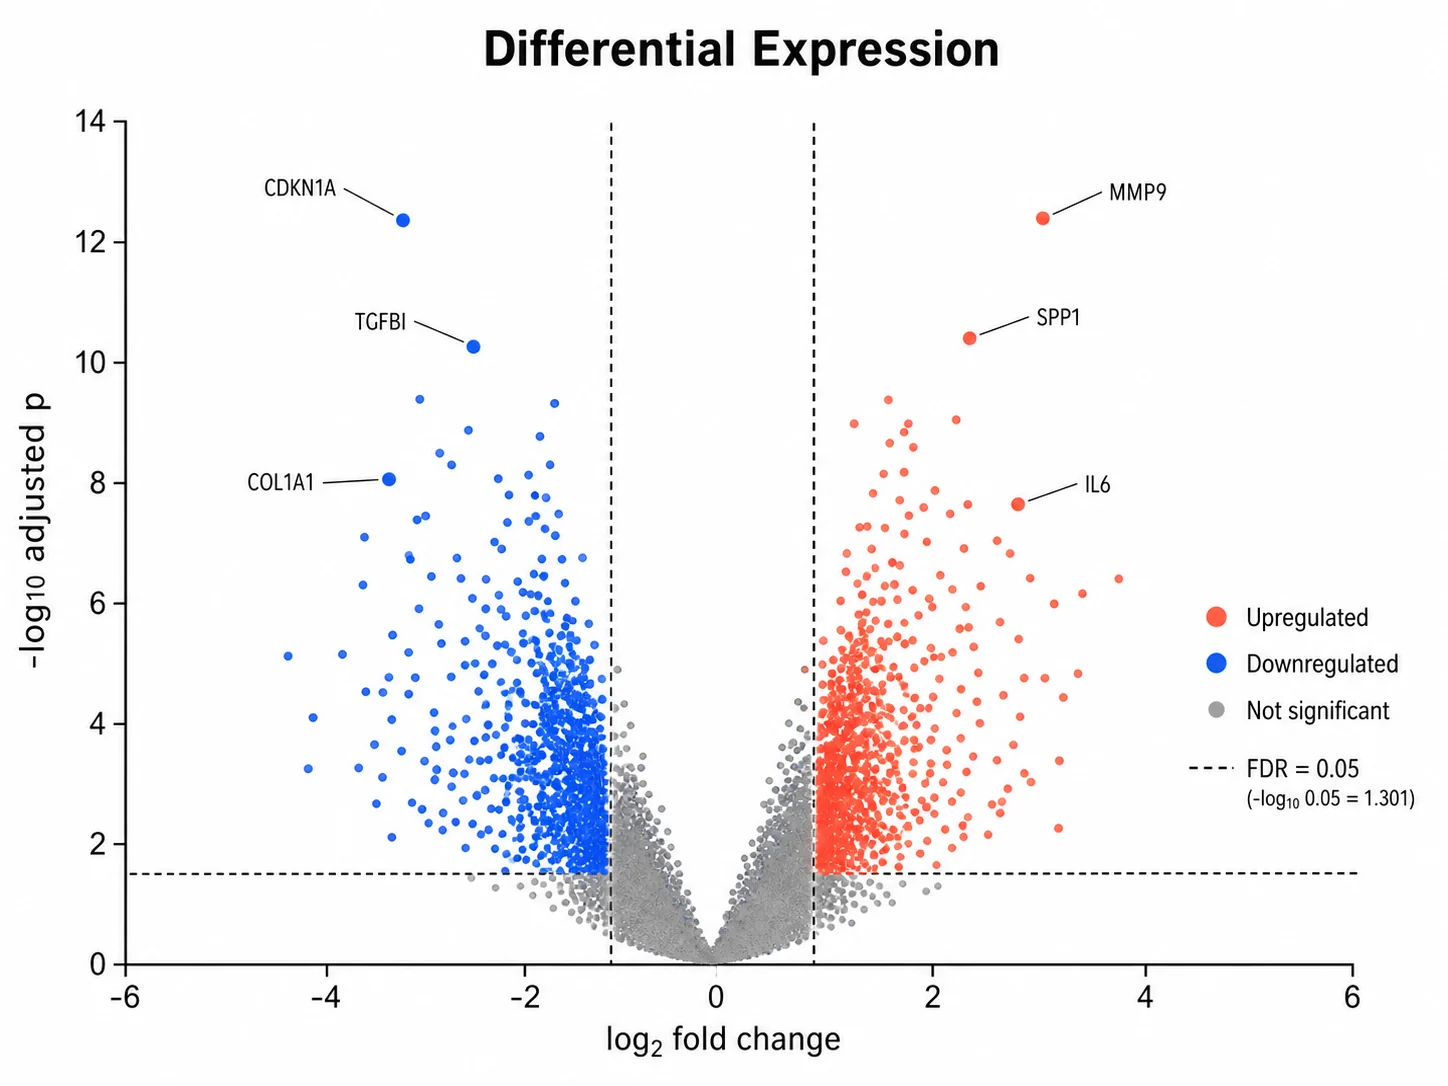
Volcano Plot Generator
Fold change against adjusted p-value for differential expression.
Heatmap Generator
Clustered matrices with dendrograms and a color scale.
Histogram Generator
Frequency distribution of a numeric variable.
Dot Plot Generator
Ranked or grouped values as markers.
Line Chart Generator
Ordered measurements with markers and trend lines.
Time Series Plot Generator
Measurements plotted over time.
Bode Plot Generator
Frequency response magnitude and phase.
Correlation Matrix Generator
Turn numeric variables into a clustered Pearson or Spearman correlation heatmap.
Dose-Response Curve Generator
Fit four-parameter logistic curves and report EC50 or IC50 values.
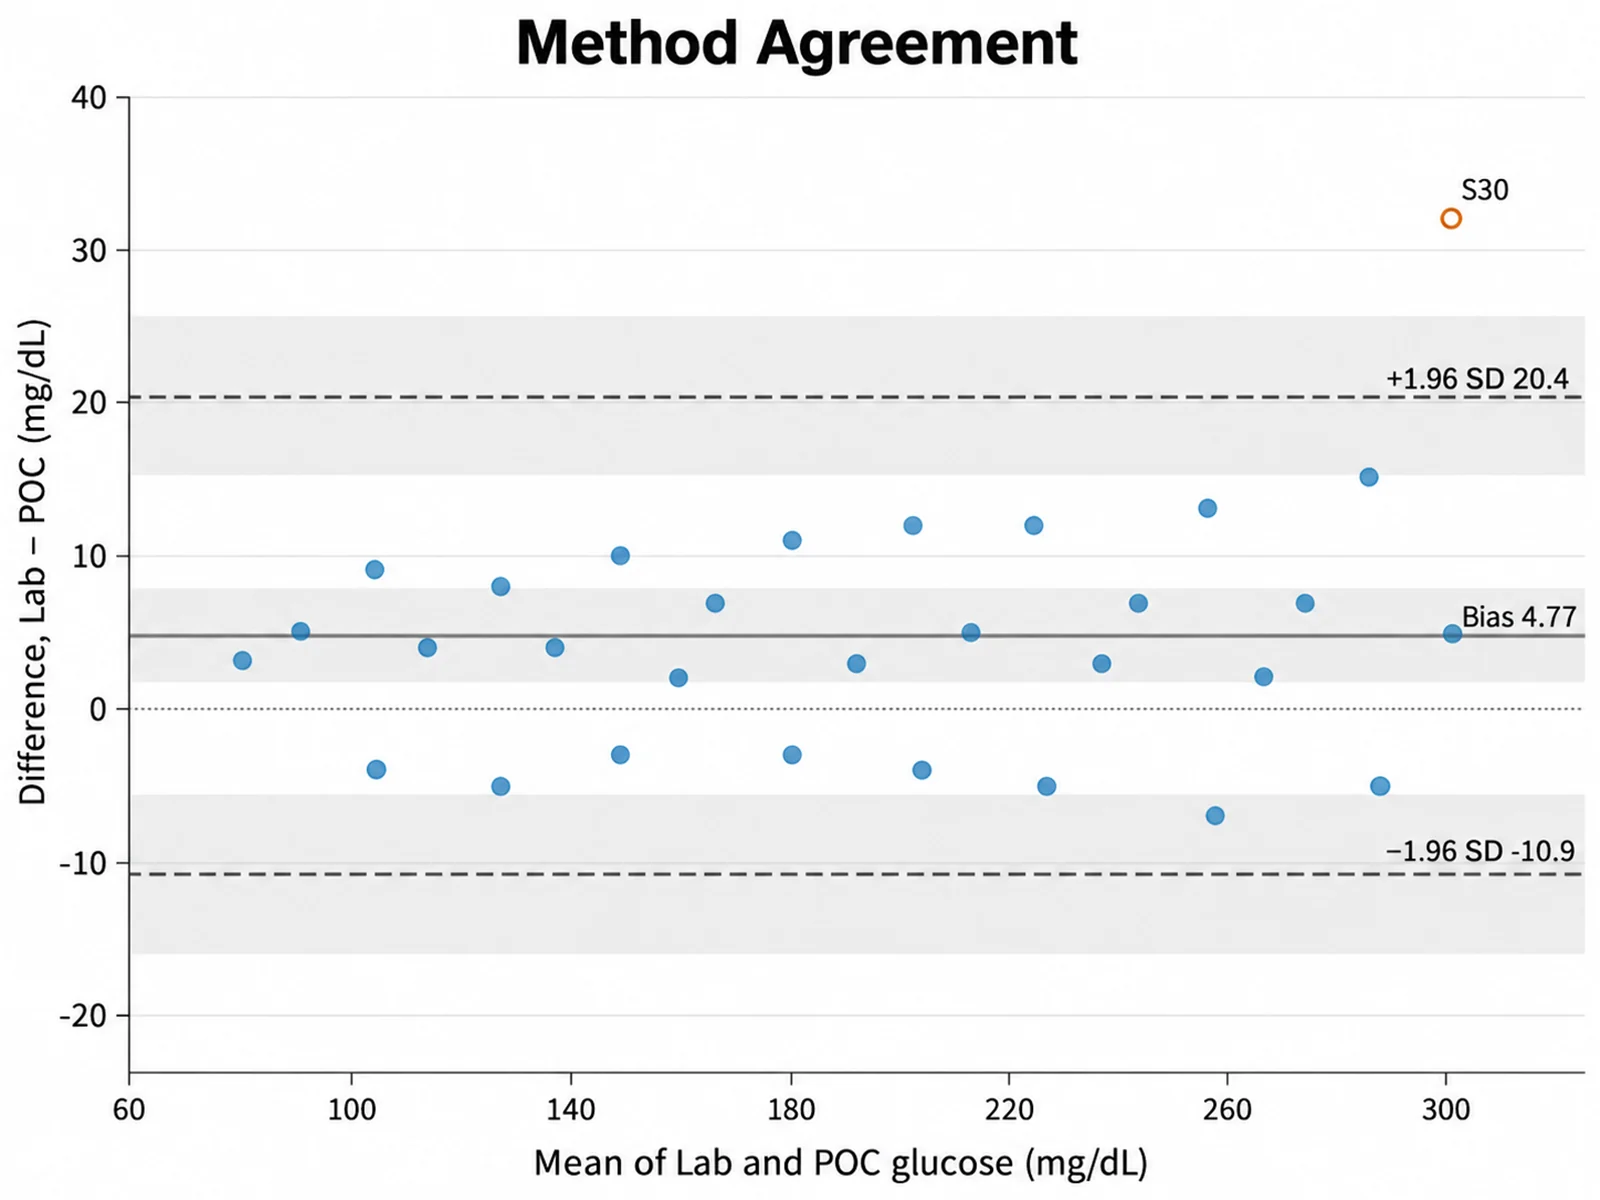
Bland-Altman Plot Generator
Compare two measurement methods with bias and 95% limits of agreement.
Stacked Bar Chart Maker
Show part-to-whole composition with absolute or 100% stacked bars.
Kaplan-Meier Plot Generator
Draw survival curves with censoring marks, median survival, and at-risk counts.
ROC Curve Generator
Compute ROC curves and AUC from labels and scores for diagnostic models.
PCA Plot Generator
Project high-dimensional samples onto PC1 and PC2 with explained variance.
Radar Chart Maker
Compare multi-metric profiles across groups on a shared radial scale.
Manhattan Plot Generator
Plot GWAS p-values across chromosomes with significance thresholds.
Raincloud Plot Maker
Combine half-violins, box plots, and raw points in one distribution figure.
Sankey Diagram Generator
Visualize flows between stages from source, target, and value columns.
Bubble Chart Maker
Encode three variables with x, y, and bubble size, plus optional groups.
What GraphPad Prism does that SciFigure AI does not
Prism combines data tables, an analysis library, and a graph editor. GraphPad lists paired and unpaired t tests, several ANOVA variants, nonlinear regression with 105 built-in equations, Kaplan-Meier survival analysis, and Cox proportional hazards regression, with graphs and results that update when the data change. SciFigure AI has none of those test menus and does not store analysis projects. If your work depends on choosing and reporting statistical tests, keep Prism or use one of the free statistics packages below.
What the SciFigure AI chart generators compute
Each generator computes the statistics its chart type needs from your uploaded CSV or Excel file, then renders a publication-ready PNG. You do not pick tests from a menu; the chart defines the calculation.
- Dose-response curve: four-parameter logistic (4PL) fit with IC50 or EC50.
- Kaplan-Meier plot: survival curves with censoring marks and a log-rank test.
- ROC curve: AUC with a DeLong confidence interval.
- Bland-Altman plot: bias and 95% limits of agreement.
- PCA plot: PC1 and PC2 with explained variance.
GraphPad Prism pricing compared with SciFigure AI
On September 15, 2026, GraphPad listed personal annual subscriptions at $142 per year for students, $260 for academics, and $520 for corporate users, plus a $50 monthly option. An academic perpetual license was $1,600, without upgrades or future support. SciFigure AI charges 5 credits per chart. New accounts get 10 free credits valid for 7 days, and signed-in users get 5 bonus credits per day, all usable for charts. Paid plans start at $15 per month or $90 per year.
Free GraphPad Prism alternatives
These are the usual choices when you want to avoid a license fee but still need real statistical analysis. They take more setup than a single-purpose chart page, and they cover the tests, models, and scripts that SciFigure AI does not.
- JASP: an open-source project supported by the University of Amsterdam, with frequentist and Bayesian analyses in a point-and-click interface.
- jamovi: a free and open statistics package built on R, with a spreadsheet editor, desktop apps for Windows, macOS, and Linux, and jamovi Cloud in the browser.
- R with ggplot2: R is a free software environment for statistical computing and graphics, and ggplot2 is an MIT-licensed package based on the grammar of graphics.
- Python with matplotlib: a comprehensive library for static, animated, and interactive visualizations, with a BSD-compatible license.
Which GraphPad Prism alternative should you choose?
Many projects need more than one tool. One practical split is to run the analysis in Prism, JASP, jamovi, or R, then use a chart generator when you want a clean figure of a standard chart type from the same data file. Treat the statistics shown on the chart as a check against your analysis, not a replacement for it.
- Choose Prism if you run many statistical tests, fit custom models, or need a reproducible project file.
- Choose JASP or jamovi if you want free analysis menus without code.
- Choose R or Python if you want full control and are comfortable writing code.
- Choose SciFigure AI if you know which chart you need and want a publication-ready PNG from a data file without installing software.
Frequently asked questions
Is there a free GraphPad Prism alternative?
Yes. JASP and jamovi are free statistics packages with analysis menus, and R and Python are free if you can code. SciFigure AI is not free software, but its free credits work for charts: new accounts get 10 credits valid for 7 days, signed-in users get 5 bonus credits per day, and each chart costs 5 credits. Paid plans start at $15 per month.
How much does GraphPad Prism cost?
GraphPad’s how-to-buy page, checked September 15, 2026, lists Student at $142 per year, Academic at $260 per year, Corporate at $520 per year, a $50 monthly option, and an academic perpetual license at $1,600. Group and enterprise subscriptions are also listed. Check the official page for current prices.
Can SciFigure AI run t tests or ANOVA?
No. SciFigure AI is not a statistics suite and has no test menus. Its chart generators compute only the statistics a given chart needs, such as a log-rank test on a Kaplan-Meier plot or limits of agreement on a Bland-Altman plot.
Which chart types can I make?
There are 26 chart generator pages, including bar, box, violin, scatter, heatmap, volcano, forest, Kaplan-Meier, ROC, PCA, dose-response, and Bland-Altman charts. The full list is on this page, with a link to each generator.
Do I need to install anything?
No. You upload a CSV or Excel file in the browser and download a publication-ready PNG. Prism, by comparison, is a desktop application for Mac and Windows.
Can I publish charts made with SciFigure AI?
Paid plans permit using generated outputs for research and commercial purposes under the Terms of Service. Review the computed values against your own analysis, and follow your journal, publisher, and institution rules on AI-generated images.
Start with a chart
Dose-Response Curve Generator
Fit four-parameter logistic curves and report IC50 or EC50 values.
Kaplan-Meier Plot Generator
Survival curves with censoring marks, median survival, and at-risk counts.
Data Visualization Tools
Every chart generator in one place.
Pricing
Credit packs and monthly or yearly plans.
ROC Curve Generator
ROC curves with AUC, a DeLong confidence interval, and Youden cutoffs.
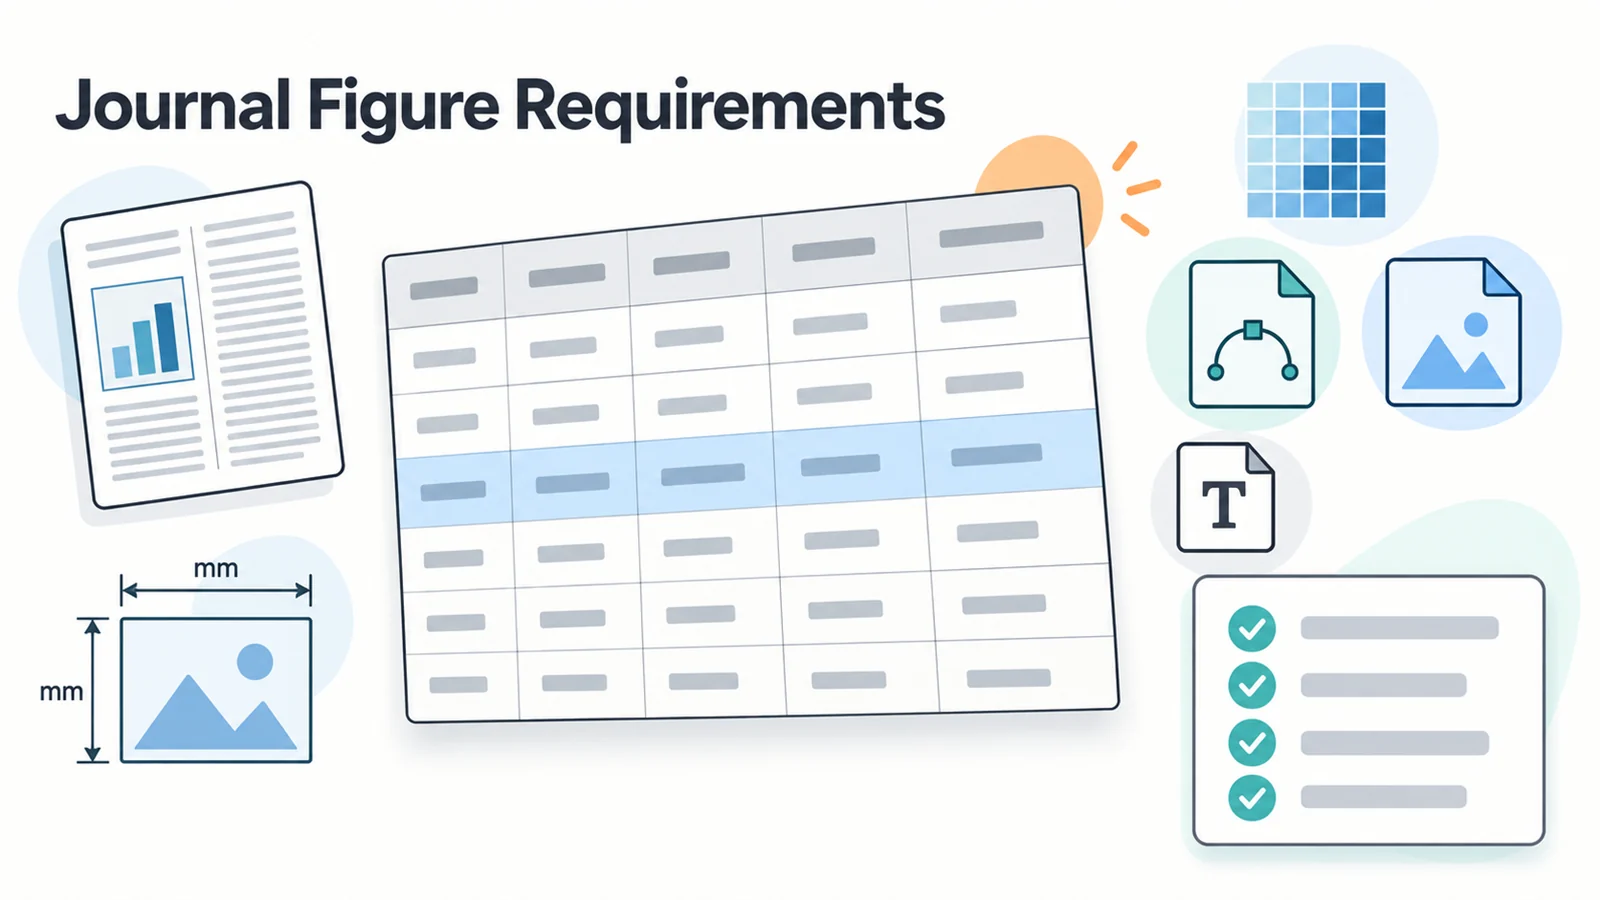
Journal Figure Requirements
Column widths, resolution, and formats for 14 publishers.
Make your first chart with free credits
Upload a CSV or Excel file and get a publication-ready PNG. Each chart costs 5 credits, and free credits work.
Browse chart generatorsLast checked: September 15, 2026. Sources: GraphPad how to buy, GraphPad Prism features, JASP, jamovi, R Project, ggplot2, Matplotlib, SciFigure AI pricing. Prices and licenses change, so confirm on the official site before you buy.