Bode Plot Generator for Frequency Response Data

Create publication-ready Bode plots from frequency-response measurements.

Upload positive frequency values with magnitude and optional phase data, describe cutoffs or traces, then generate a clean AI-made Bode plot with manuscript-ready PNG output.

Frequency-response readyMagnitude & phasePublication-ready PNG

AI Bode Plot Generator

Upload data and describe the AI chart you need.

Aspect ratio
309 / 2000 characters

Costs 5 credits. Uses your uploaded data and prompt to generate a publication-ready PNG.

Preview

Bode Plot Example Previews

Aspect ratio: 16:9

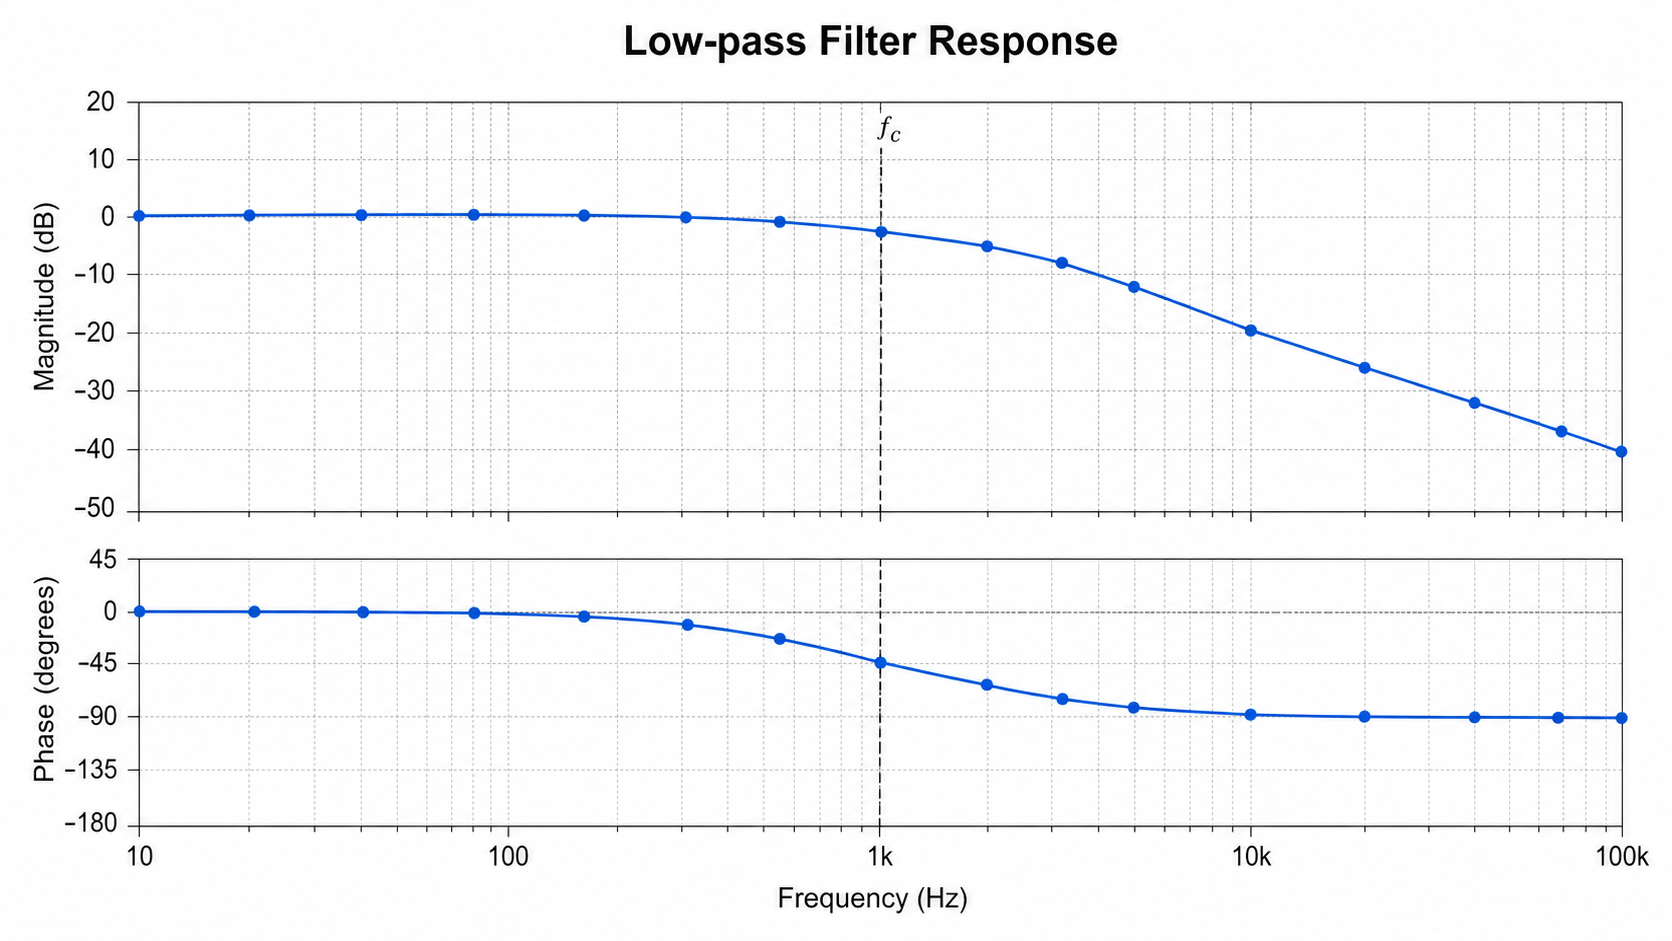
Low-pass Filter Response Bode plot example preview
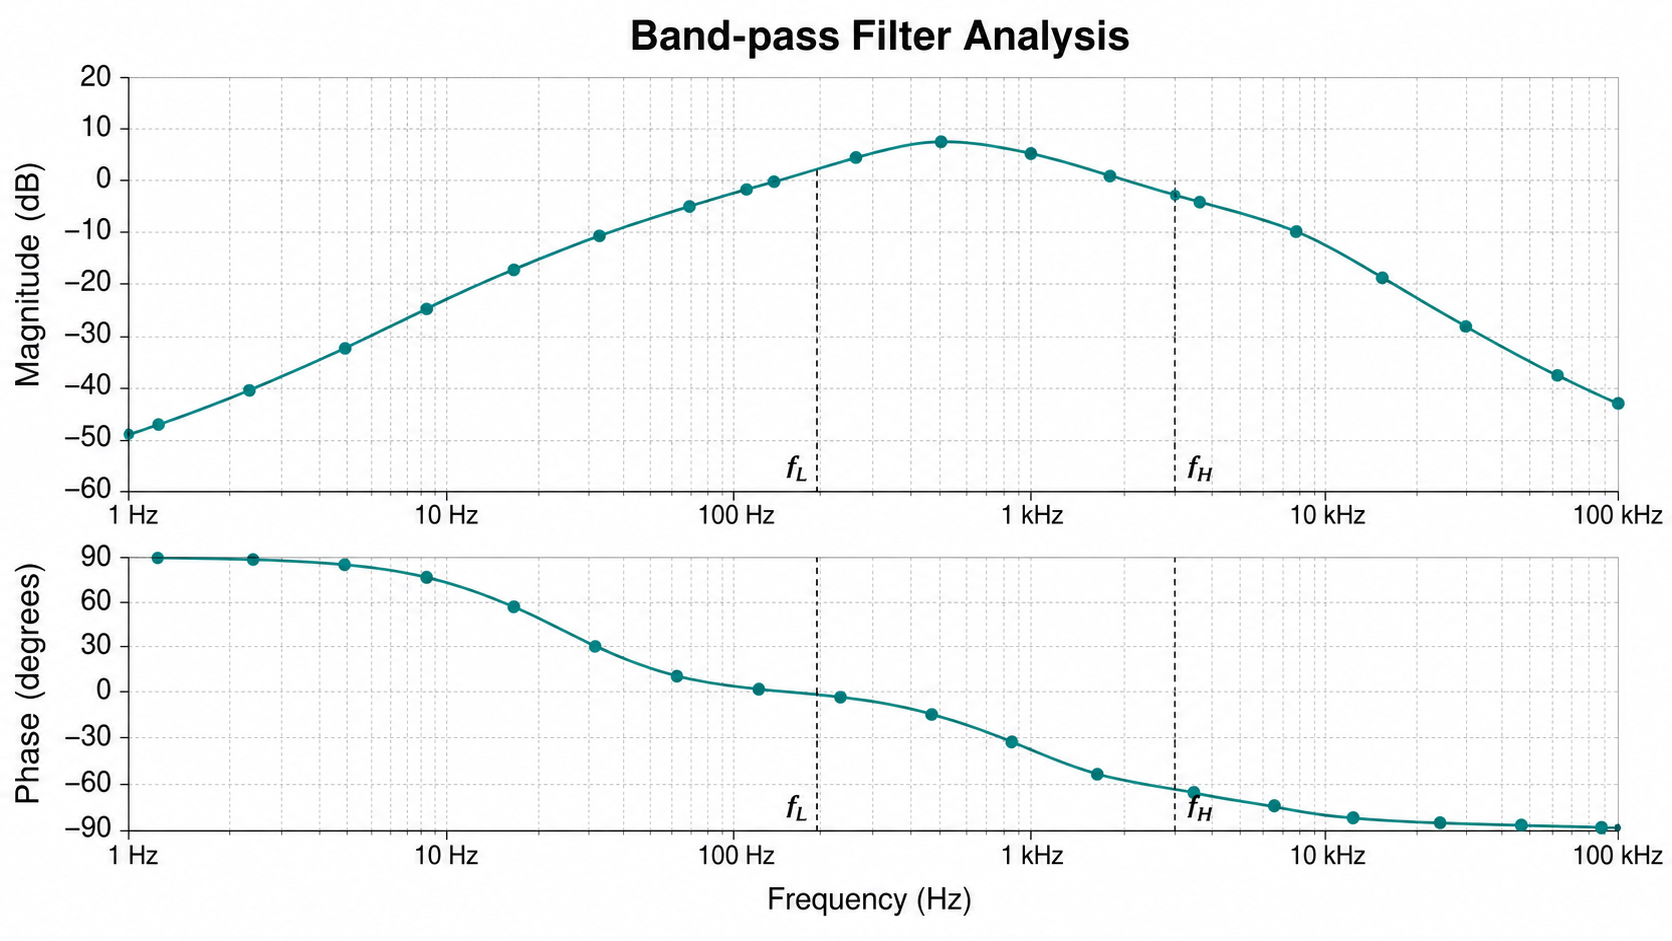
Band-pass Filter Analysis Bode plot example preview
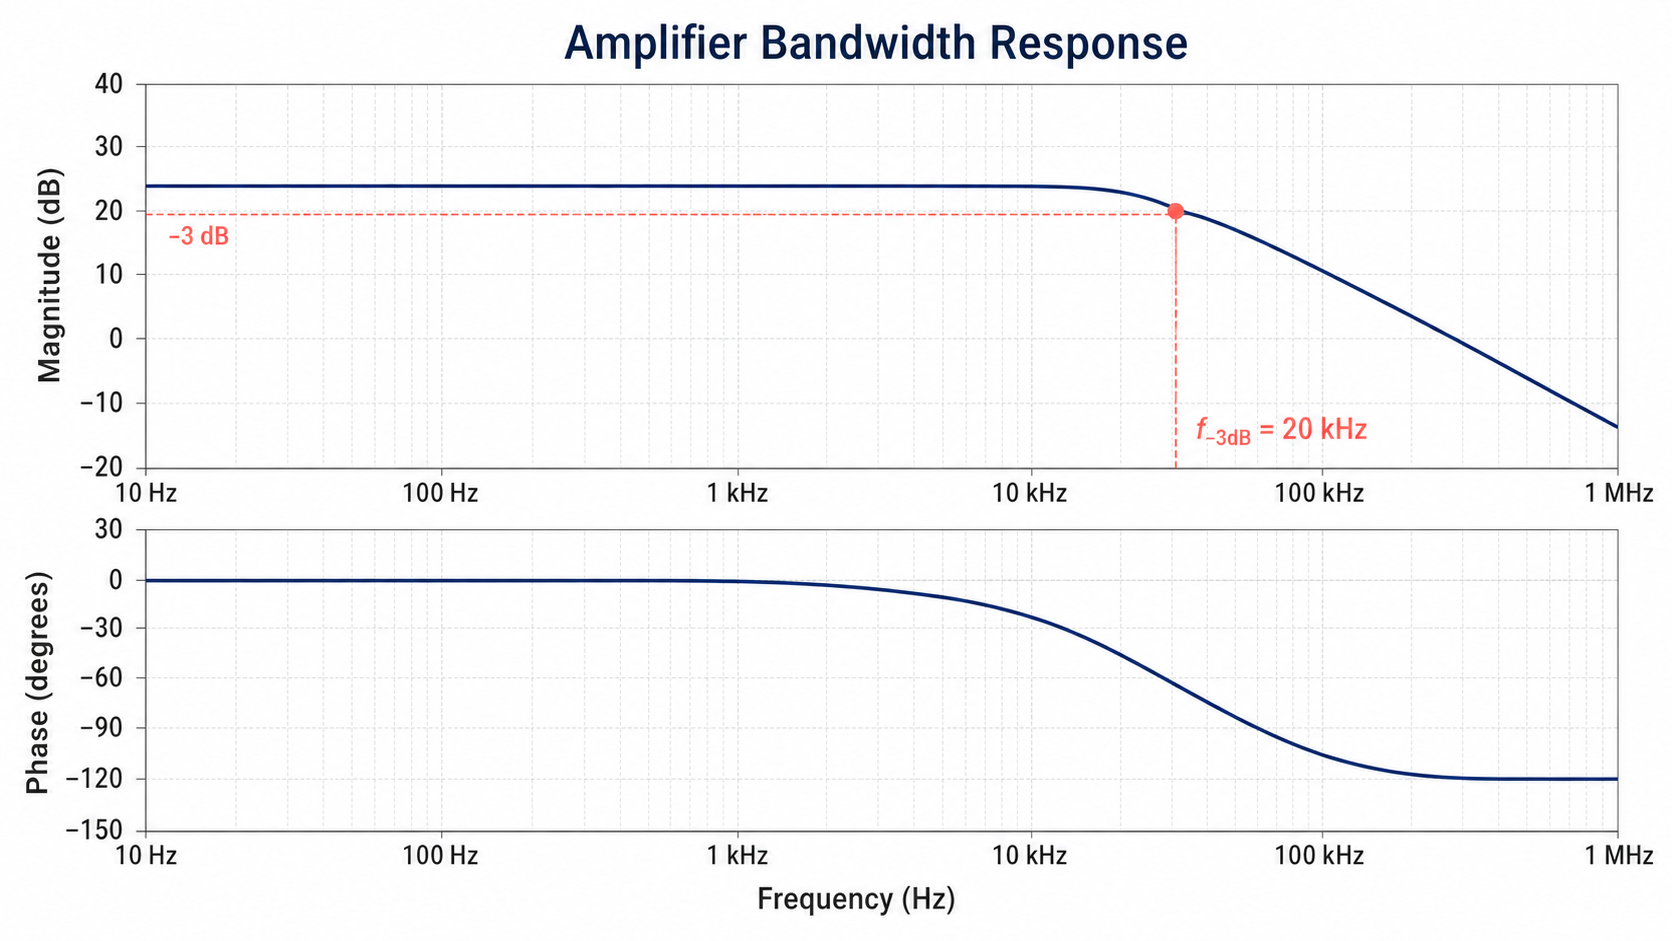
Amplifier Bandwidth Response Bode plot example preview

These are sample previews. Upload your dataset to generate your own Bode plot.

Bode plot examples

Use these examples as visual directions for filters, amplifiers, control loops, measured-versus-simulated traces, notches, resonance, and engineering-ready Bode plots.

Bode Plot Generator: Low-pass Filter Response scientific chart example

Prompt

Based on the uploaded low_pass_filter_response.csv file, create a publication-ready Bode plot for a low-pass filter. Use positive frequency values on a logarithmic x-axis, show magnitude in dB and phase in degrees as stacked panels, preserve measured points, and mark cutoff frequency only when the data or prompt supports it.
Low-pass Filter Response

Bode Plot Generator: Band-pass Filter Analysis scientific chart example

Prompt

Based on the uploaded band_pass_filter_analysis.tsv file, create a Bode plot for a band-pass filter. Plot magnitude and phase against log-scaled frequency, show the passband peak and attenuation regions clearly, add lower and upper cutoff guides only when supported by the uploaded values, and use clean teal engineering styling.

Band-pass Filter Analysis

Bode Plot Generator: Amplifier Bandwidth Response scientific chart example

Prompt

Based on the uploaded amplifier_bandwidth_response.xlsx file, create a Bode plot showing amplifier bandwidth. Use magnitude in dB and phase in degrees, preserve the uploaded frequency range, add a subtle -3 dB bandwidth guide only if the values support it, and keep the two-panel engineering layout crisp.

Amplifier Bandwidth Response

Bode Plot Generator: Control Loop Response scientific chart example

Prompt

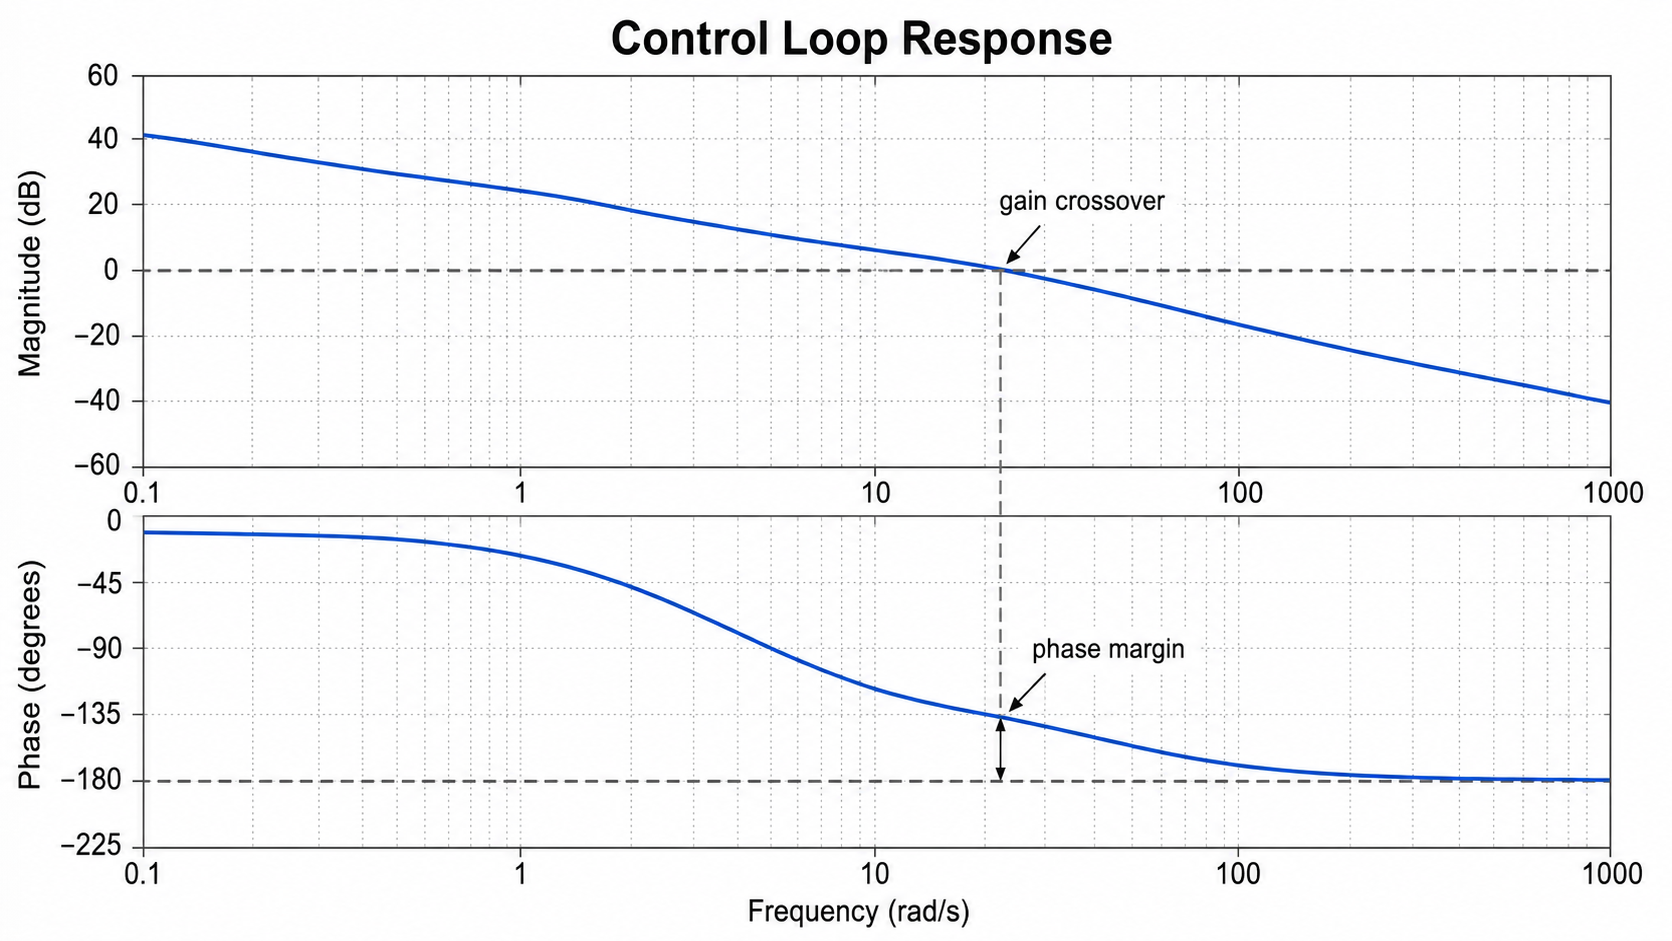
Based on the uploaded control_loop_response.csv file, create a Bode plot for a control loop response. Use logarithmic frequency on the x-axis, magnitude and phase panels, subtle 0 dB and -180 degree reference lines, and add gain crossover or phase margin annotations only when the uploaded data and prompt support them.

Control Loop Response

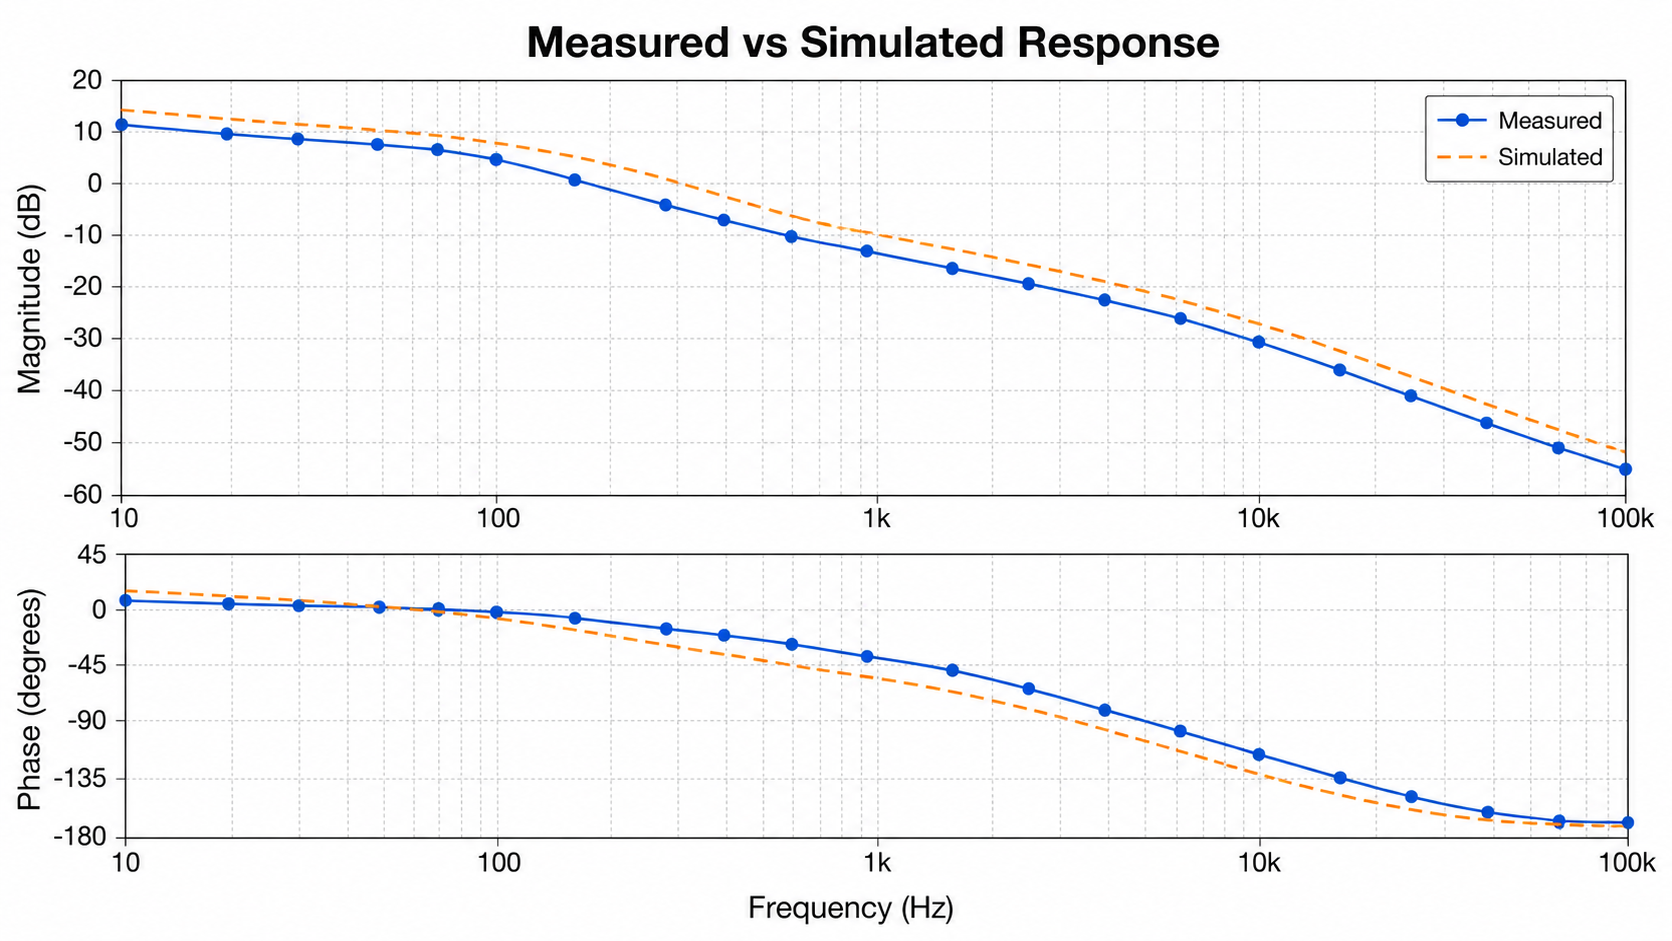
Bode Plot Generator: Measured vs Simulated Response scientific chart example

Prompt

Based on the uploaded measured_vs_simulated_response.csv file, create a Bode plot comparing measured and simulated response traces. Use consistent colors across magnitude and phase panels, show measured points and simulated dashed lines only when the series columns are present, include a compact legend, and avoid extrapolating beyond the uploaded frequency range.

Measured vs Simulated Response

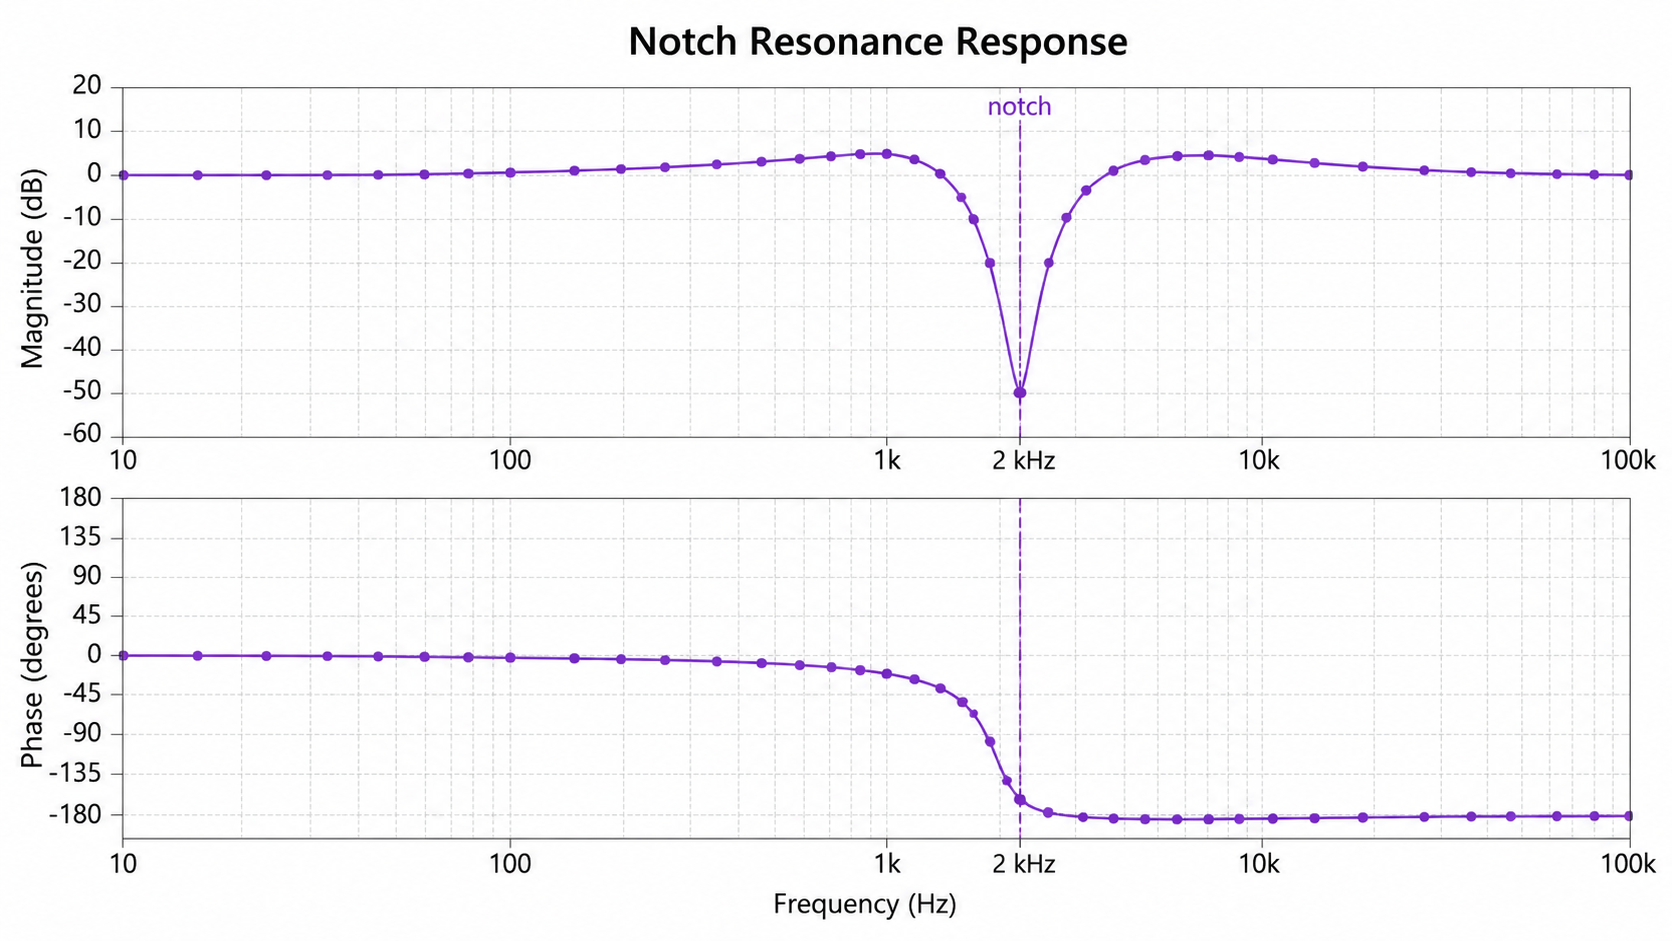
Bode Plot Generator: Notch Resonance Response scientific chart example

Prompt

Based on the uploaded notch_resonance_response.tsv file, create a Bode plot for a notch or resonance response. Plot positive frequency values on a log x-axis, show magnitude and phase panels, mark the notch or resonance frequency only when visible in the uploaded data, and use a restrained purple technical palette.

Notch Resonance Response

How to make a Bode plot

1

Upload response data

Add CSV, TSV, TXT, or Excel data with positive frequency values, magnitude values, and optional phase or series columns.

2

Describe the chart

Tell SciFigure AI the units, panels, measured points, cutoff lines, crossover notes, grouping, and annotations you need.

3

Generate, review & download

Create a clean AI Bode plot, verify log scaling and units, then download PNG for reports and slides.

What does this Bode plot generator do?

It turns frequency-response measurements into a clean Bode plot with magnitude and optional phase panels. The result is useful for filters, amplifiers, sensors, control loops, resonance analysis, engineering reports, and research presentations.

Why use a Bode plot generator

  • Visualize magnitude and phase response across positive frequency values.
  • Use logarithmic frequency scaling with readable engineering labels and units.
  • Compare measured, simulated, grouped, or multi-condition response traces.
  • Move from frequency-response spreadsheets to polished technical figures faster.

Types and parts of a Bode plot

  • The magnitude panel usually shows gain or response in dB.
  • The phase panel shows phase angle in degrees or radians when supplied.
  • The frequency axis is logarithmic and needs positive frequency values.
  • Cutoff, crossover, bandwidth, and margin annotations should be added only when supported by the data or requested in the prompt.

Bode Plot Generator FAQ

What data does the Bode plot need?

Use a positive numeric frequency column and a numeric magnitude column. Add a numeric phase column when you need a two-panel magnitude and phase Bode plot.

Does the frequency axis use a log scale?

Yes. Bode plots normally use a logarithmic frequency axis, so zero or negative frequencies cannot be plotted on that scale.

Can I compare measured and simulated traces?

Yes. Include a series, condition, or trace column and describe how the traces should be styled in the final figure.

Can it show cutoff frequency or stability margins?

Yes, but those annotations should only be included when the uploaded data and your instructions support them.

Can I use the result in a report or paper?

Yes, but verify units, frequency scaling, phase wrapping, line labels, and any engineering annotations before submission.

Need clearer frequency-response figures?

Generate Bode plots, line charts, regression plots, and other research-ready visualizations with SciFigure AI.