Immune Response Diagram Generator: Innate to Adaptive
Generate an immune response diagram with the pairings right: innate barriers, phagocytes and inflammation; dendritic cells presenting peptides on MHC class I to CD8 T cells and on MHC class II to CD4 T cells; the three signals of T-cell activation; helper T-cell subsets; B cells, plasma cells and the five antibody classes; and memory cells behind a faster secondary response. Pick a topic, a level and a style, and a labeled diagram or a blank worksheet with its answer key.
Innate + adaptive armsMHC I → CD8, MHC II → CD4Labeled or blank worksheet
Checked against OpenStax and NCBI Bookshelf
Correct MHC and CD pairings
Worksheet + answer key pairs
Print-ready PNG
AI Immune Response Diagram Generator
Describe the cells and steps to show, or pick a topic, level, and style from the menus.
664 / 2000 characters
Generate a publication-ready PNG from your description.
Preview
Immune Response Diagram Example Previews
Target aspect ratio: 16:9
Sample previews. Describe your figure to generate your own immune response diagram.
Immune Response Diagram Examples
A primary vs secondary antibody response graph, the three signals of T-cell activation with a blank worksheet and its answer key, and a one-glance flowchart of innate and adaptive immunity. Load one into the generator, then switch the topic, level, or labels to make your own.
Prompt
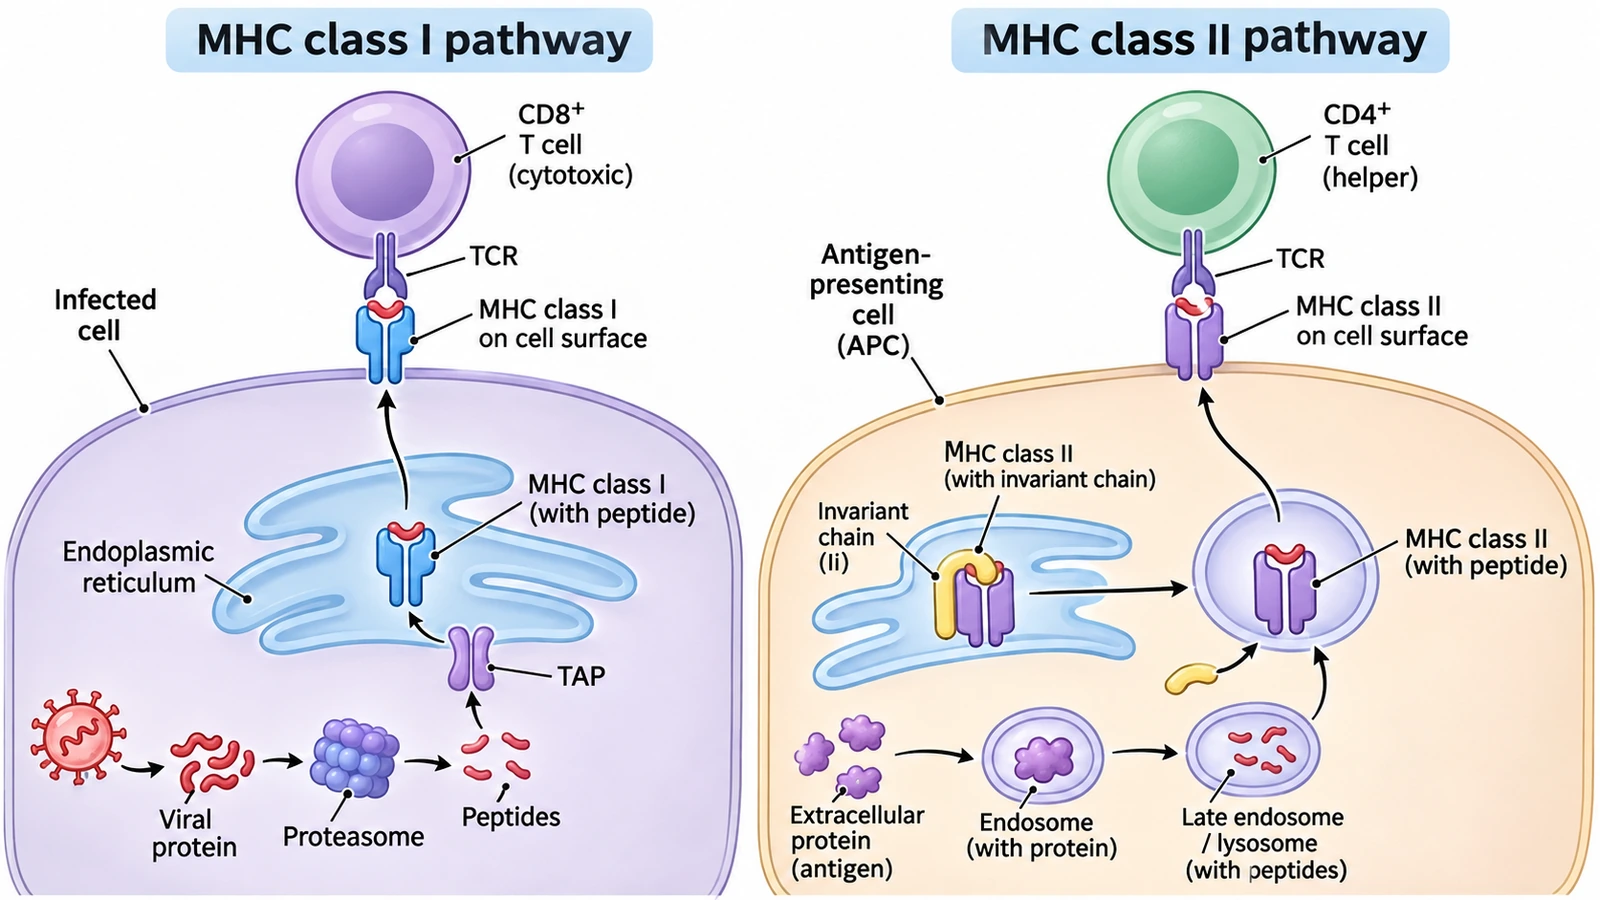
Create a textbook illustration of antigen presentation on a white background in two panels. Left, headed "MHC class I pathway": an infected cell in which a "Viral protein" is cut by the "Proteasome" into "Peptides" that pass through "TAP" into the "Endoplasmic reticulum", load onto "MHC class I (with peptide)" and travel to the surface, where "MHC class I on cell surface" meets the "TCR" of a "CD8+ T cell (cytotoxic)". Right, headed "MHC class II pathway": an "Antigen-presenting cell (APC)" takes up an "Extracellular protein (antigen)" into an "Endosome (with protein)", which becomes a "Late endosome / lysosome (with peptides)"; "MHC class II (with invariant chain)" leaves the ER, the "Invariant chain (Ii)" is removed, "MHC class II (with peptide)" goes to the surface and meets the "TCR" of a "CD4+ T cell (helper)". Never pair MHC class I with CD4 or MHC class II with CD8.
Antigen presentation
Use this example
Prompt
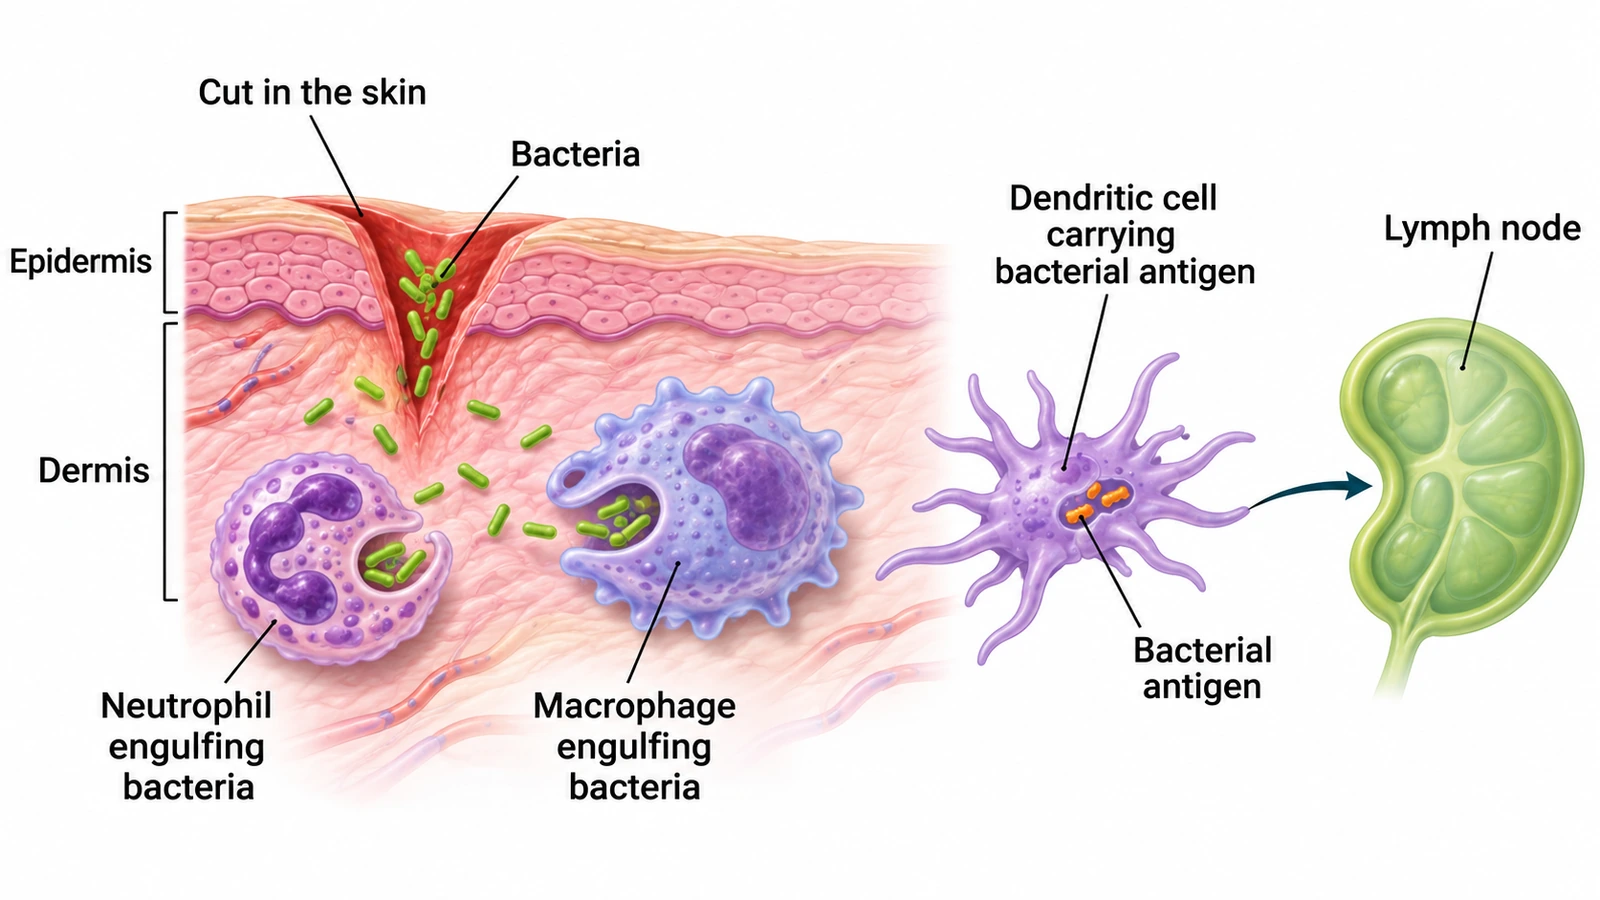
Create a textbook illustration of the first stage of an immune response on a white background, wide layout. On the left, a skin cross-section with the "Epidermis" and "Dermis" bracketed, a "Cut in the skin" and rod-shaped "Bacteria" entering the dermis. In the dermis, a "Neutrophil engulfing bacteria" with a multi-lobed nucleus and a "Macrophage engulfing bacteria". To the right, a "Dendritic cell carrying bacterial antigen" with the "Bacterial antigen" marked inside it, and an arrow to a "Lymph node", where the adaptive response begins.
Innate vs adaptiveHigh school
Use this example
Prompt
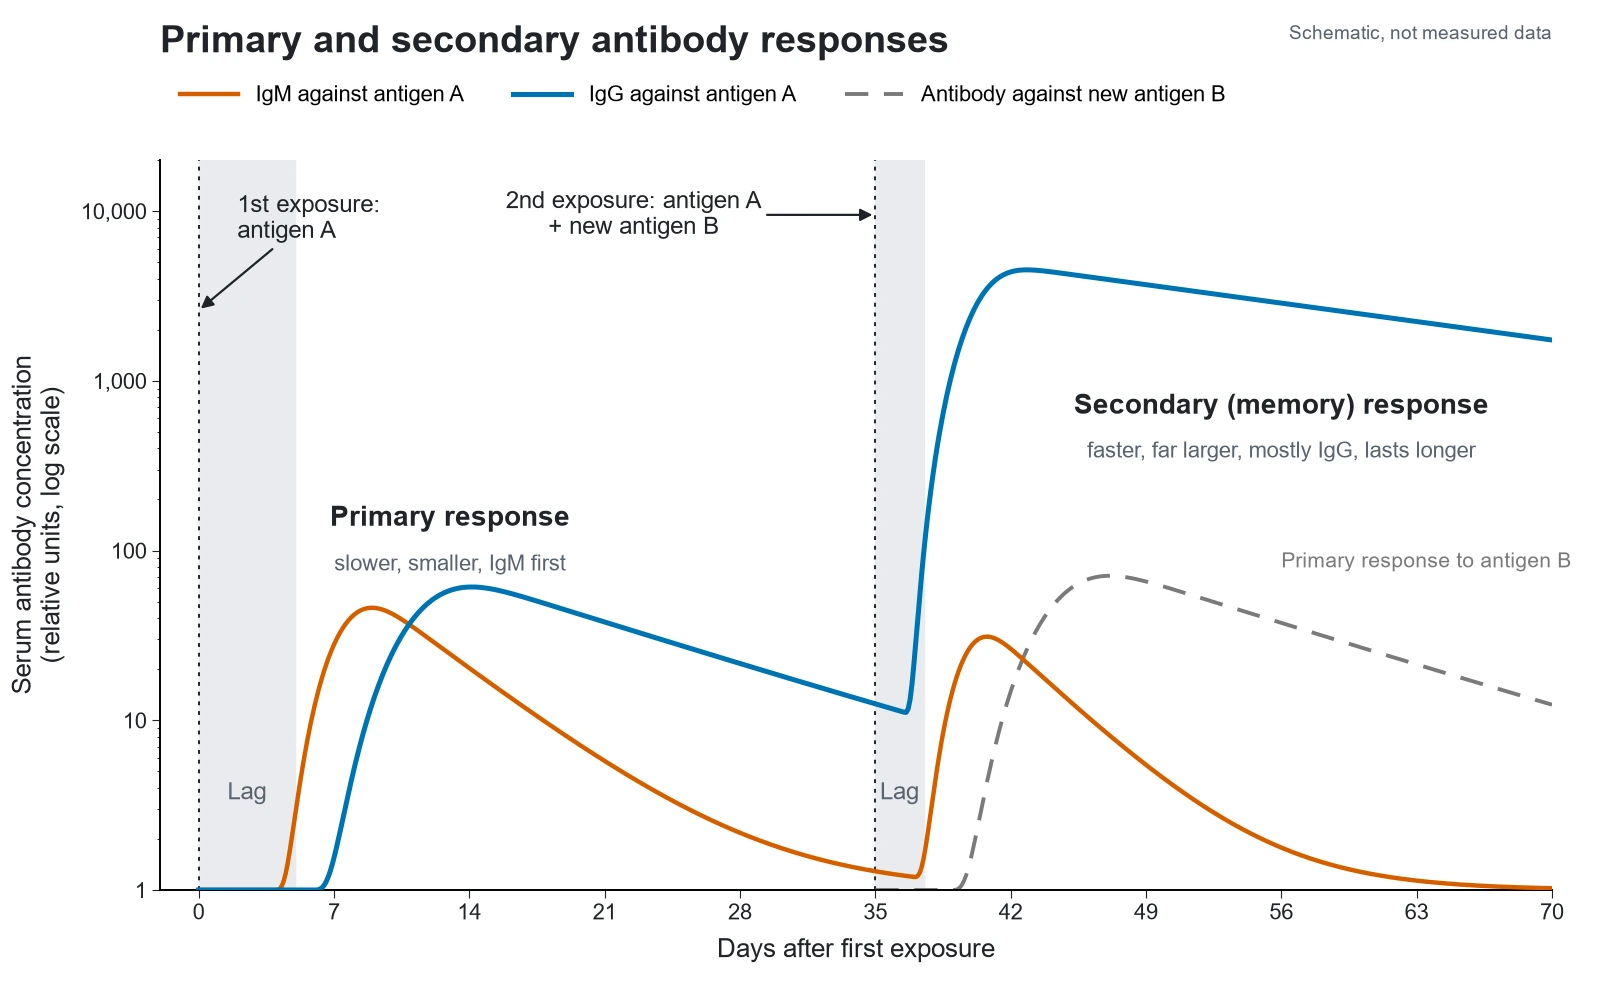
Create a graph titled "Primary and secondary antibody responses" on a white background: x-axis "Days after first exposure" from 0 to 70, y-axis "Serum antibody concentration (relative units, log scale)" from 1 to 10,000. Mark the first exposure to antigen A at day 0 and the second exposure to antigen A plus a new antigen B at day 35 with dotted lines and arrows. Primary response: a shaded lag phase of about five days, an orange IgM curve peaking near day 9, and a blue IgG curve peaking near day 14 at a similar height. Secondary response to antigen A: a shorter shaded lag, a small IgM bump, and a blue IgG curve rising steeply to a peak far above the primary peak and declining slowly. A grey dashed curve shows the primary response to antigen B, no faster or higher than the first primary response. Label "Primary response", "Secondary (memory) response" and add a legend.
Primary vs secondaryPublication schematic
Use this example
Prompt
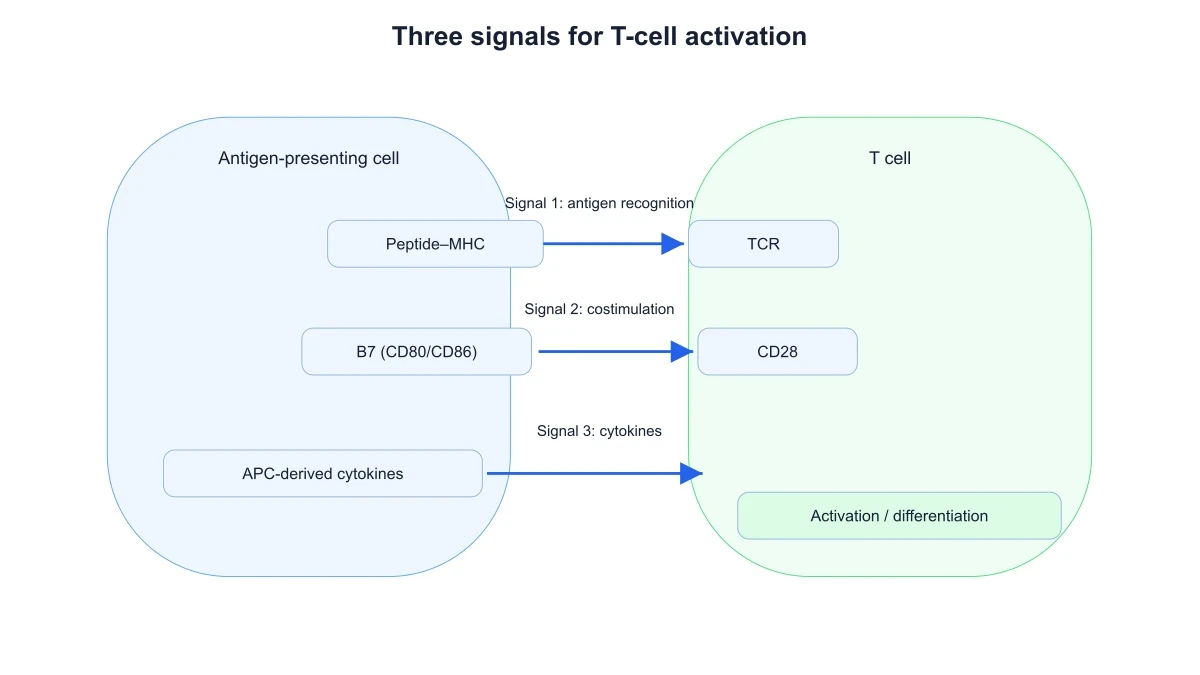
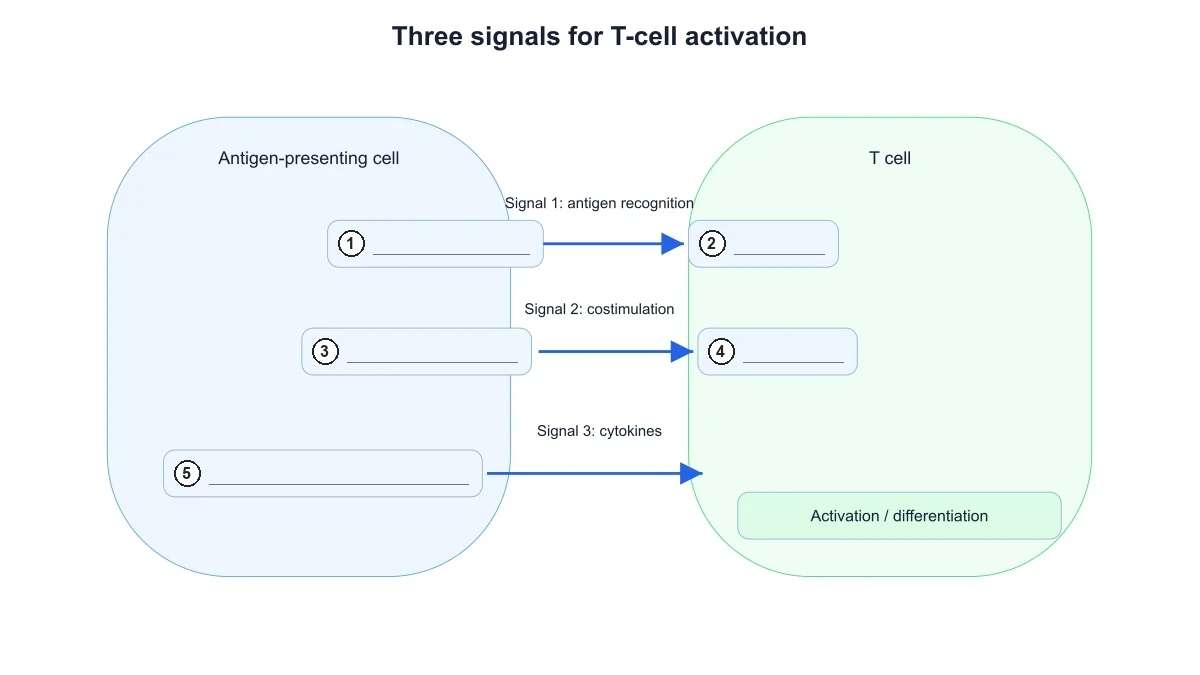
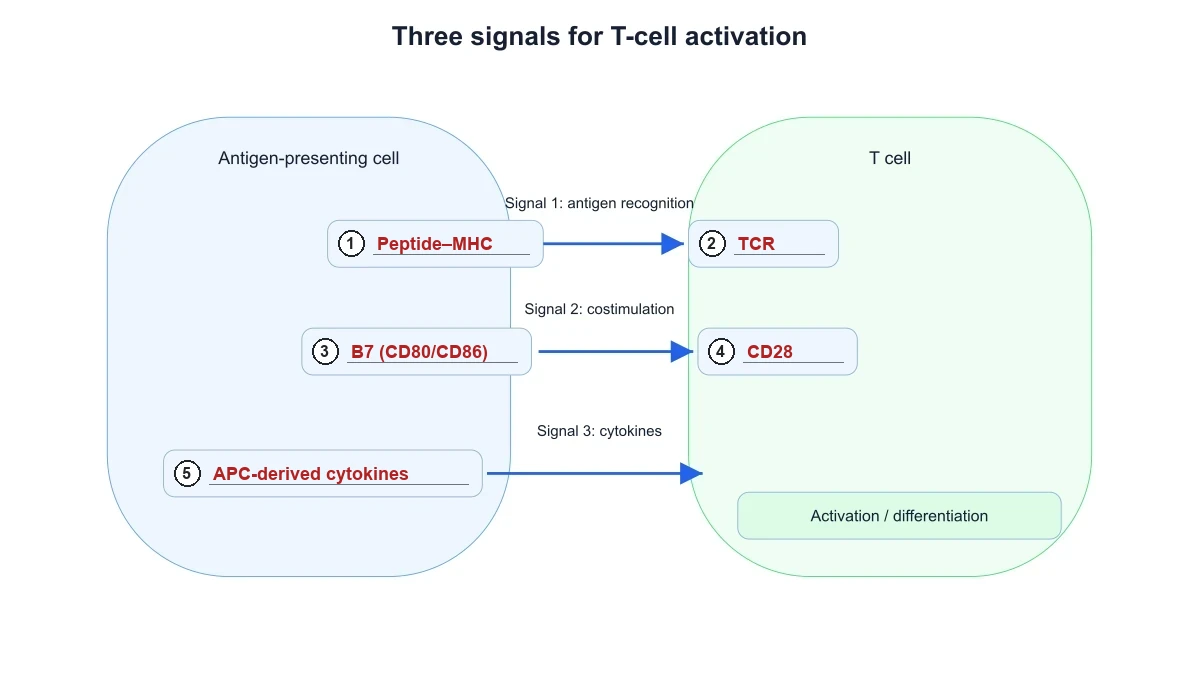
Create a T-cell activation diagram titled "Three signals for T-cell activation" in a flat schematic style on a white background. On the left a large rounded blue box labeled "Antigen-presenting cell" containing three boxes: "Peptide–MHC", "B7 (CD80/CD86)" and "APC-derived cytokines". On the right a large rounded green box labeled "T cell" containing "TCR", "CD28" and a box "Activation / differentiation". Three arrows run from the APC to the T cell: peptide–MHC to TCR captioned "Signal 1: antigen recognition", B7 to CD28 captioned "Signal 2: costimulation", and cytokines to the T cell captioned "Signal 3: cytokines".
T-cell activationPublication schematic
Use this example
Prompt
Create a blank T-cell activation worksheet from the three-signal diagram: a flat schematic on a white background titled "Three signals for T-cell activation", with a large rounded blue box labeled "Antigen-presenting cell" on the left and a large rounded green box labeled "T cell" on the right. Three arrows run from left to right: from the first APC box to the first T-cell box, captioned "Signal 1: antigen recognition"; from the second APC box to the second T-cell box, captioned "Signal 2: costimulation"; and from the third APC box to the T cell, captioned "Signal 3: cytokines". A box at the bottom of the T cell reads "Activation / differentiation". Replace the five molecule names with a numbered circle and an empty answer line inside each box: 1 = Peptide–MHC, 2 = TCR, 3 = B7 (CD80/CD86), 4 = CD28, 5 = APC-derived cytokines. Keep the cell names, the signal captions and "Activation / differentiation". No names, no word bank and no key.
Create the answer key for the T-cell activation worksheet: a flat schematic on a white background titled "Three signals for T-cell activation", with a large rounded blue box labeled "Antigen-presenting cell" on the left and a large rounded green box labeled "T cell" on the right. Three arrows run from left to right: from the first APC box to the first T-cell box, captioned "Signal 1: antigen recognition"; from the second APC box to the second T-cell box, captioned "Signal 2: costimulation"; and from the third APC box to the T cell, captioned "Signal 3: cytokines". A box at the bottom of the T cell reads "Activation / differentiation". Inside each box put a numbered circle and an answer line with the answer written on it: 1 = Peptide–MHC, 2 = TCR, 3 = B7 (CD80/CD86), 4 = CD28, 5 = APC-derived cytokines. Keep the numbering in this order so the key matches the worksheet line for line.
T-cell activationPublication schematic
Use this example
Prompt
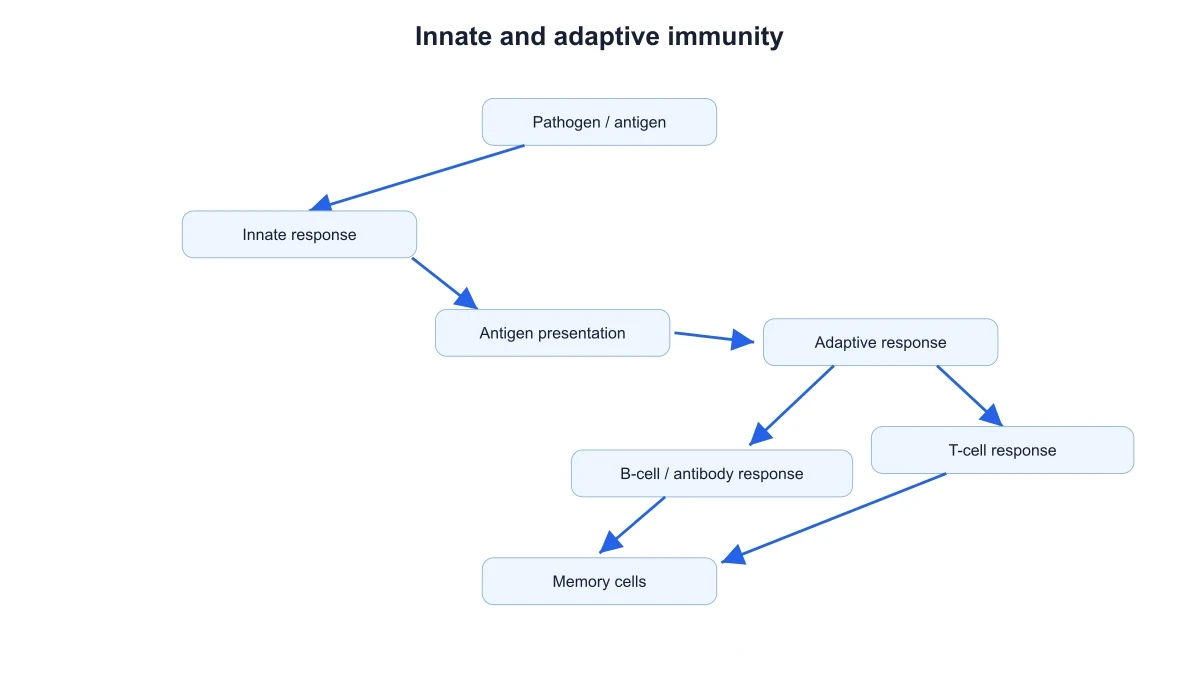
Create a simple immune response flowchart titled "Innate and adaptive immunity" with rounded pale-blue boxes and blue arrows on a white background: "Pathogen / antigen" → "Innate response" → "Antigen presentation" → "Adaptive response", which branches to "B-cell / antibody response" and "T-cell response", both arrows ending at "Memory cells".
High schoolPublication schematic
Use this example
Prompt
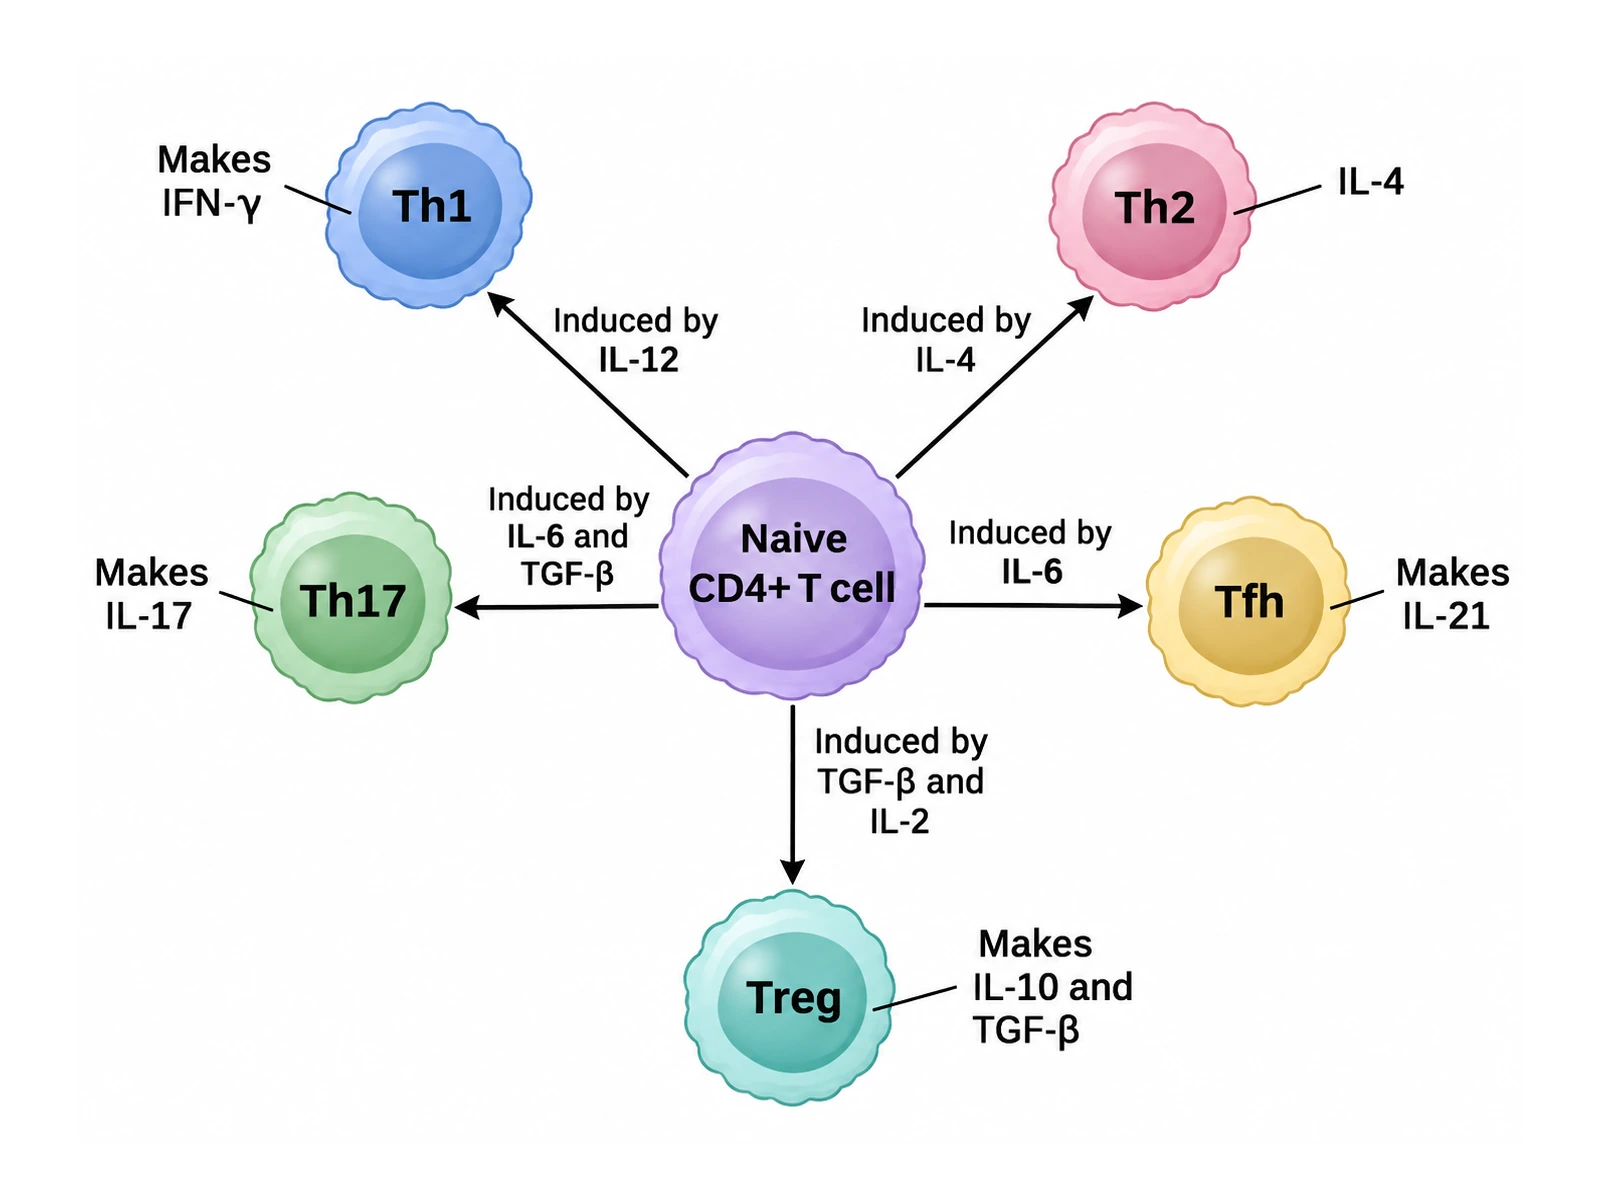
Create a helper T-cell subsets diagram on a white background: a "Naive CD4+ T cell" in the centre with five arrows to rounded cells, each arrow labeled with what induces it and each cell labeled with what it makes: "Th1" (induced by IL-12; makes IFN-γ), "Th2" (induced by IL-4; makes IL-4, IL-5 and IL-13), "Th17" (induced by IL-6 and TGF-β; makes IL-17), "Tfh" (induced by IL-6 and IL-21; makes IL-21 and helps B cells), "Treg" (induced by TGF-β and IL-2; FOXP3+, makes IL-10 and TGF-β). One soft colour per subset.
Helper T-cell subsets
Use this example
Prompt
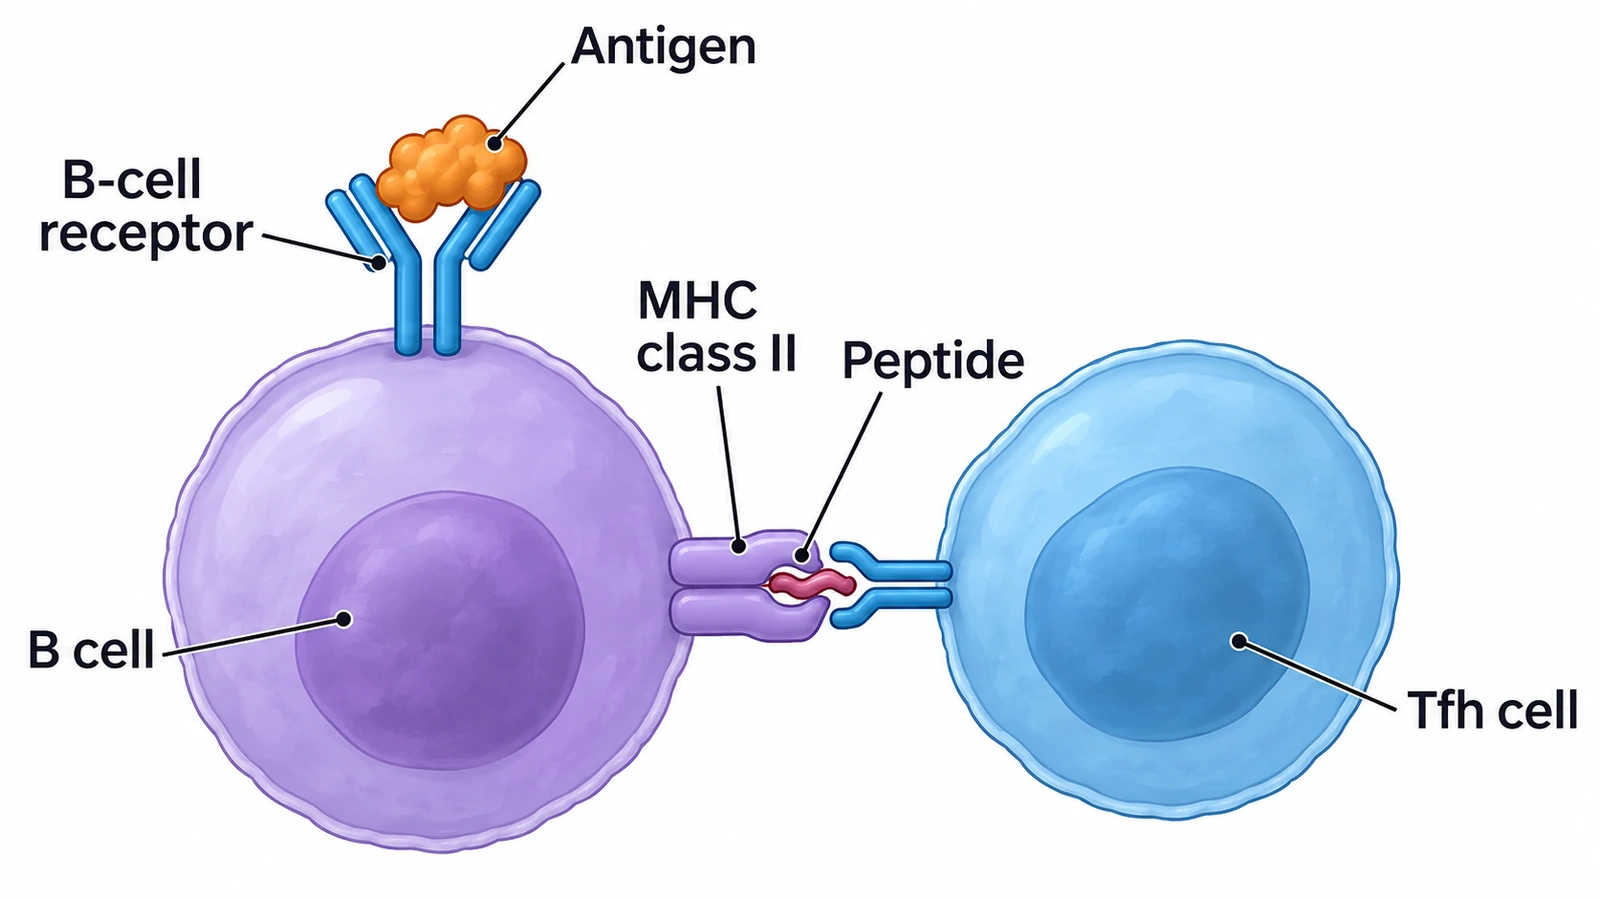
Create a textbook illustration of a B cell receiving T-cell help on a white background: on the left a "B cell" whose Y-shaped "B-cell receptor" binds an "Antigen"; on its right side "MHC class II" holds a "Peptide" from that antigen, which is recognised by the T-cell receptor of a "Tfh cell" on the right. Label each part with a thin leader line.
B cells and antibodies
Use this example
Prompt
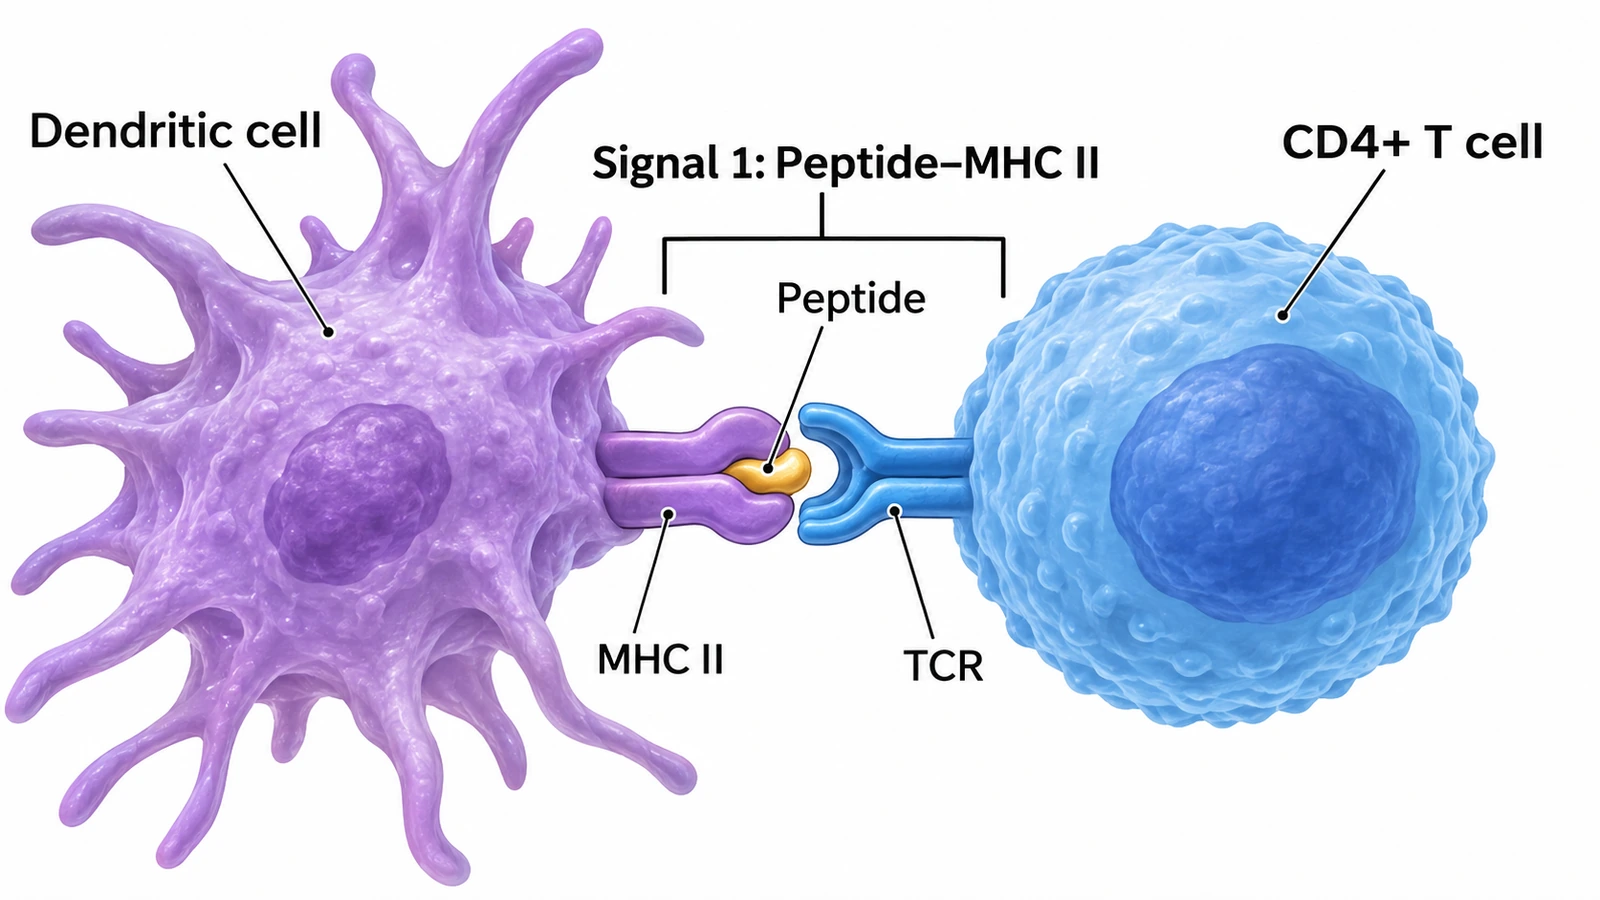
Create a textbook illustration of signal 1 of T-cell activation on a white background: a "Dendritic cell" on the left with long processes, a "CD4+ T cell" on the right, and between them "MHC II" holding a "Peptide" engaged by the "TCR", with a bracket labeled "Signal 1: Peptide–MHC II".
T-cell activationHigh school
Use this example
How to make an immune response diagram
1
Choose the topic, level, and style
The full response, innate vs adaptive, antigen presentation, T-cell activation, helper subsets, B cells and antibodies, or the primary vs secondary curve. Set the level from high school to research, then a textbook illustration or a publication schematic.
2
Generate the figure
The generator pairs MHC class I with CD8 and MHC class II with CD4, puts B7 on the antigen-presenting cell and CD28 on the T cell, draws antibodies only from plasma cells, and runs the arrows from innate to adaptive to memory.
3
Check the pairings, then export
Confirm each MHC class meets the right T cell, that the T cells carry TCRs rather than Y-shaped antibodies, and that the secondary response is the larger one. For a worksheet, make the answer key from the same result, then download the PNG.
Immune response key facts
MHC class I
Almost all nucleated cells → CD8 cytotoxic T cells
MHC class II
Dendritic cells, macrophages, B cells → CD4 helper T cells
Signal 1
Peptide–MHC binding the TCR (with CD4 or CD8)
Signal 2
B7 (CD80/CD86) on the APC binding CD28
Signal 3
Cytokines from the APC, e.g. IL-12
T-cell growth factor
IL-2, with its receptor chain CD25
Antibody structure
2 heavy + 2 light chains; Fab binds antigen, Fc binds receptors
First antibody made
IgM (pentamer)
Crosses the placenta
IgG
Best priming APC
Dendritic cell, in the lymph node
What an immune response diagram shows
An immune response is the chain of events by which the body recognizes something foreign, such as a bacterium, a virus or a toxin, and removes it. An immune response diagram lays that chain out in order: which cells meet the invader first, how information about it reaches the lymph nodes, which lymphocytes are activated, what they do, and what is left behind to protect against the next encounter.
Almost every version has the same skeleton. The innate response acts first, at the site of infection. Antigen-presenting cells, above all dendritic cells, carry the invader’s antigens to a lymph node and show them to T cells. The adaptive response then splits into two arms, T cells and B cells, which clear the infection, and memory cells remain afterwards. Get that skeleton and its pairings right, and the details fit around it.
The innate immune response
Barriers: skin, mucous membranes, mucus, cilia, stomach acid and antimicrobial proteins such as lysozyme keep most microbes out.
Recognition: innate cells use pattern recognition receptors, such as toll-like receptors, to detect molecular patterns shared by many microbes (PAMPs), like bacterial cell-wall components or viral RNA.
Phagocytes: neutrophils arrive first and in large numbers; macrophages engulf microbes and dead cells and release cytokines.
Inflammation: mast cells and macrophages release histamine and cytokines that widen blood vessels and make them leaky, giving redness, heat, swelling and pain, and bringing more cells in.
Complement: blood proteins that coat microbes for phagocytosis, attract phagocytes, and can punch holes in some bacteria.
Natural killer cells and interferons: NK cells kill virus-infected cells that have lost MHC class I; interferons put neighbouring cells into an antiviral state.
Antigen presentation: MHC class I and class II
T cells cannot see a pathogen directly. They see peptides from it, displayed on MHC molecules (called HLA in humans), and the class of MHC tells the T cell what kind of problem it is looking at.
MHC class I: on almost every nucleated cell. It displays peptides from proteins made inside the cell, cut by the proteasome and carried into the endoplasmic reticulum by TAP. A virus-infected or cancerous cell displays foreign peptides on MHC I and is recognized by CD8 cytotoxic T cells.
MHC class II: on antigen-presenting cells, meaning dendritic cells, macrophages and B cells. It displays peptides from material the cell has engulfed and digested in endosomes, and is recognized by CD4 helper T cells.
The co-receptor seals the match: CD8 binds MHC class I and CD4 binds MHC class II, the rule of eight (1 × 8 = 2 × 4).
Cross-presentation: dendritic cells can also put peptides from engulfed material onto MHC class I, which lets them prime CD8 T cells against viruses that do not infect dendritic cells.
T-cell activation: the three-signal model
A naive T cell needs more than antigen to respond, a safeguard against attacking the body’s own tissues. In the lymph node, a dendritic cell that has picked up antigen at a site of infection gives it three signals. Signal 1: its peptide–MHC is recognized by the T cell’s receptor and CD4 or CD8 co-receptor. Signal 2: its B7 molecules, CD80 and CD86, which it makes after sensing microbes, bind CD28 on the T cell. Signal 3: its cytokines, such as IL-12, tell the T cell what kind of effector to become.
With all three, the T cell makes the cytokine IL-2 and the high-affinity IL-2 receptor chain CD25, and divides repeatedly into a clone of thousands of identical cells: clonal expansion. Signal 1 without signal 2 leaves the T cell unresponsive (anergic). The brakes come later: activated T cells express CTLA-4, which binds B7 more strongly than CD28 does, and PD-1, and blocking these checkpoints is the basis of several cancer immunotherapies.
Helper T-cell subsets
CD4 helper T cells become different kinds of effector depending on the cytokines around them when they are activated. A subset diagram is one of the most common diagrams of T cells in immunology courses.
Th1: induced by IL-12; make interferon-γ; activate macrophages to kill microbes living inside them, such as mycobacteria.
Th2: induced by IL-4; make IL-4, IL-5 and IL-13; drive defense against parasitic worms, IgE production and allergy.
Th17: induced by IL-6 and TGF-β; make IL-17; recruit neutrophils against extracellular bacteria and fungi; involved in some autoimmune diseases.
T follicular helper (Tfh): make IL-21 and carry CD40 ligand; help B cells in germinal centers switch class and improve affinity.
Regulatory T cells (Treg): marked by the transcription factor FOXP3 and CD25; make IL-10 and TGF-β; suppress other T cells and prevent autoimmunity.
Cytotoxic T cells and cell-mediated immunity
Activated CD8 T cells leave the lymph node and patrol the body. When one recognizes its peptide on MHC class I on an infected or cancerous cell, it forms a tight contact, the immunological synapse, and releases perforin and granzymes into it. Granzymes switch on the target’s caspases, so the target dies by apoptosis, cleanly and without releasing its virus. Cytotoxic T cells can also use Fas ligand to trigger the target’s death receptors. Together with Th1-activated macrophages, this is cell-mediated immunity: the arm that deals with pathogens hiding inside cells.
B-cell activation and antibody production
A naive B cell carries membrane IgM and IgD as its antigen receptor and binds intact antigen, in its native shape, with no MHC involved.
For protein antigens, the B cell internalizes the antigen and presents its peptides on MHC class II. A T follicular helper cell that recognizes the same antigen gives CD40 ligand and cytokines, the help the B cell needs.
Helped B cells proliferate, many of them in germinal centers in the lymph node, where somatic hypermutation and selection improve antibody affinity and class switching changes IgM to IgG, IgA or IgE.
The B cells become plasma cells, short-lived or long-lived antibody factories packed with endoplasmic reticulum, and memory B cells.
Some antigens with repeating units, such as bacterial capsule polysaccharides, activate B cells without T-cell help; they give mostly IgM and weak memory, which is why such vaccines are conjugated to a protein.
Antibody structure and the five classes
Every antibody is built from two identical heavy chains and two identical light chains held together by disulfide bonds into a Y. The tips of the two arms, the variable regions of the Fab fragments, form the two antigen-binding sites; the stem, the Fc region, decides what the antibody does by binding Fc receptors on cells and the complement protein C1q.
IgM: a pentamer of five units with a J chain; the first antibody in a primary response; very good at activating complement.
IgG: a monomer; the most abundant antibody in blood and the main antibody of the secondary response; crosses the placenta and protects the newborn.
IgA: a dimer in secretions such as mucus, saliva, tears and breast milk; guards mucosal surfaces.
IgE: a monomer that binds mast cells and basophils; triggers allergic reactions and fights parasitic worms.
IgD: a monomer found mainly on the surface of naive B cells, alongside IgM, as part of the antigen receptor.
What antibodies do
Neutralization: antibodies cover the parts of viruses and toxins that bind host cells.
Opsonization: antibody-coated microbes are grabbed and eaten by phagocytes through Fc receptors.
Complement activation: antibodies bound to a microbe start the classical complement pathway.
Agglutination: each antibody has two or more binding sites and can link microbes into clumps.
Antibody-dependent cell-mediated cytotoxicity (ADCC): natural killer cells recognize antibody-coated cells through Fc receptors and kill them.
Primary and secondary immune responses
The first time the body meets an antigen, only a handful of lymphocytes can recognize it. They have to be found, activated and expanded, so there is a lag of several days before antibody appears. IgM comes first, IgG follows, and the response peaks roughly one to two weeks after exposure, then declines.
The next exposure to the same antigen meets a much larger population of memory B and T cells that are easier to activate. The lag is shorter, antibody levels climb far higher, the antibody is mostly IgG, its affinity is higher after germinal-center selection, and levels stay up longer. A new antigen given at the same moment still gets only a primary response, which shows that memory is specific. This is the logic behind vaccine schedules and booster doses, and the curve in the examples above is the classic way to draw it.
Humoral vs cell-mediated immunity
Older textbooks divide the adaptive response into two arms, and many exams still ask for the comparison. Humoral immunity is carried out by antibodies in blood and body fluids, made by plasma cells; it works best against microbes and toxins outside cells, and it can be transferred to another person in serum, as in maternal IgG crossing the placenta. Cell-mediated immunity is carried out by T cells themselves; cytotoxic T cells kill infected cells and Th1 cells activate macrophages, so it works against pathogens living inside cells. Helper T cells are needed by both arms, which is why losing CD4 T cells, as in untreated HIV infection, weakens the whole adaptive response.
Active and passive immunity
Naturally acquired active immunity: recovering from an infection leaves memory cells.
Artificially acquired active immunity: a vaccine trains the adaptive response and leaves memory without the disease.
Naturally acquired passive immunity: maternal IgG across the placenta and IgA in breast milk protect a newborn for months, without memory.
Artificially acquired passive immunity: injected antibodies, such as antivenom or monoclonal antibodies, act at once but fade within weeks.
How to draw an immune response diagram
Work left to right in time. Put the site of infection on the left, with a barrier, the pathogen, neutrophils and macrophages, and a dendritic cell taking up antigen. Draw a lymphatic vessel carrying the dendritic cell to a lymph node in the centre, where it meets a CD4 helper T cell (MHC class II) and a CD8 cytotoxic T cell (MHC class I). Split the right-hand side into two rows: the B-cell row, with a helped B cell becoming plasma cells and antibodies, and the T-cell row, with a cytotoxic T cell killing an infected cell. End both rows at memory cells.
Then check the logic. Every MHC molecule should be paired with the right co-receptor, every Y-shaped antibody should come from a plasma cell or sit on a B cell, every activation arrow should point from the presenting cell to the lymphocyte, and the innate response should come before the adaptive one. Give each cell type one colour and use it everywhere it appears, and keep text to names, not sentences.
Most common immune response diagram mistakes
These are the errors that appear most often in student drawings, online images, and AI output. Check each one before the figure goes into a lecture, a paper, or graded work.
MistakeCorrect
MistakeMHC class II presenting to a CD8 T cell, or MHC class I to a CD4 T cell
CorrectMHC I → CD8 cytotoxic T cell; MHC II → CD4 helper T cell
MistakeY-shaped antibodies drawn on a T cell, or secreted by T cells
CorrectT cells carry a two-chain TCR; plasma cells (from B cells) secrete antibodies
MistakeThe TCR binding a whole bacterium or a free protein
CorrectThe TCR binds a short peptide held in an MHC molecule
MistakeCD28 on the antigen-presenting cell and B7 on the T cell
CorrectB7 (CD80/CD86) on the APC binds CD28 on the T cell
MistakeActivation arrows pointing from the T cell to the APC
CorrectSignals 1, 2 and 3 run from the APC to the naive T cell
MistakeMHC class II drawn on every body cell
CorrectMHC II is on antigen-presenting cells; MHC I is on almost all nucleated cells
MistakeThe secondary response drawn smaller, slower, or mostly IgM
CorrectThe secondary response is faster, higher, longer and mostly IgG
MistakeAntigen bound to the stem of the antibody
CorrectAntigen binds the tips of the two Fab arms; the stem is the Fc region
Innate vs adaptive immune response
The comparison most courses ask for first, and the frame for every immune response diagram.
Innate immunity
Adaptive immunity
Speed
Minutes to hours
Days on first exposure; faster on re-exposure
Specificity
Broad patterns shared by groups of microbes
One specific antigen per lymphocyte clone
Receptors
Fixed, inherited (e.g. toll-like receptors)
TCRs and BCRs made by gene rearrangement
Main cells
Neutrophils, macrophages, dendritic cells, NK cells, mast cells
T cells (CD4, CD8), B cells and plasma cells
Soluble molecules
Complement, interferons, acute-phase proteins
Antibodies
Memory
None in the classic sense
Memory B and T cells
Diversity
Limited
Enormous: millions of different receptors
Link between them
Dendritic cells present antigen and give costimulation
Antibodies and T-cell cytokines boost innate killing
Immune Response Diagram FAQ
It shows how the body recognizes and removes a pathogen, step by step. A complete immune response diagram starts with the innate response (barriers, phagocytes, inflammation, complement), shows antigen-presenting cells carrying the pathogen’s antigens to the lymph nodes, and then splits into the two arms of the adaptive response: helper and cytotoxic T cells on one side, B cells, plasma cells and antibodies on the other. It ends with memory cells, which make the next response to the same antigen faster and stronger.
Generate signaling pathways, lymphatic system and cell diagrams, blank labeling worksheets with matching answer keys, and publication-ready immunology figures with the same SciFigure AI workflow.