
Free ERD generator online
ER diagram generator for database design in crow’s foot notation
Describe the tables of a database, a lab sample tracker or a clinical study, and get an exact entity-relationship diagram: entities with typed attributes and PK, FK and UK keys, crow’s foot cardinality at both ends of every relationship, and solid or dashed lines for identifying and non-identifying relationships. Type it as text or build it from forms. Free, private, with SVG, PNG and PDF export.
Everything runs in your browser: nothing is uploaded, and the diagram is drawn exactly from your code. Undo with Ctrl+Z.
Step by step
How to make an entity relationship diagram
Six steps from a list of things to a normalised schema, for a lab sample tracker, a study database or a database course.
- 1
List the entities
Write down the things you need to keep data about, as singular nouns: PROJECT, SAMPLE, ALIQUOT, FREEZER. Each becomes a table.
- 2
Give each entity its attributes and a key
Inside each entity, one line per attribute: type, name, then PK for the primary key. Use a key that never changes, such as a generated sample_id rather than a barcode that may be reprinted.
- 3
Connect related entities
For each pair that is related, write one relationship line with a verb phrase: PROJECT ||..o{ SAMPLE : collects. Read it both ways to choose the ends.
- 4
Set the cardinality at both ends
Ask “for one PROJECT, how many SAMPLEs?” (zero or many: o{) and “for one SAMPLE, how many PROJECTs?” (exactly one: ||). The inner mark is the minimum, the outer mark the maximum.
- 5
Add foreign keys and resolve many-to-many
The entity on the “many” side carries the foreign key (FK). A many-to-many pair, such as SAMPLE and ASSAY, gets a linking entity whose key combines both keys.
- 6
Check and export
Check that every attribute depends on the key, the whole key and nothing but the key (third normal form), then download SVG or PDF for a report, or PNG for slides.
Templates
ER diagram examples to start from
Seven complete schemas: lab samples, a reagent inventory, a clinical trial, an EER supertype with subtypes and three classics. Open one in the editor and adapt the entities and keys.
Notation reference
ER diagram symbols: crow’s foot, keys and Chen equivalents
Every crow’s foot symbol, what it means and how to write it here, with the Chen notation symbols for comparison. Add puts a working example into the LIMS sample diagram.
| Symbol | Element and meaning | Code in this tool |
|---|---|---|
Entity with attributes A table: its name, then one row per attribute with type, name and keys. | SAMPLE {
int sample_id PK
int project_id FK
} | |
| PK FK UK | Keys Primary key, foreign key and unique key, after the attribute name; PK, FK for both. | int sample_id PK, FK |
Exactly one Minimum one, maximum one: mandatory and single. | || | |
Zero or one Minimum zero, maximum one: optional and single. | |o o| | |
One or many Minimum one, no maximum: mandatory and multiple. | }| |{ | |
Zero or many Minimum zero, no maximum: optional and multiple. | }o o{ | |
Identifying relationship Solid line: the parent’s key is part of the child’s key (weak entity). | A ||--|{ B : label | |
Non-identifying relationship Dashed line: the child has its own key and refers to the parent by a foreign key. | A ||..o{ B : label | |
| A ⟷ B | Associative (linking) entity Resolves a many-to-many relationship; its key combines both keys. | A ||--o{ A_B : has
B ||--o{ A_B : has |
Chen: entity A rectangle; a double rectangle for a weak entity. | Chen notation, not drawn here. Write it as an entity block. | |
Chen: relationship A diamond named with a verb, with 1, N or M on its lines. | Write it as one relationship line with crow’s foot ends. | |
Chen: attribute An oval joined to its entity; the key attribute is underlined. | Write it as an attribute line inside the entity; the underlined one gets PK. |
Common mistakes
Six ER diagram mistakes and their fixes
Cardinality ends swapped
WrongPROJECT }o..|| SAMPLE : collects, meaning each project has exactly one sample.
RightThe mark next to an entity says how many of that entity: PROJECT ||..o{ SAMPLE. Read both sentences aloud before you trust a line.
An unresolved many-to-many
WrongSAMPLE }o..o{ ASSAY : "is tested in", with the result nowhere to go.
RightAdd SAMPLE_ASSAY with sample_id and assay_id as its key, and put the result there.
Repeating attributes
WrongPARTICIPANT with visit1_date, visit2_date, visit3_date.
RightA VISIT entity with participant_id and visit_no as its key: one row per visit, any number of visits (first normal form).
The foreign key on the wrong side
WrongPROJECT holding sample_id, so a project can point at only one sample.
RightThe “many” side holds the foreign key: SAMPLE.project_id.
A changeable value as the primary key
Wrongbarcode PK on SAMPLE, then a damaged label is reprinted with a new barcode.
RightA generated sample_id PK, with barcode marked UK so it stays unique but can be corrected.
Plural or verb names for entities
WrongEntities called SAMPLES, Register or Storing.
RightSingular nouns for entities (SAMPLE), verb phrases for relationships (BOX stores ALIQUOT).
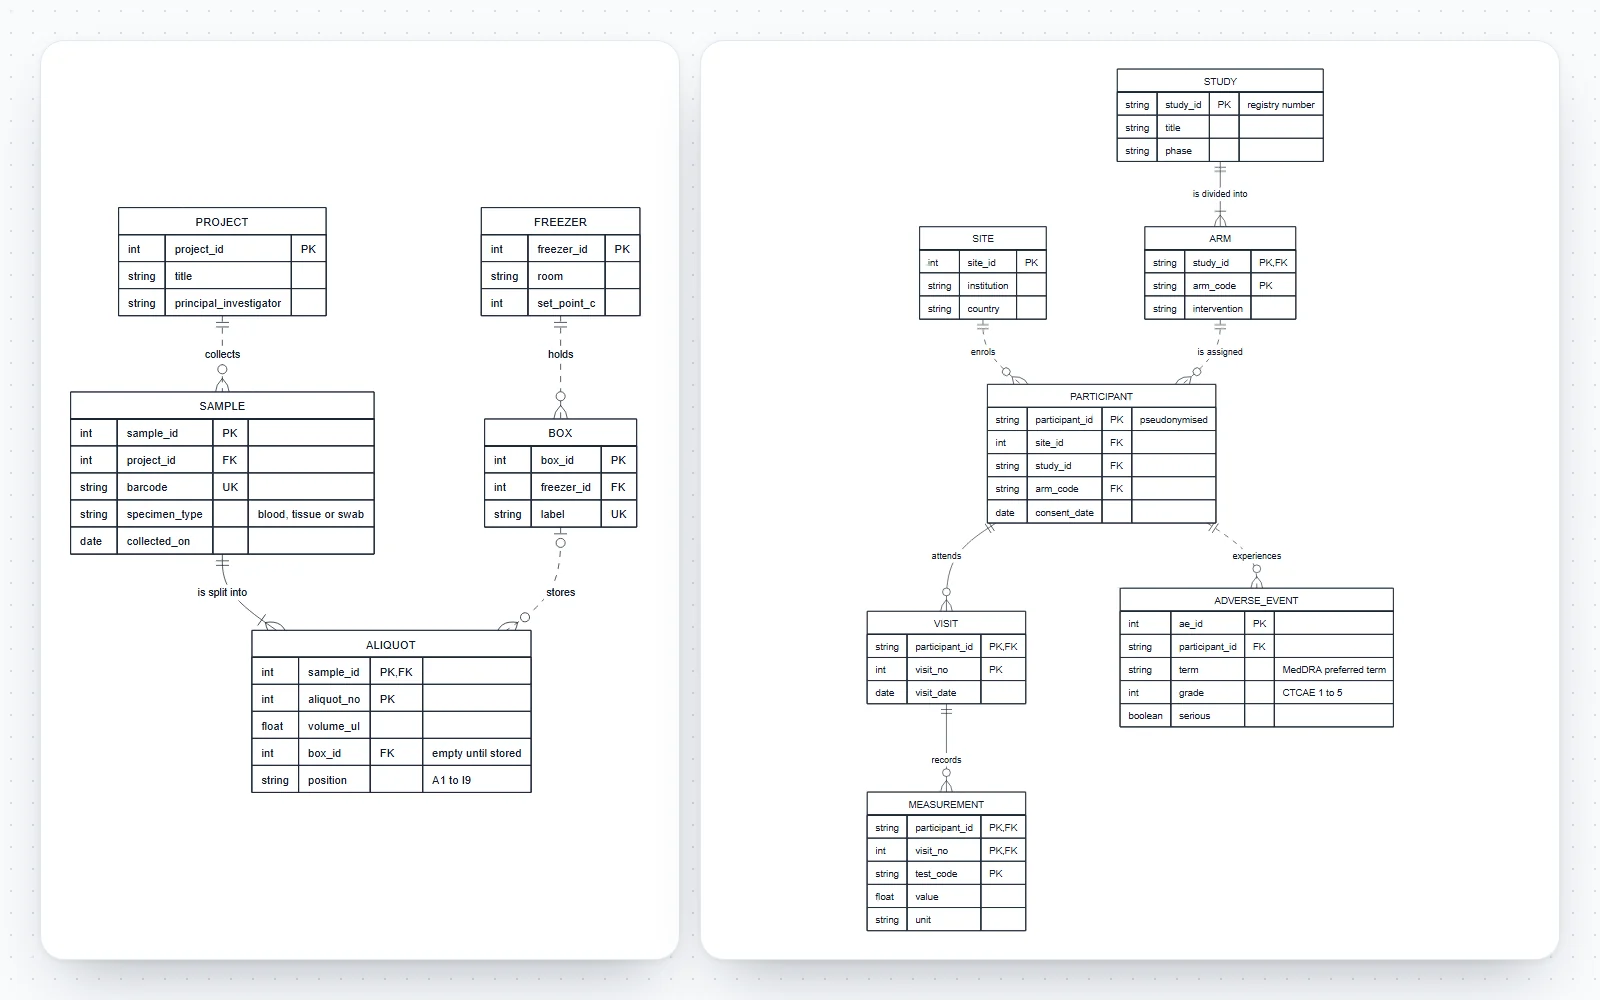
How this entity relationship diagram generator works
Write entities and relationships as short lines of code, or add them from forms; the diagram is redrawn as you type and every change can be undone.
- Code tab: one relationship per line and one block per entity, with line numbers and plain-English error messages that point at the line to fix.
- Build tab: add an entity with all its attributes at once, add an attribute inside an existing entity, add a relationship by choosing each end from a list (exactly one, zero or one, one or many, zero or many), or resolve a many-to-many pair with a linking entity in one click.
- Style tab: top-to-bottom or left-to-right layout, a right-angled line style, four figure styles and the text size.
- Seven templates: a LIMS sample tracker, a reagent inventory, a clinical trial data model, a specimen supertype with subtypes, students and courses, online orders and hospital appointments.
- Saved in your browser as you work; nothing is uploaded and there is no account.
What is an entity-relationship diagram?
An entity-relationship diagram (ERD) shows the data a system stores: the entities, the attributes that describe them and the relationships between them. Peter Chen introduced the entity-relationship model in 1976 as a way to describe data independently of how a database stores it.
- An entity is a kind of thing with its own identity, about which you keep data: a sample, a participant, a freezer. Each row of the table is one instance.
- An attribute is a property of an entity: a barcode, a collection date, a volume. In a physical model each has a data type.
- A relationship is a meaningful link between entities, named with a verb phrase: a project collects samples; a box stores aliquots.
- Conceptual models show only entities and relationships, logical models add attributes and keys, and physical models add the exact types and tables of one database system. The templates here are logical-to-physical.
Crow’s foot notation: reading the four relationship ends
Each end of a relationship line carries two marks: the one nearer the entity is the maximum (one or many), the one further away is the minimum (zero or one). Together they give four ends.
- Exactly one (two bars, ||): mandatory and single. Each SAMPLE belongs to exactly one PROJECT.
- Zero or one (a circle and a bar, |o or o|): optional and single. An ALIQUOT is in zero or one BOX, because it is not stored until it is placed.
- One or many (a bar and a crow’s foot, }| or |{): mandatory and multiple. Each SAMPLE is split into at least one ALIQUOT.
- Zero or many (a circle and a crow’s foot, }o or o{): optional and multiple. A PROJECT may have collected no samples yet.
- Read the line in both directions: “each PROJECT collects zero or many SAMPLEs” and “each SAMPLE is collected by exactly one PROJECT”. Writing both sentences catches most cardinality mistakes.
Primary, foreign, unique and composite keys
Keys are what make the relationships work in a relational database, and they are marked after the attribute name.
- PK, primary key: identifies each row and never changes. A generated number (sample_id) is safer than a natural value (barcode) that may be corrected or reprinted.
- FK, foreign key: holds the primary key of a related row. It sits on the “many” side: SAMPLE.project_id points at PROJECT.
- UK, unique key: another value that must be unique but is not the identifier, such as a barcode or an email address.
- Composite key: two or more attributes that are the key together. ALIQUOT is identified by sample_id and aliquot_no, both marked PK, and sample_id is also FK.
- Comments in quotes after the keys explain units, allowed values or why a value may be empty: int box_id FK "empty until stored".
Identifying vs non-identifying relationships
The line style says whether the child entity needs its parent to be identified. Here a solid line (--) is identifying and a dashed line (..) is non-identifying.
- Identifying: the parent’s key is part of the child’s primary key. An ALIQUOT is aliquot 2 of sample 1043; without the sample it has no identity. Such a child is also called a weak entity.
- Non-identifying: the child has its own key and only refers to the parent through a foreign key. A SAMPLE has its own sample_id and points at its PROJECT.
- A non-identifying relationship can be mandatory (||..o{, the foreign key must be filled) or optional (|o..o{, the foreign key may be empty).
- Most relationships in a design with generated keys are non-identifying. Identifying relationships appear for line items, visits within a participant, measurements within a visit and subtypes that share their supertype’s key.
Chen notation vs crow’s foot notation
Both draw the same model. Chen’s original notation is still taught for conceptual design; crow’s foot is the notation of most database tools and of this generator.
- Chen: entities are rectangles, relationships are diamonds named with a verb, attributes are ovals joined to their entity, key attributes are underlined, and weak entities have a double border. Cardinality is written as 1, N or M on the lines.
- Crow’s foot (also called information engineering notation, usually credited to Gordon Everest in 1976): attributes are listed inside the entity box, a relationship is a single named line, and the line ends show minimum and maximum cardinality.
- Chen diagrams grow large quickly because every attribute is a separate shape, so they suit small teaching examples. Crow’s foot diagrams stay compact and map directly onto tables.
- This tool draws crow’s foot only. To turn a Chen diagram into code here, write each rectangle as an entity block, each oval as an attribute line (underlined ones get PK) and each diamond as a relationship line with its 1, N or M turned into crow’s foot ends.
Many-to-many relationships and associative entities
A relational database cannot store a many-to-many relationship directly. It needs a linking table, drawn as an associative entity.
- A student takes many courses and a course has many students. The ENROLMENT entity holds one row per student per course, with student_id and course_code as its composite key.
- The associative entity often carries attributes of its own that belong to the pair: the grade of an enrolment, the quantity and price of an order line, the result of a sample in an assay.
- Resolve many-to-many in the Build tab: pick the two entities and name the linking entity; the relationships and the composite key are written for you.
Normalization basics: first, second and third normal form
Normalization, introduced by Edgar F. Codd with the relational model, removes the redundancy that lets the same fact be stored twice and drift apart.
- First normal form (1NF): every attribute holds one value. Not result_1, result_2, result_3 in one row, and not a comma-separated list of tests: put repeating values in their own entity.
- Second normal form (2NF): with a composite key, every attribute depends on the whole key. In MEASUREMENT (participant, visit, test), the participant’s birth date depends on the participant only, so it belongs in PARTICIPANT.
- Third normal form (3NF): no attribute depends on another non-key attribute. If SAMPLE stores freezer_id and freezer_room, the room depends on the freezer, so it belongs in FREEZER.
- Reporting databases are sometimes denormalised on purpose for speed; do that knowingly and keep the normalised model as the source.
EER diagrams: supertypes, subtypes and specialization
The enhanced (extended) ER model adds specialization: a supertype entity whose instances belong to one or more subtypes, each with attributes of its own.
- A SPECIMEN is either a BLOOD_SPECIMEN (anticoagulant, volume) or a TISSUE_SPECIMEN (organ, fixative), and every specimen has an ID and a collection date.
- EER notation marks whether subtypes are disjoint or overlapping and whether every supertype instance must belong to a subtype (total) or not (partial).
- In crow’s foot, the usual implementation is one table per subtype that shares the supertype’s primary key: SPECIMEN ||--o| BLOOD_SPECIMEN : "is a". The subtypes template shows this pattern; write the disjoint or total rule in an attribute comment, such as the specimen_kind discriminator.
ER diagrams for laboratory and clinical data
Most research data problems are data-model problems: a spreadsheet that mixes samples, aliquots and results in one sheet is a database waiting to be normalised.
- Sample tracking: projects collect samples, samples are split into aliquots, aliquots sit at a position in a box in a freezer. Chain of custody follows from the keys.
- Inventory: products from suppliers arrive in lots with expiry dates; every stock movement records who moved how much of which lot, and where.
- Clinical studies: participants are enrolled at sites and assigned to arms, attend numbered visits, have measurements at each visit and may have adverse events. Keep participant IDs pseudonymised and personal data in a separate, protected table.
- Draw the model before building the forms or the spreadsheet template, and share it with whoever will analyse the data.
ER diagram generator with AI: from a description or a schema
A chat assistant can draft entities from a description of your data or turn CREATE TABLE statements into the code shown under the editor. This page then draws the result exactly, so you can check it.
- Ask for lines in this format: an entity block with type name PK/FK/UK per attribute, and relationships such as PROJECT ||..o{ SAMPLE : collects.
- Review what an assistant cannot know: which relationships are optional, which keys are natural and which generated, and whether a many-to-many has been resolved.
- The drawing contains exactly what the code says; nothing is added or guessed, and errors are reported with their line number.
An exact, editable ERD generator online
Every entity, attribute and relationship you write appears once, with its keys and cardinality as written.
- The code is the Mermaid entity-relationship syntax, which GitHub and GitLab render in Markdown, so the diagram can live in the repository next to the database migrations it documents.
- Export SVG or PDF with real, editable text for a thesis, a data management plan or a design document, or PNG at 2× or 4× for slides.
Frequently asked questions
Is this ER diagram generator free?
Yes. No sign-up, no watermark and no limits on size or exports. It runs entirely in your browser, nothing you type is uploaded, and your diagram is saved on your device so it is still there next time.
How do I make an entity relationship diagram?
List the entities, give each an entity block with its attributes and primary key, then add one line per relationship with crow’s foot ends and a verb phrase, such as PROJECT ||..o{ SAMPLE : collects. The diagram redraws as you type. Or use the Build tab, where Add entity, Add attribute and Add relationship write the code for you.
What do the crow’s foot symbols mean?
At each end of a line, the mark nearer the entity is the maximum and the outer mark the minimum. Two bars mean exactly one, a circle and a bar zero or one, a bar and a crow’s foot one or many, and a circle and a crow’s foot zero or many.
What is the difference between Chen and crow’s foot notation?
Chen notation draws relationships as diamonds and attributes as ovals around each entity, with 1, N and M for cardinality. Crow’s foot lists attributes inside the entity box and shows cardinality with symbols at the line ends. They describe the same model; this tool draws crow’s foot.
What is an identifying relationship?
One where the parent’s key is part of the child’s primary key, so the child cannot be identified without its parent, like aliquot 2 of sample 1043. It is drawn with a solid line (--). A non-identifying relationship, drawn dashed (..), links a child that has its own key.
How do I show primary and foreign keys?
Write PK, FK or UK after the attribute name inside the entity block: int sample_id PK, int project_id FK, string barcode UK. An attribute that is both part of the key and a foreign key gets PK, FK.
How do I model a many-to-many relationship?
With an associative entity between the two: SAMPLE ||--o{ SAMPLE_ASSAY and ASSAY ||--o{ SAMPLE_ASSAY, with sample_id and assay_id as its composite key. The Resolve many-to-many button in the Build tab writes all of it.
Can I make an EER diagram with supertypes and subtypes?
Yes, in the crow’s foot form that databases use: each subtype shares the supertype’s key through a one-to-zero-or-one identifying relationship, as in the Supertype and subtypes template. The EER circle symbol for disjoint or overlapping specialization is not drawn; state the rule in an attribute comment.
Can I generate an ER diagram with AI?
You can ask a chat assistant to turn a description or CREATE TABLE statements into the code shown under the editor, then paste it here. The diagram is drawn exactly from that code and errors name their line, so you can check the keys and cardinalities before you rely on them.
What is the difference between an ER diagram and a UML class diagram?
An ER diagram models stored data: tables, columns, keys and cardinality. A class diagram models software objects: attributes and operations, inheritance and interfaces. For a database, draw an ER diagram; for the code that uses it, a class diagram.
What are 1NF, 2NF and 3NF?
First normal form: one value per attribute, no repeating groups. Second: every attribute depends on the whole of a composite key. Third: no attribute depends on another non-key attribute. Together they keep each fact in one place.
Does the code work in GitHub or GitLab?
Yes. The editor uses the Mermaid entity-relationship syntax, which GitHub and GitLab render in Markdown. Use More, then Copy as Markdown block, to paste it into a README or a pull request.
Which file format is best for a report or a data management plan?
SVG or PDF: they are vector formats with real text, sharp at any size and editable in Illustrator, Inkscape or PowerPoint. Use PNG at 2× or 4× for slides and web pages.
Related diagram tools
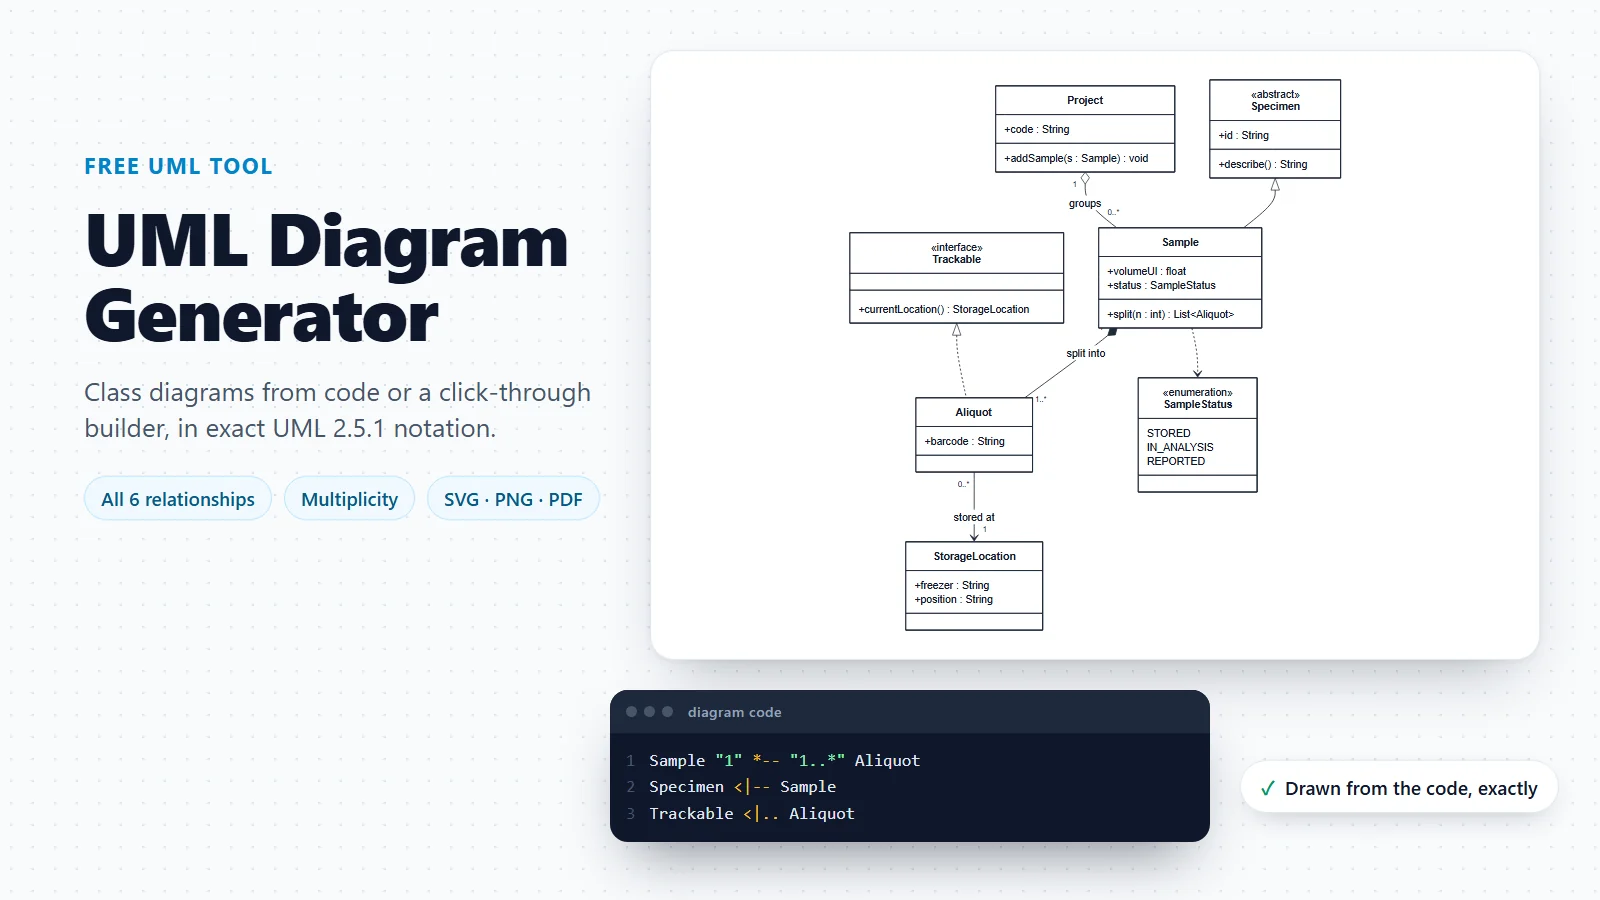
UML Diagram Generator
Class diagrams for the software around the database, with attributes, operations and every UML relationship.
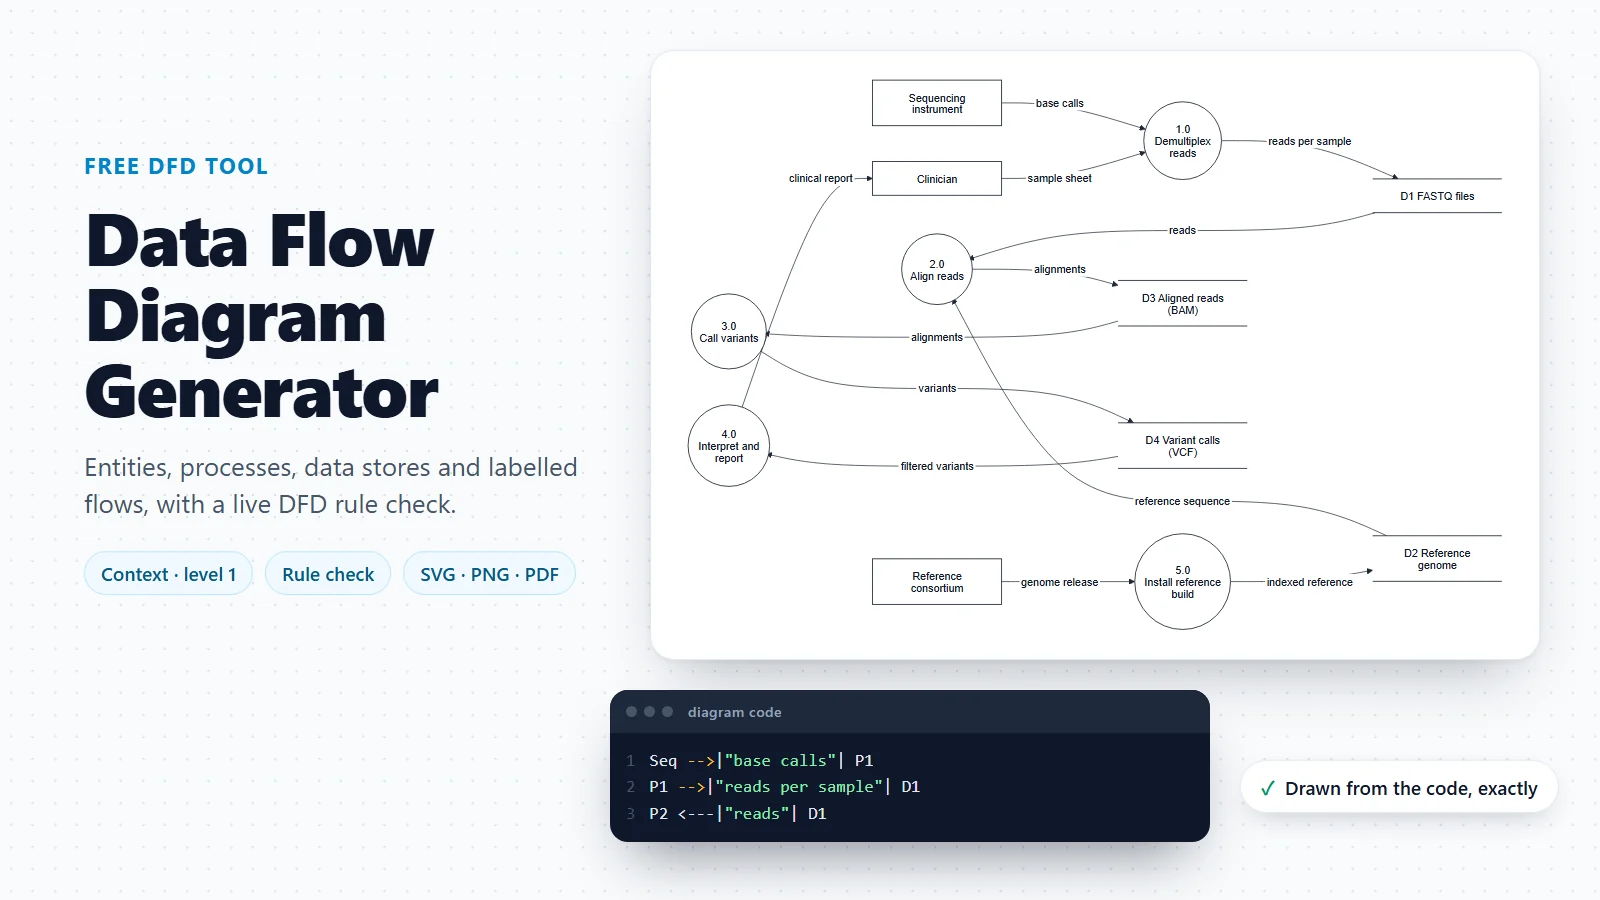
Data Flow Diagram Generator
Where the data comes from and goes: the data stores of a DFD become the entities of the ER model.
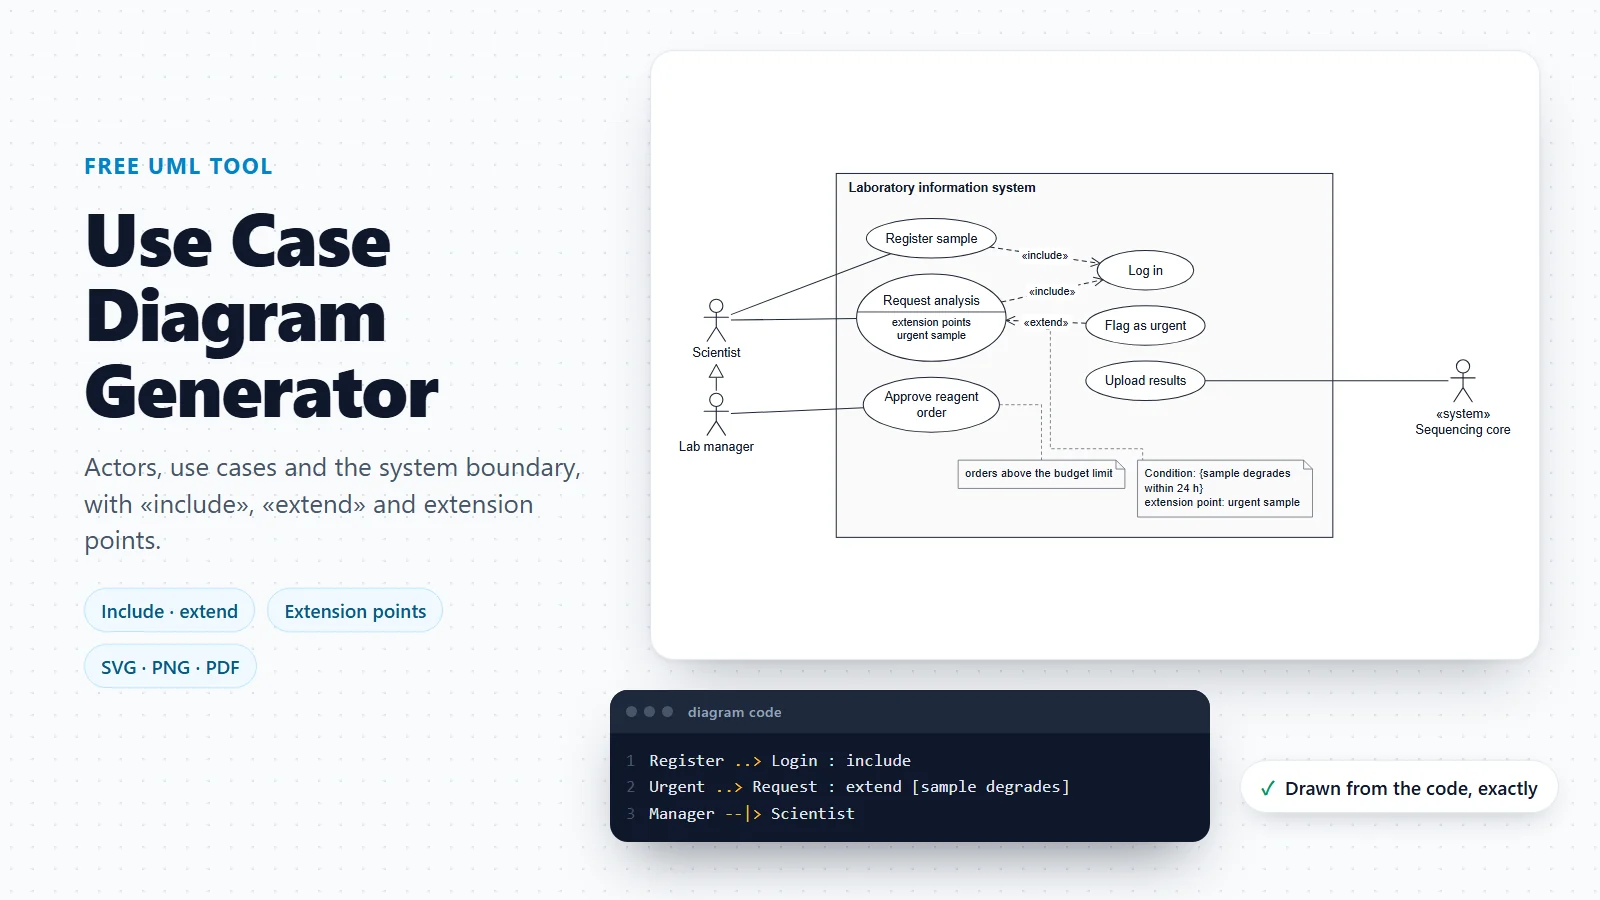
Use Case Diagram Generator
Who uses the system and for what, before you decide what data it has to keep.
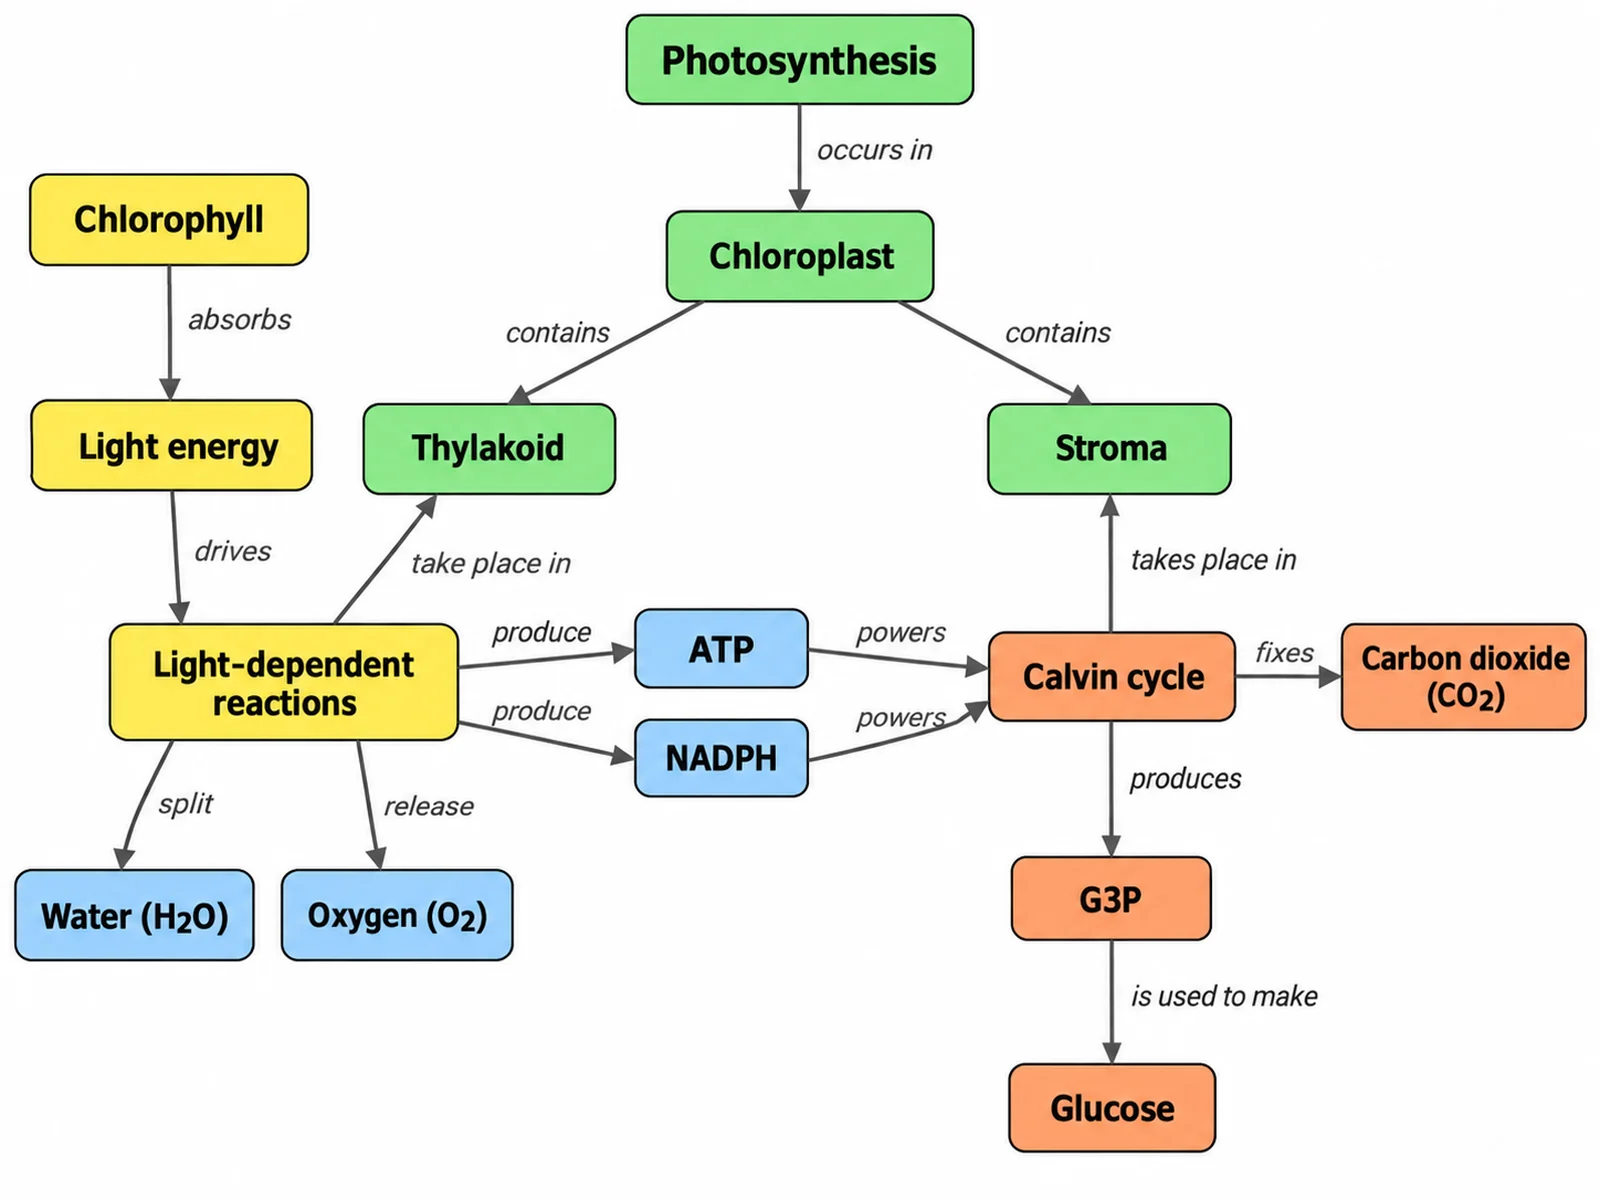
Concept Map Generator
A looser map of concepts and linking phrases, for the first sketch of a domain.
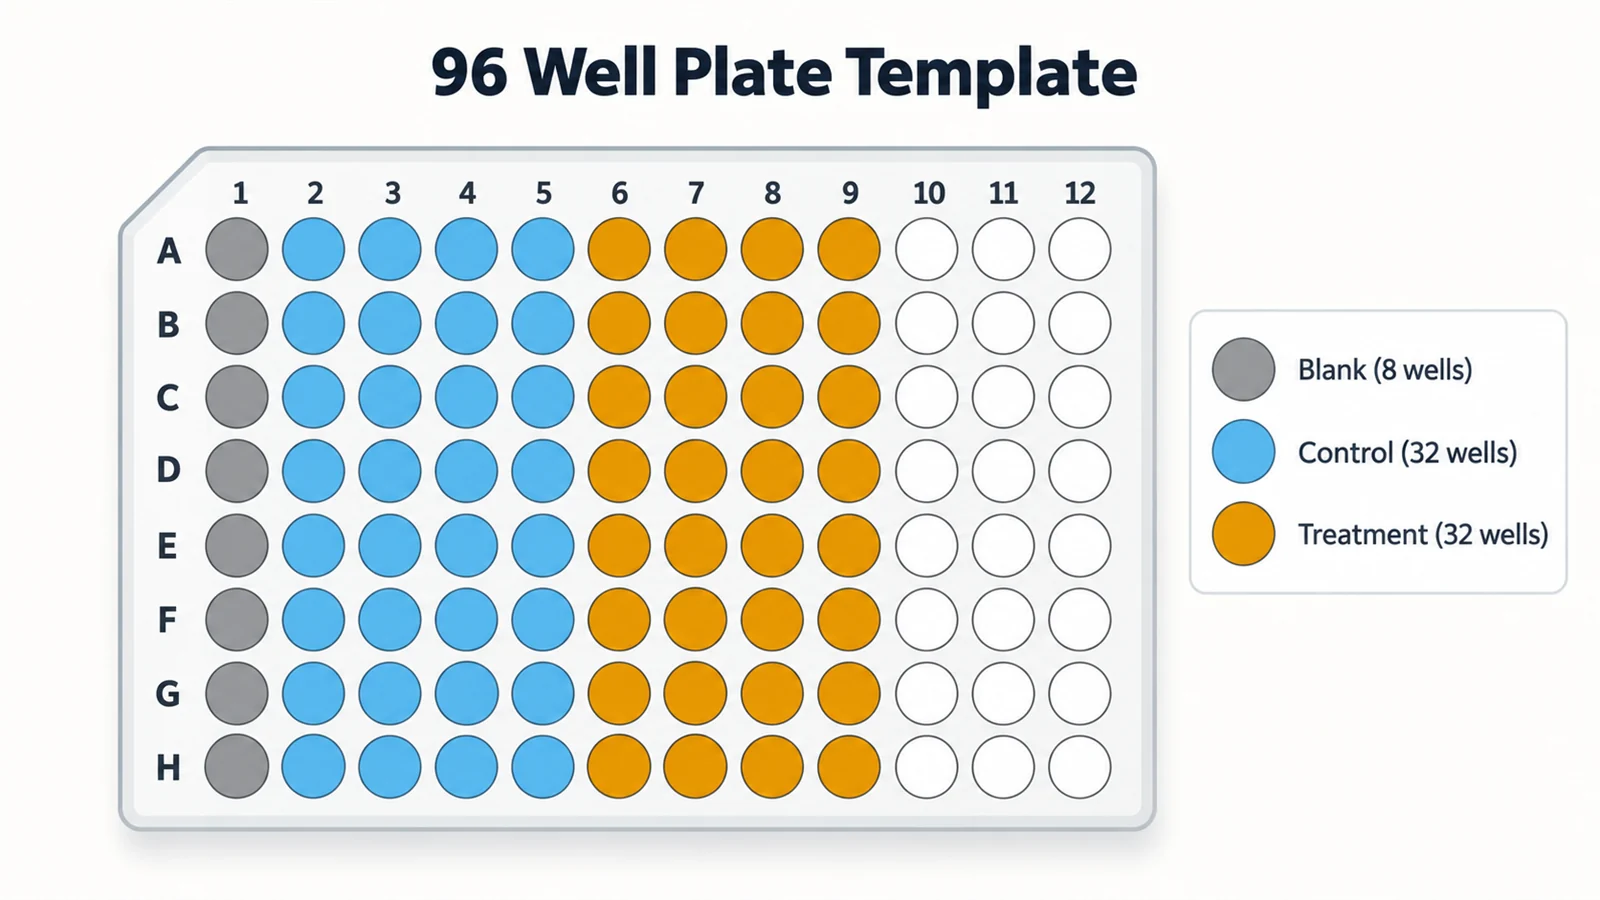
96-Well Plate Template
Plate layouts for the samples and aliquots a lab schema tracks.
Modelling the software rather than the tables?
When you need operations, inheritance and interfaces as well as data, a UML class diagram is the better fit. The UML diagram generator draws one from the same kind of code.
Open the UML diagram generatorLast checked: November 17, 2026. Sources: Chen, The entity-relationship model: toward a unified view of data, ACM Transactions on Database Systems 1(1), 1976; Codd, A relational model of data for large shared data banks, Communications of the ACM 13(6), 1970; Elmasri and Navathe, Fundamentals of Database Systems (Pearson), chapters on the ER and EER models and normalization; Mermaid entity relationship diagram syntax. The laboratory and clinical templates are illustrative models, not the schema of any real product or registry.