MA Plot Generator for Differential Expression Results

Plot every gene’s log2 fold change against its mean expression and see significance, noise, and normalization at once.

Upload DESeq2, edgeR, limma, or proteomics results. SciFigure detects whether the mean is on a count or log scale, colors genes by your adjusted p-values, keeps genes with no adjusted p-value apart, checks the trend line against zero, and draws a clean MA plot with the top genes labeled.

DESeq2, edgeR & limma columnsColors from your padj / FDRNormalization trend check

AI MA Plot Generator

Upload differential expression results and describe the plot.

Try sample data

Aspect ratio
297 / 2000 characters

Costs 5 credits. Significance calls, counts, and trend values are computed from your uploaded data, then drawn as a PNG.

Preview

MA Plot Examples

Aspect ratio: 16:9

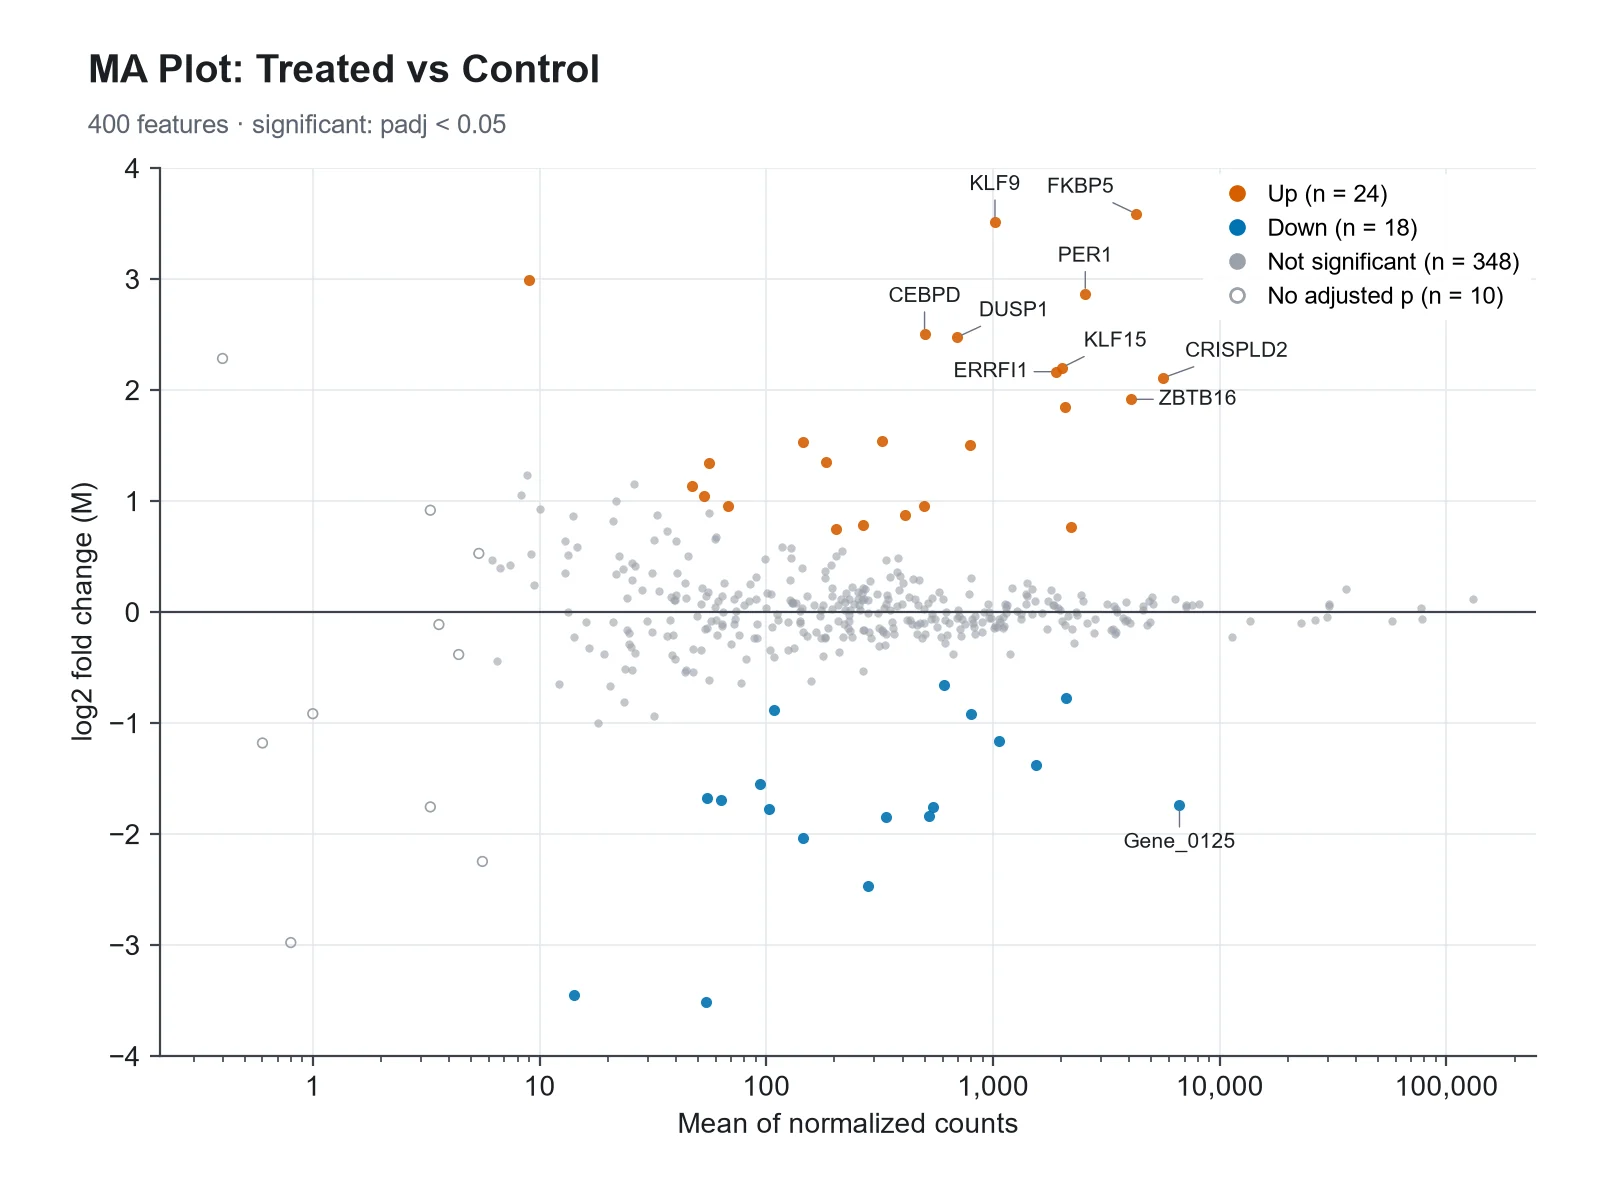
DESeq2 RNA-seq MA Plot MA plot example preview
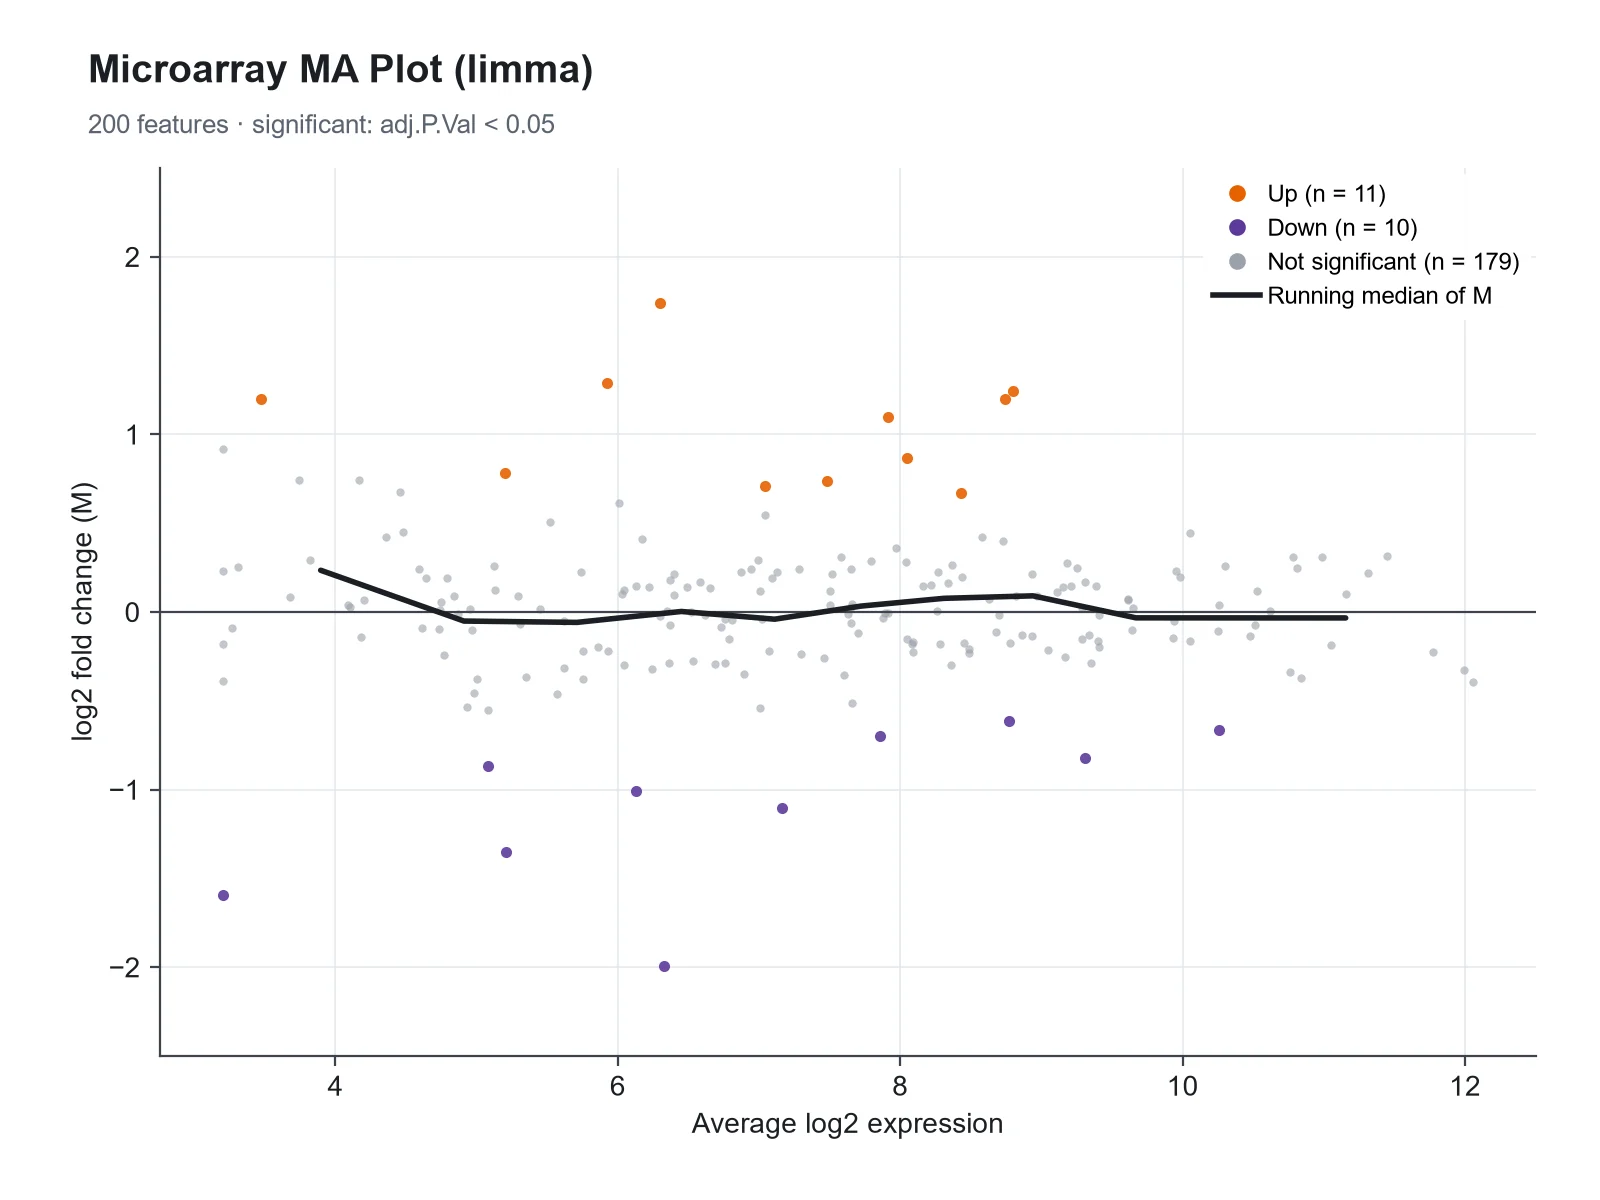
limma Microarray MA Plot MA plot example preview
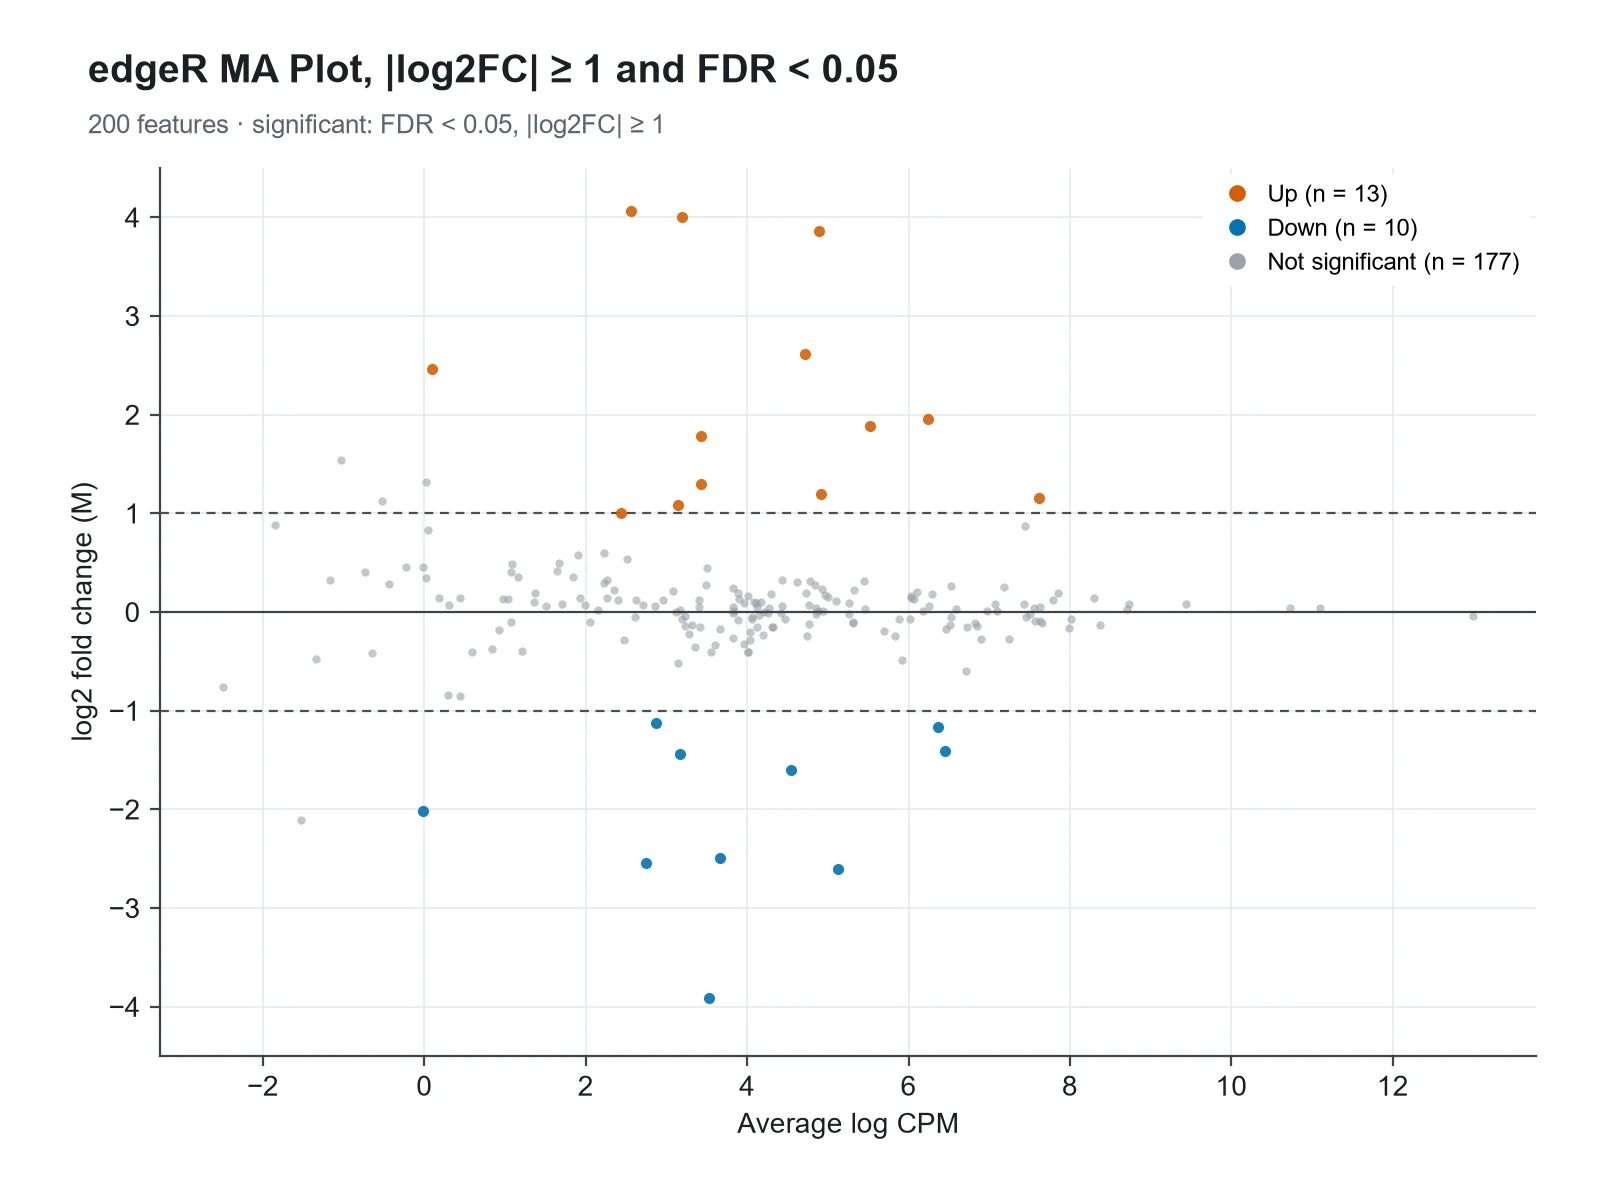
edgeR MA Plot with Fold-Change Lines MA plot example preview

These previews were drawn from the sample datasets. Load a sample or upload your own file to generate an MA plot.

MA plot examples

Each example was drawn from a sample dataset: DESeq2 RNA-seq results, a limma microarray analysis, edgeR results with a fold-change threshold, a two-color array before normalization, a proteomics comparison, and a highlighted gene set.

MA Plot Generator: DESeq2 RNA-seq MA Plot scientific chart example

Prompt

Based on the uploaded deseq2_results.csv file, create an MA plot with the mean of normalized counts on a log10 x-axis and log2 fold change on the y-axis. Color genes with padj < 0.05 red (up) and blue (down), keep the rest light gray, draw genes with no adjusted p-value as hollow gray points, and label the top 10 genes.
DESeq2 RNA-seq MA Plot

MA Plot Generator: limma Microarray MA Plot scientific chart example

Prompt

Based on the uploaded limma_toptable.csv file, create an MA plot of logFC against AveExpr (already log2, so a linear x-axis), adj.P.Val < 0.05 genes in dark orange and purple, and a running median line to show the trend stays at zero. No labels.

limma Microarray MA Plot

MA Plot Generator: edgeR MA Plot with Fold-Change Lines scientific chart example

Prompt

Based on the uploaded edger_results.csv file, create an MA plot of logFC against logCPM with dashed lines at ±1, highlighting genes with FDR < 0.05 and |logFC| ≥ 1 in red and blue. No labels.

edgeR MA Plot with Fold-Change Lines

MA Plot Generator: Two-Color Array Before Normalization scientific chart example

Prompt

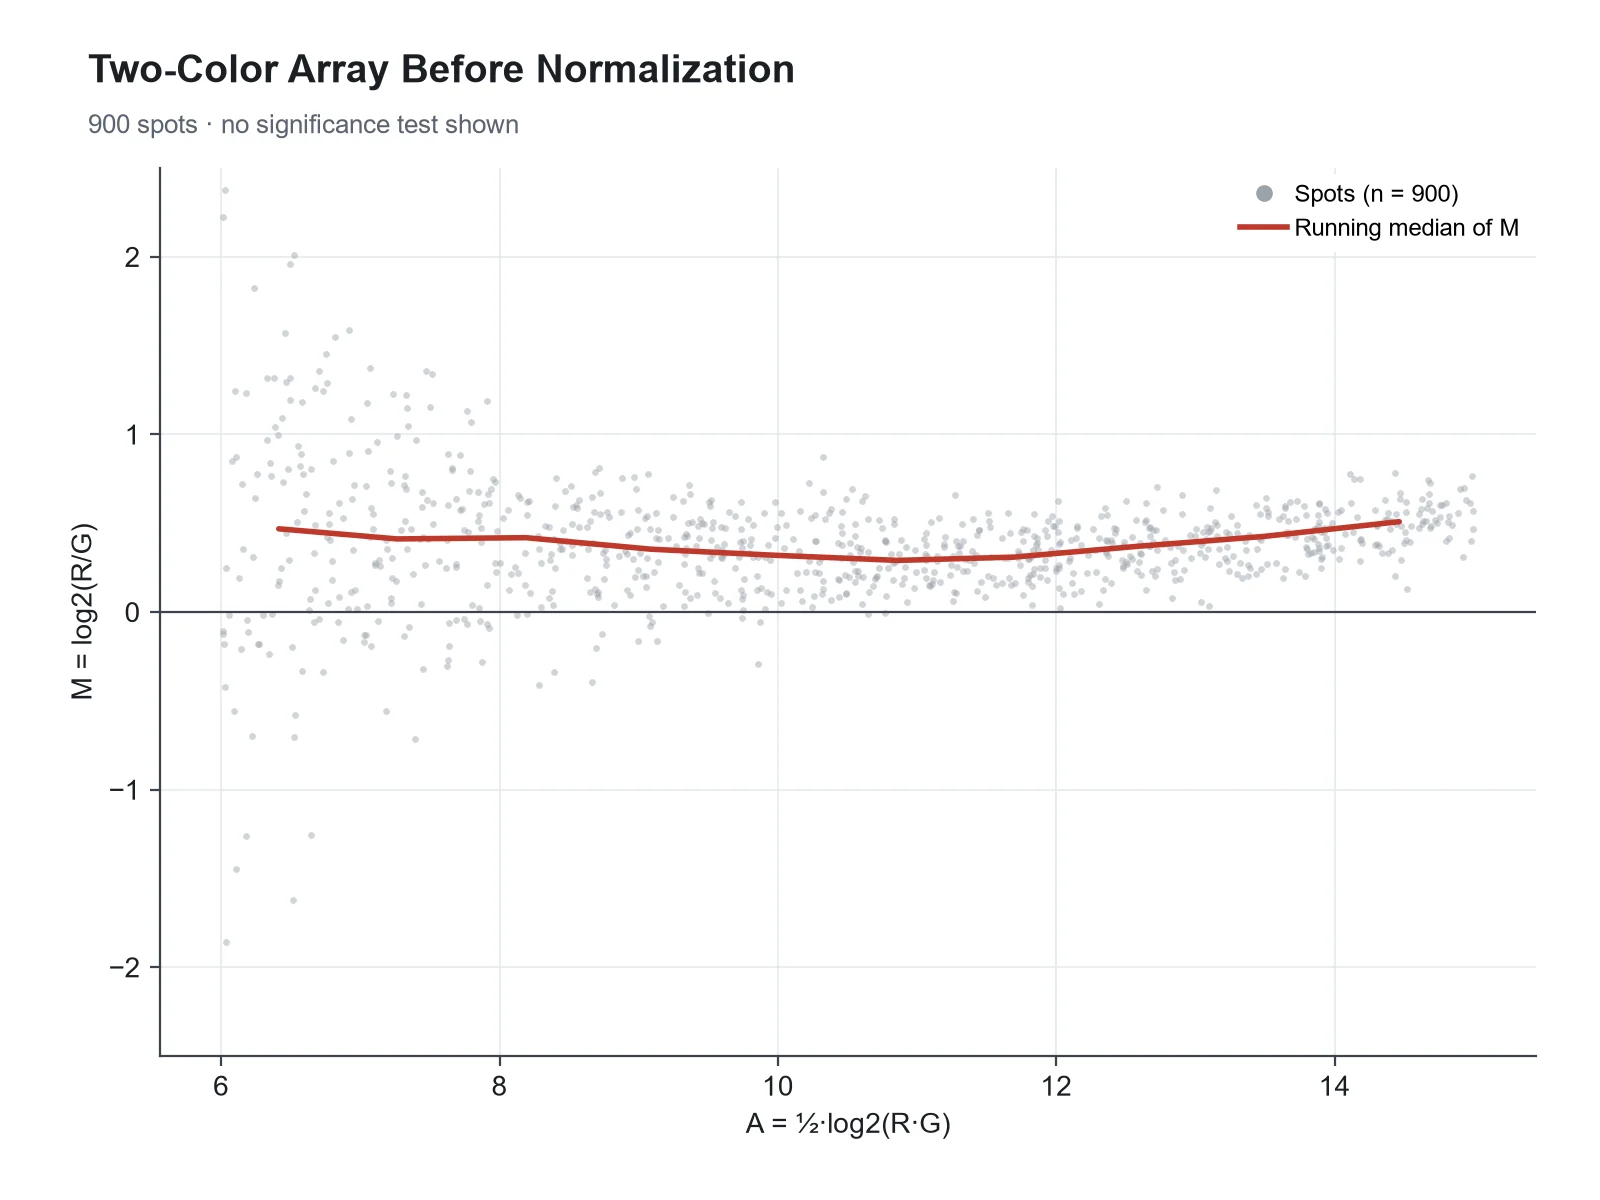
Based on the uploaded two_color_array_MA.csv file, create an MA plot of raw M against A for one two-color array, small gray points, a red running median line, and a dashed line at zero, to show the intensity-dependent dye bias that loess normalization removes.

Two-Color Array Before Normalization

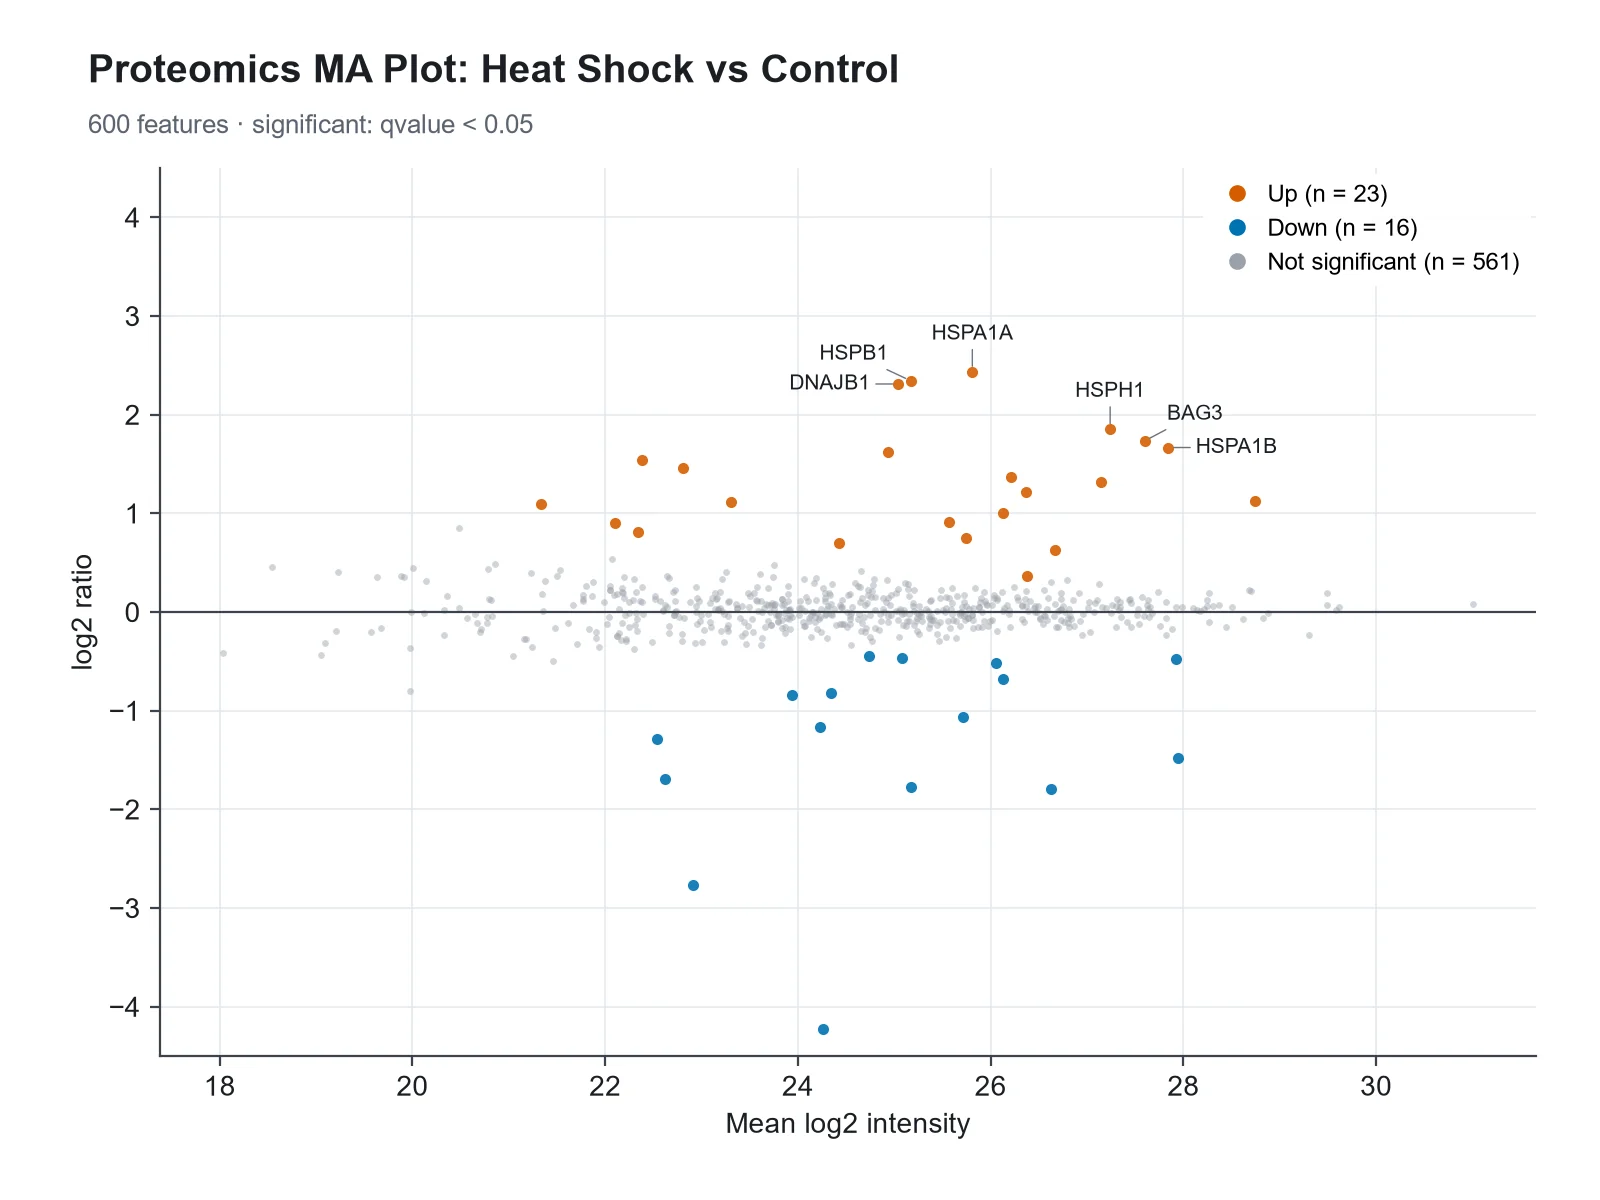
MA Plot Generator: Proteomics MA Plot scientific chart example

Prompt

Based on the uploaded proteomics_ratios.csv file, create an MA plot of log2 ratio against mean log2 intensity, proteins with q < 0.05 in red and blue, and labels for the heat shock proteins HSPA1A, HSPA1B, DNAJB1, HSPH1, HSPB1 and BAG3.

Proteomics MA Plot

MA Plot Generator: MA Plot with a Highlighted Gene Set scientific chart example

Prompt

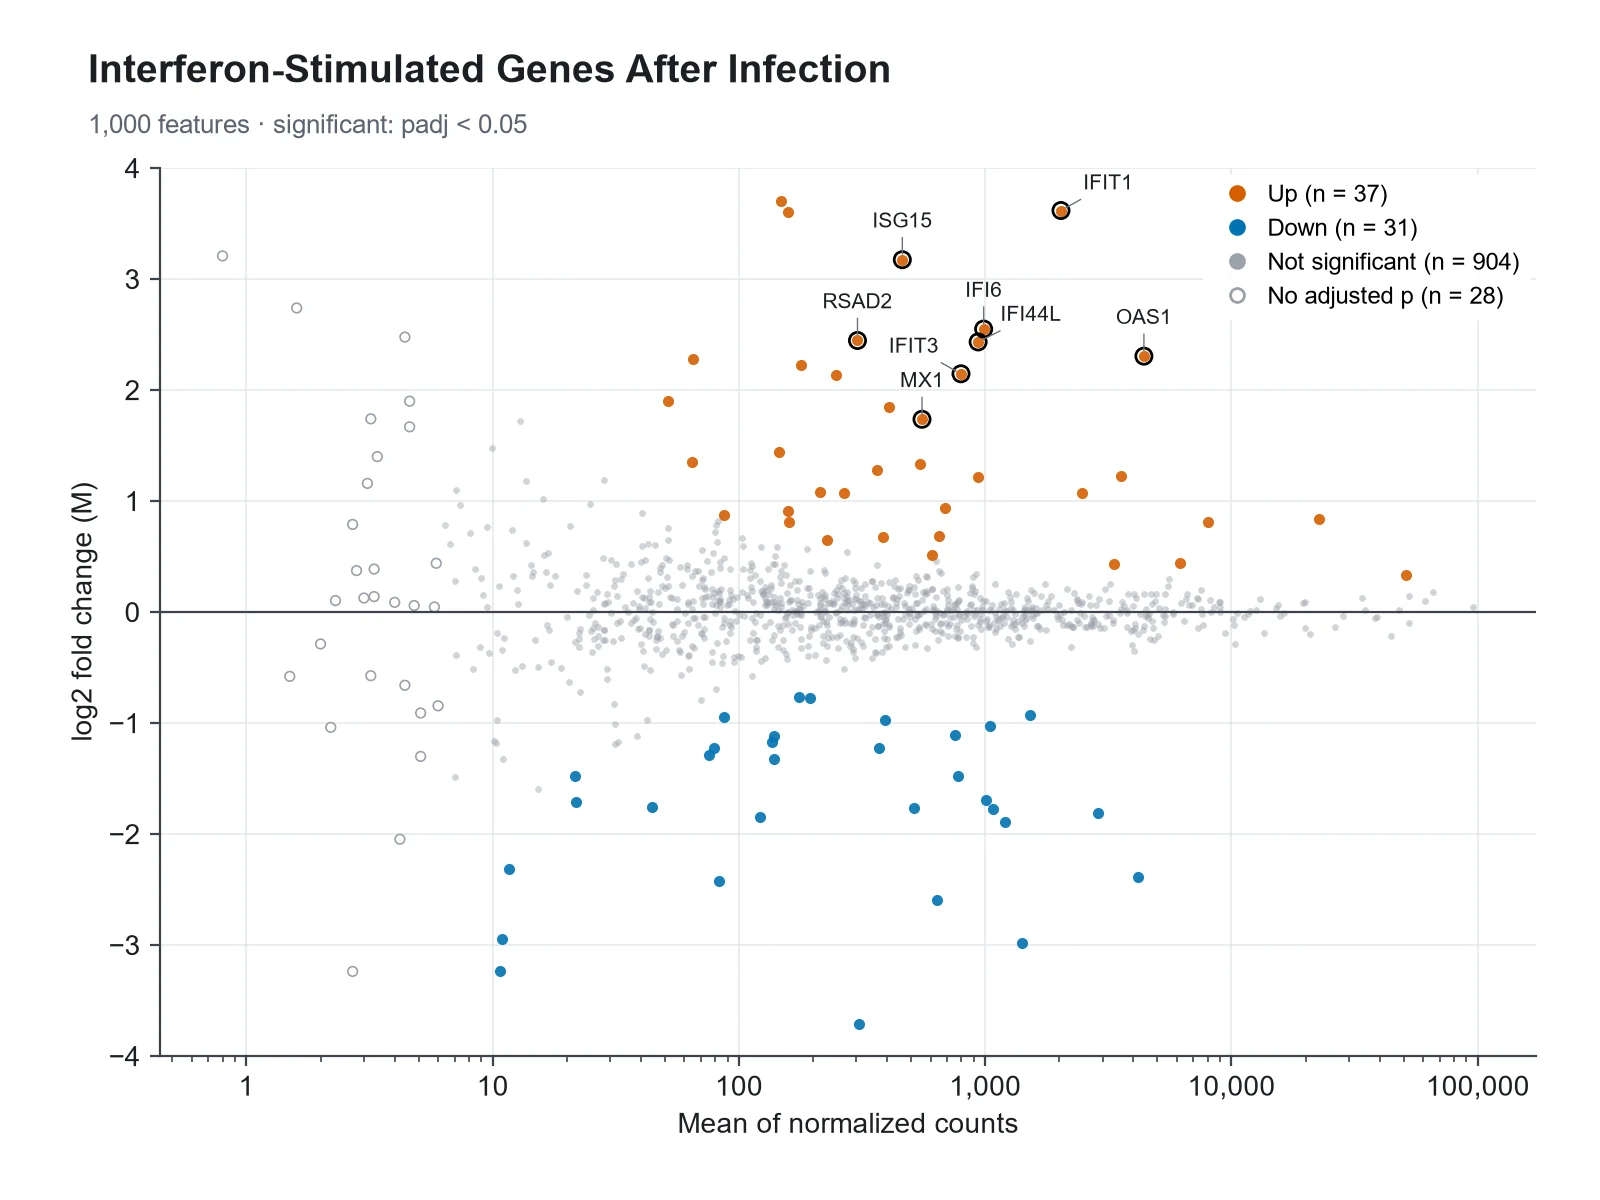
Based on the uploaded infection_deseq2.csv file, create an MA plot with baseMean on a log10 x-axis, significant genes in muted colors, and the interferon-stimulated genes ISG15, IFIT1, IFIT3, MX1, OAS1, IFI6, RSAD2 and IFI44L labeled and outlined in black.

MA Plot with a Highlighted Gene Set

How to make an MA plot

1

Upload your results table

Add a CSV, TSV, or Excel export with a mean expression column (baseMean, AveExpr, logCPM), a log2 fold change column, and optionally an adjusted p-value column (padj, FDR, adj.P.Val).

2

Describe the figure

Set the significance cutoff, an optional fold-change threshold, colors, a y-axis limit, and which genes to label, by rank or by name.

3

Generate, review & download

SciFigure computes every significance call and count, draws the MA plot, and lets you download a PNG for papers, posters, and slides.

MA plot key facts

M (y-axis)
log2 fold change, e.g. log2(treated / control)
A (x-axis)
Mean expression; mean of normalized counts on a log scale for RNA-seq
Two-color arrays
M = log2(R/G), A = ½·log2(R·G)
Significance
Your adjusted p-value below the cutoff (0.05 here; 0.1 in DESeq2’s plotMA)
Also called
MD (mean-difference) plot; a Bland-Altman plot on the log scale
padj = NA in DESeq2
Low counts (independent filtering), count outliers, or all-zero genes

What is an MA plot?

An MA plot is a scatter plot of differential expression results with one point per gene: the log2 fold change (M) on the y-axis against the average expression (A) on the x-axis. It was introduced for two-color microarrays, where M = log2(R/G) is the log ratio of the red and green channel intensities and A = ½·log2(R·G) is their average log intensity. In RNA-seq the same layout plots each gene’s log2 fold change against its mean of normalized counts, drawn on a log scale, as DESeq2’s plotMA does. Most genes do not change, so they form a horizontal band around M = 0, and the significant genes stand out above and below it. limma and edgeR call the same plot a mean-difference (MD) plot, and statistically it is a Bland-Altman plot on the log scale.

How to read an MA plot

  • Points above zero are higher in the treatment (or numerator) group, points below zero are lower. The y-axis is log2, so +1 means twice as high and −1 means half.
  • The cloud should be centered on M = 0 across the whole range of expression. A cloud that sits above or below zero, or bends at low or high expression, points to a normalization problem.
  • The cloud fans out to the left: genes with low counts have noisy fold-change estimates, so large fold changes there are often not significant.
  • Colored points are genes your test called significant at the chosen adjusted p-value cutoff. At high expression, small fold changes can be significant; at low expression, large ones may not be.
  • Points beyond the y-axis limit are drawn as triangles at the edge, pointing up or down, as DESeq2 does.
  • Gray hollow points are genes with no adjusted p-value (filtered for low counts or flagged as outliers), not genes that were tested and failed.

MA plot vs volcano plot

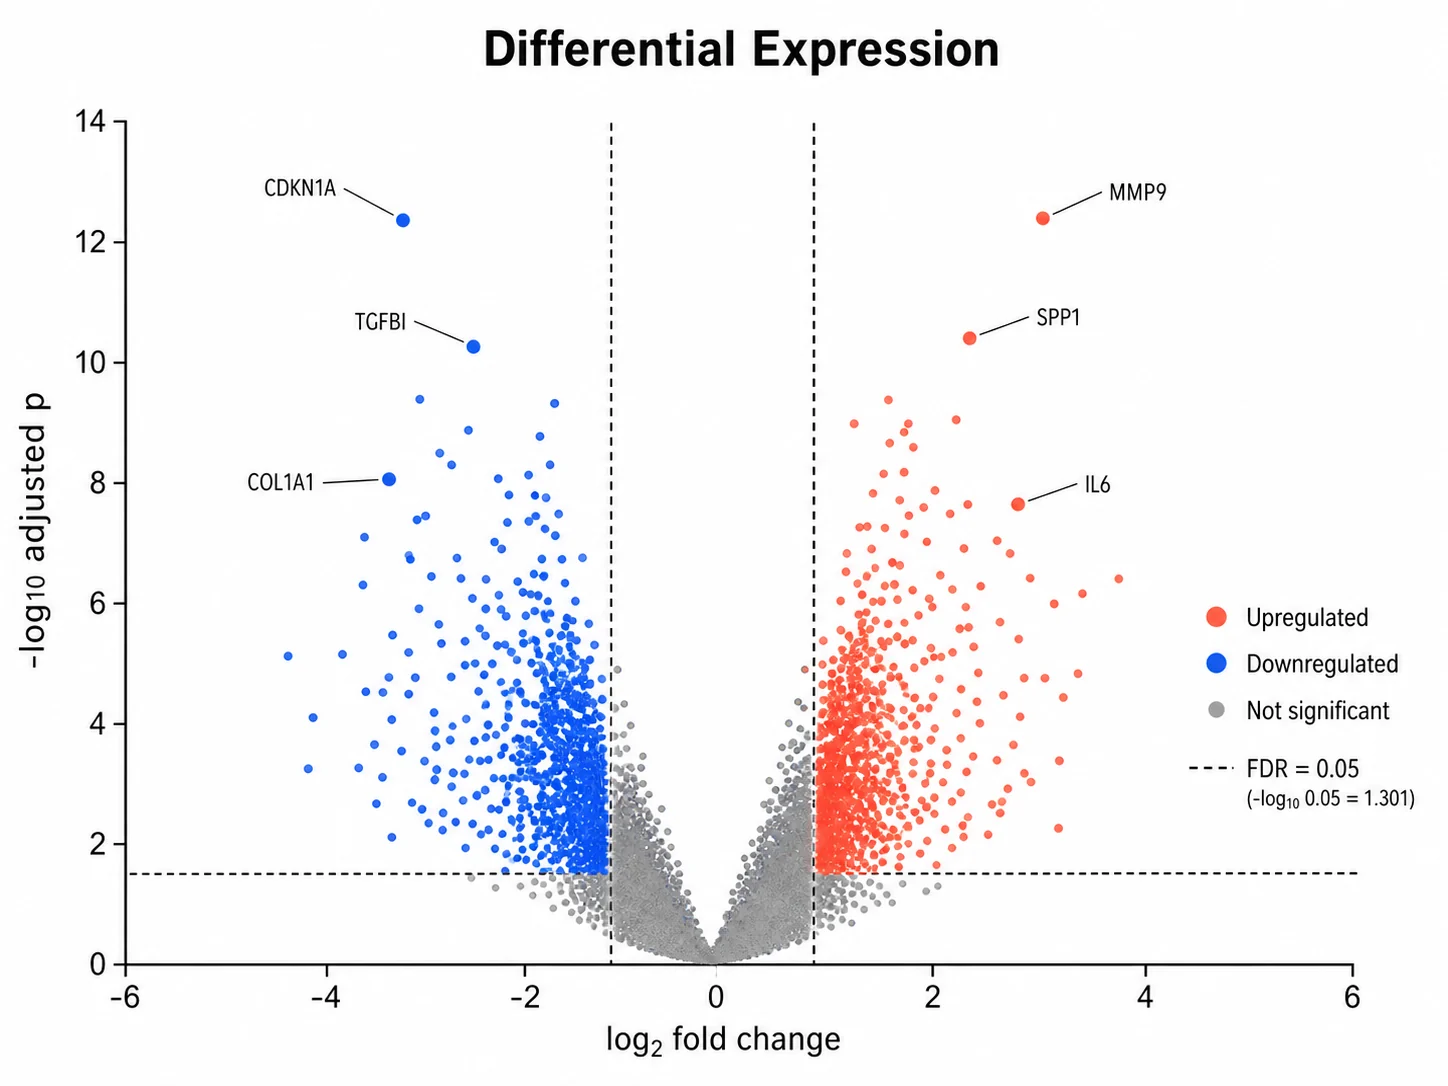
Both plots show the same differential expression results with log2 fold change as the effect size. A volcano plot puts fold change on the x-axis and −log10 p-value on the y-axis, so it answers "which genes changed the most with the strongest evidence". An MA plot puts mean expression on the x-axis, so it answers "how does the effect depend on how well the gene is measured", which makes it the better quality-control plot: normalization bias, low-count noise, and the effect of fold-change shrinkage are visible in an MA plot and invisible in a volcano plot. Many papers show both, often side by side.

Low counts, noise, and shrunken fold changes

  • A gene with 5 reads in one group and 20 in the other has a 4-fold change that is mostly noise. That is why the MA plot fans out at low expression.
  • DESeq2’s lfcShrink with the apeglm or ashr method shrinks noisy fold changes toward zero while keeping large, well-supported ones. The DESeq2 authors recommend shrunken values for visualization and ranking genes.
  • An MA plot of shrunken fold changes loses the fan shape: low-count genes collapse toward zero and the strong, reliable effects remain.
  • Shrinkage changes the fold changes, not the p-values from the original test; say in the caption which fold changes are plotted.

Using an MA plot to check normalization

The trend of M across A should be flat at zero, because most genes are not expected to change. In two-color microarrays, dye bias makes the trend curve with intensity, and loess normalization along A, described by Yang and colleagues in 2002, removes it. In RNA-seq, a cloud shifted away from zero usually means the size factors or library-size normalization did not account for composition, for example when a few very abundant transcripts change. This generator computes the median M in ten equal-count bins along the x-axis and passes it to the plot, so you can ask for a trend line and see at a glance whether your data are centered.

What does this MA plot generator calculate?

The generator reads the mean expression, log2 fold change, and optional adjusted p-value for every gene. It decides whether the mean is on a count scale (DESeq2 baseMean, drawn on a log10 axis) or already on a log2 scale (limma AveExpr, edgeR logCPM, drawn on a linear axis), and skips genes with a zero mean on a log axis. Genes are called significant only when your adjusted p-value is below the cutoff (0.05 by default; DESeq2’s plotMA uses 0.1) and, if you set one, |log2 fold change| is at least the threshold. Genes with no adjusted p-value are counted and drawn apart. It counts up- and down-regulated genes, computes the binned trend, caps the y-axis with edge triangles when asked, and picks the top genes to label by adjusted p-value. It never estimates p-values: without an adjusted p-value column, genes are colored by fold change only and the figure says so.

Which columns to upload from DESeq2, edgeR, and limma

  • DESeq2 results(): baseMean (x), log2FoldChange (y), padj (significance), with gene IDs from the row names exported as a column.
  • edgeR topTags(): logCPM (x), logFC (y), FDR (significance).
  • limma topTable(): AveExpr (x), logFC (y), adj.P.Val (significance).
  • Two-color arrays or any paired measurements: A (x) and M (y) computed as above, with no significance column for a quality-control plot.
  • Proteomics: mean log2 intensity (x), log2 ratio (y), and q-value (significance).
  • Uploads are limited to 1,200 rows. Keep all significant genes plus a random sample of the rest, so the background keeps its shape.

MA plot vs volcano plot

Two views of the same results table. Use the MA plot to judge the data, the volcano plot to pick the hits.

MA plotVolcano plot
X-axisMean expression (A)log2 fold change
Y-axislog2 fold change (M)−log10 p-value or adjusted p-value
Shows bestHow effects depend on expression levelEffect size against strength of evidence
Quality controlNormalization bias, low-count noise, effect of shrinkageLittle
Significance shown byPoint colorHeight and color
Typical useChecking a differential expression analysisPresenting and labeling top hits

Common MA plot mistakes

These are the problems that make an MA plot misleading.

  1. MistakePlotting DESeq2 baseMean on a linear x-axis, so 95% of genes crowd into the left edge.

    CorrectDraw counts on a log10 axis; values already on a log2 scale (AveExpr, logCPM) stay linear.

  2. MistakeColoring genes by unadjusted p-values.

    CorrectUse the adjusted p-value (FDR) from the same test, and state the cutoff.

  3. MistakeDrawing genes with padj = NA as non-significant without explanation.

    CorrectKeep them apart (hollow or lighter) and say they were filtered for low counts or outliers.

  4. MistakeReading large fold changes at low expression as strong effects.

    CorrectThose estimates are noisy. Plot shrunken fold changes (apeglm or ashr) for display and ranking.

  5. MistakeIgnoring a cloud that bends or sits off zero.

    CorrectTreat it as a normalization warning and check size factors or apply loess normalization before testing.

  6. MistakeCutting the y-axis and silently dropping the most extreme genes.

    CorrectShow genes beyond the limit as triangles on the edge so readers know they exist.

MA Plot Generator FAQ

What is an MA plot?

An MA plot is a scatter plot of differential expression results that puts each gene’s log2 fold change (M) on the y-axis and its average expression (A) on the x-axis. It shows which genes changed, how that depends on expression level, and whether the data are well normalized.

What do M and A stand for in an MA plot?

They come from two-color microarrays: M is the log ratio of the two channel intensities, M = log2(R/G), and A is their average log intensity, A = ½·log2(R·G). Think of M as "minus" (a difference of logs) and A as "add" (an average of logs). In RNA-seq, M is the log2 fold change and A is the mean of normalized counts.

What is the difference between an MA plot and a volcano plot?

An MA plot shows log2 fold change against mean expression; a volcano plot shows log2 fold change against −log10 p-value. The MA plot is better for checking normalization and low-count noise, and the volcano plot is better for showing which genes have both large effects and strong evidence.

What should a good MA plot look like?

A dense band of points centered on zero across the full x-range, wider at low expression and narrower at high expression, with significant genes spread above and below. A trend line through the medians should stay flat at zero.

Why do low-expression genes show such large fold changes?

With few reads, small random differences produce large ratios, so fold-change estimates for low-count genes are noisy. That is why the plot fans out to the left, and why those genes are rarely significant.

Should I plot shrunken log2 fold changes?

For display and ranking, usually yes. DESeq2’s lfcShrink (apeglm or ashr) pulls noisy low-count fold changes toward zero and leaves well-supported effects in place. Say which fold changes you plotted in the caption.

Why do some genes have no adjusted p-value?

In DESeq2, padj is set to NA for genes removed by independent filtering because of low mean counts, and both p-value and padj are NA for genes with count outliers (Cook’s distance) or all-zero counts. This generator draws them apart and counts them.

Which columns do I need from DESeq2, edgeR, or limma?

DESeq2: baseMean, log2FoldChange, padj. edgeR: logCPM, logFC, FDR. limma: AveExpr, logFC, adj.P.Val. Add a gene ID or symbol column for labels. The generator detects these headers automatically.

Which significance cutoff should I use?

The generator uses adjusted p < 0.05 by default. DESeq2’s plotMA colors genes with padj < 0.1, its default alpha. Write "padj < 0.1" or "FDR 0.01" in your instructions to change it, and add "fold change threshold 1" to require |log2 fold change| ≥ 1 as well.

Does the generator calculate p-values?

No. Significance comes only from the adjusted p-values in your file. Without them, genes are colored by fold change alone and the plot says that no significance test was applied.

Is an MA plot the same as an MD plot or a Bland-Altman plot?

Yes, in layout. limma and edgeR call it a mean-difference (MD) plot, and plotting the difference of two log-scale measurements against their mean is the Bland-Altman method applied to log-transformed data.

Can I label specific genes?

Yes. Write "label the top 15" or name the genes, for example "label FKBP5, PER1 and KLF15". Named genes that exist in your file are labeled; others are ignored.

Ready to plot your differential expression results?

Generate MA plots, volcano plots, heatmaps, and other genomics figures from your own data with SciFigure AI.