Generate a labeled Wiggers diagram of the cardiac cycle with aortic, left ventricular, and left atrial pressure, left ventricular volume, the ECG, and the heart sounds stacked on one time axis — and the four valve events drawn exactly where the pressure traces cross. Choose which traces to include, a simple pressures-only version, or a blank worksheet with its matching answer key.
Valve events at pressure crossoversPressure, volume, ECG, sounds alignedLabeled or blank
Timing checked against Guyton & Hall
Valve events at pressure crossovers
Labeled, numbered, or blank
Print-ready PNG
AI Wiggers Diagram Generator
Describe which traces, phases, and labels you need, or ask for a blank worksheet.
660 / 2000 characters
Generate a publication-ready PNG from your description.
Preview
Wiggers Diagram Example Previews
Target aspect ratio: 4:3
Sample previews. Describe your diagram to generate your own Wiggers diagram.
Wiggers Diagram Examples
Use these as visual directions for a labeled Wiggers diagram, a simple pressures-only version, the seven phases of the cardiac cycle, a pressure–volume loop side by side, heart sounds with the jugular venous pulse, and a blank worksheet.
Prompt
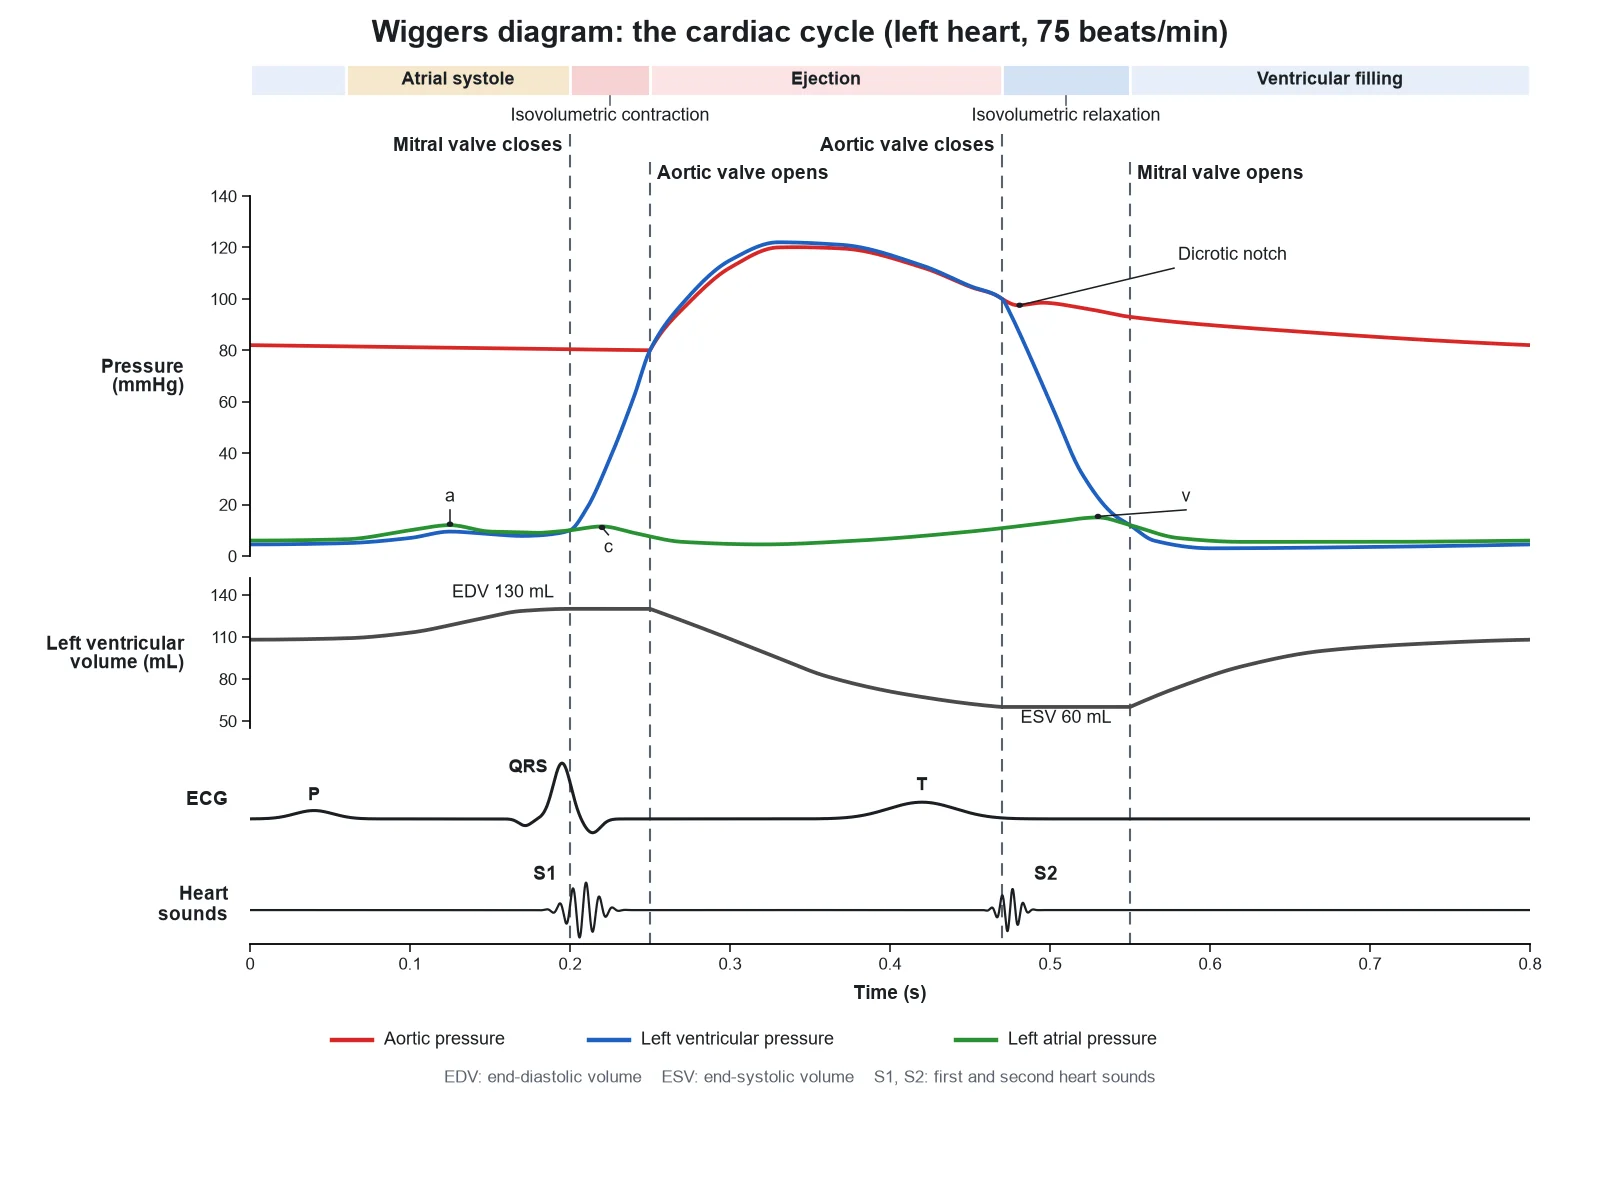
Create a labeled Wiggers diagram of one left-heart cardiac cycle at 75 beats per minute on a white background, in clean physiology textbook style. Shared x axis "Time (s)" from 0 to 0.8 at the bottom. Four rows, top to bottom: "Pressure (mmHg)", 0 to 140, with three traces in a legend: "Aortic pressure" (red), "Left ventricular pressure" (blue), "Left atrial pressure" (green); "Left ventricular volume (mL)", 50 to 140, with "EDV 130 mL" and "ESV 60 mL" marked; "ECG" with "P", "QRS", "T"; "Heart sounds" with "S1" and "S2". Draw four vertical dashed lines through all four rows, labeled at the top: "Mitral valve closes" at 0.20 s, where the blue trace rises above the green; "Aortic valve opens" at 0.25 s, where blue crosses red at 80 mmHg; "Aortic valve closes" at 0.47 s, where blue falls below red at 100 mmHg; "Mitral valve opens" at 0.55 s, where blue falls below green. Phase labels across the top: "Atrial systole", "Isovolumetric contraction", "Ejection", "Isovolumetric relaxation", "Ventricular filling". Label "Dicrotic notch" on the red trace at 0.47 s and "a", "c", "v" on the green trace. Red stays between 80 and 120 mmHg. The volume trace is flat between the first two lines and between the last two. S1 sits on the first line, S2 on the third.
Use this example
Prompt
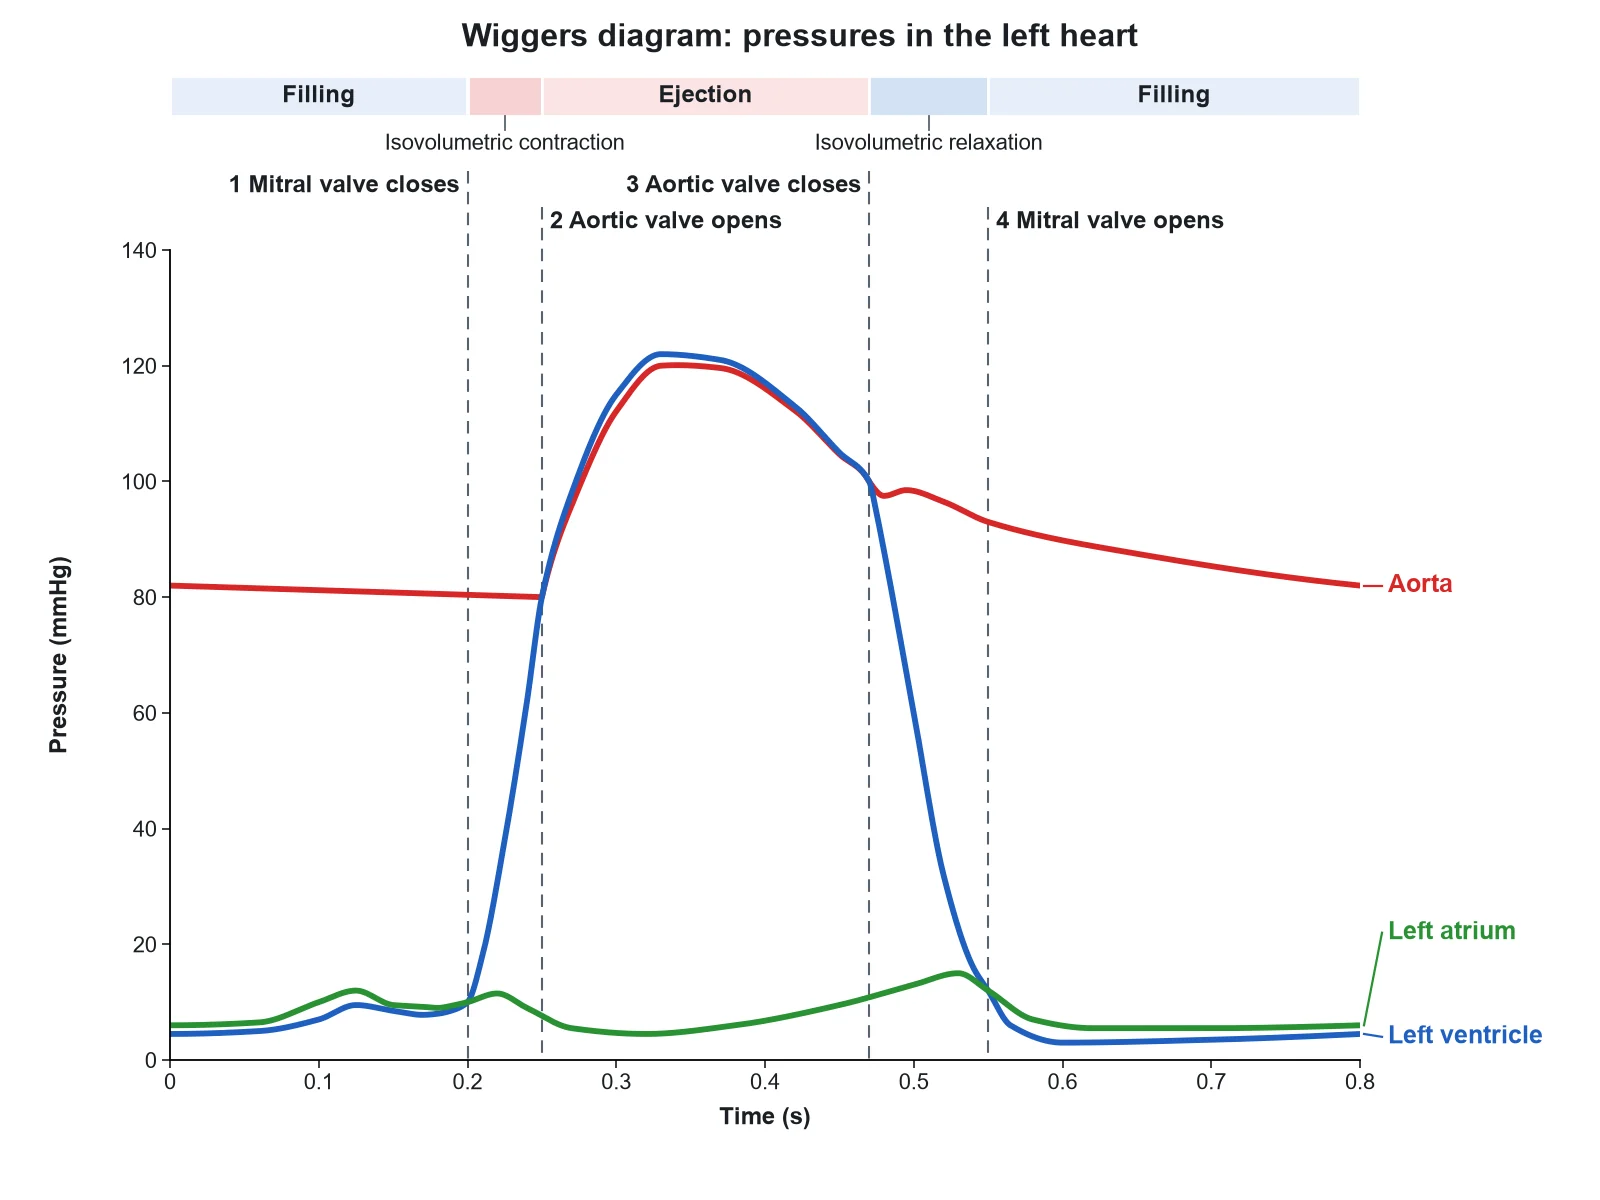
Create a simple Wiggers diagram for an introductory class on a white background, with large text and thick traces. Plot only one panel: y axis "Pressure (mmHg)", 0 to 140; x axis "Time (s)", 0 to 0.8. Three traces, labeled directly at their ends: "Aorta" (red) swinging between 80 and 120 mmHg with a small notch where it meets the third line; "Left ventricle" (blue) near 5 mmHg at rest, rising steeply to a 120 mmHg peak and falling back; "Left atrium" (green) staying low, under 15 mmHg. Draw four vertical dashed lines exactly where the traces cross, labeled at the top: "1 Mitral valve closes", "2 Aortic valve opens", "3 Aortic valve closes", "4 Mitral valve opens". Name the four phases between and around the lines: "Filling", "Isovolumetric contraction", "Ejection", "Isovolumetric relaxation". No ECG, no volume, no other labels.
Use this example
Prompt
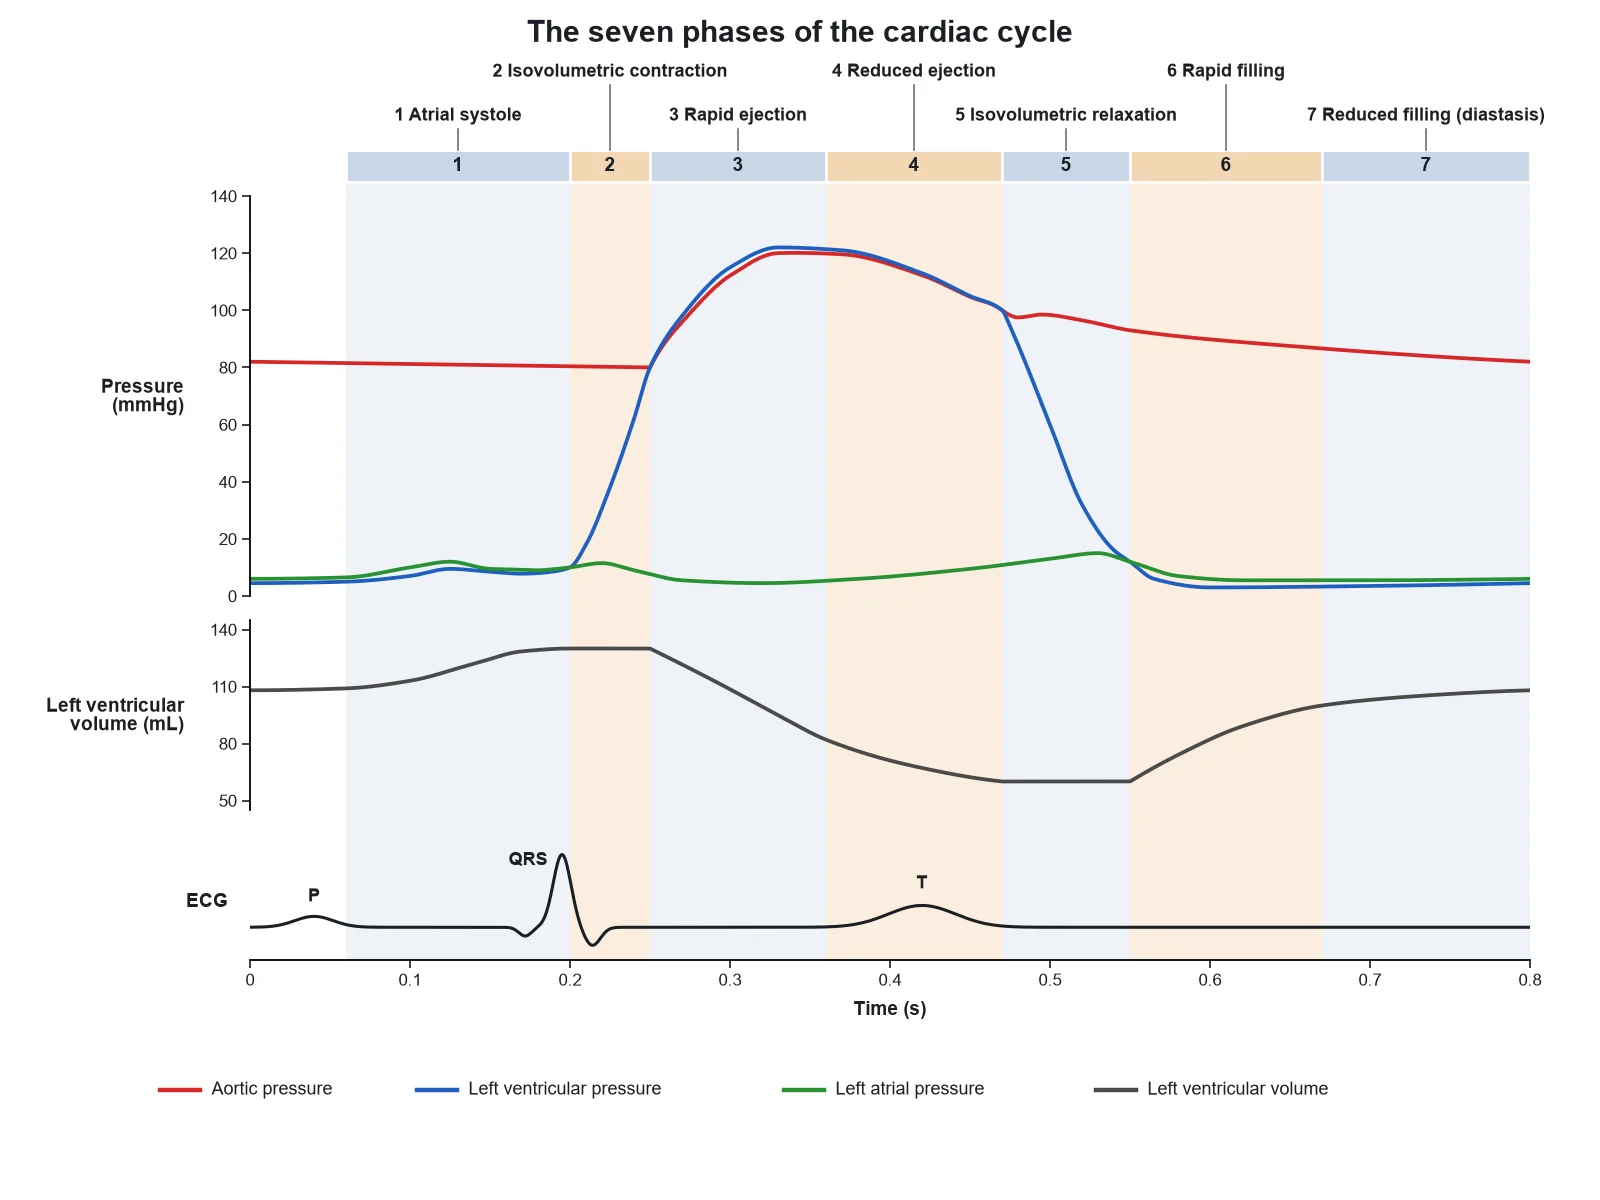
Create a Wiggers diagram of the cardiac cycle divided into seven numbered phases by pale shaded vertical bands that run through every row. Rows on one shared x axis "Time (s)", 0 to 0.8: "Pressure (mmHg)" with aortic (red), left ventricular (blue), and left atrial (green) pressure; "Left ventricular volume (mL)"; "ECG". Band captions across the top, in order: "1 Atrial systole", "2 Isovolumetric contraction", "3 Rapid ejection", "4 Reduced ejection", "5 Isovolumetric relaxation", "6 Rapid filling", "7 Reduced filling (diastasis)". Band 2 starts where blue rises above green and ends where blue rises above red at 80 mmHg; band 5 starts where blue falls below red at the dicrotic notch and ends where blue falls below green. The volume trace is flat in bands 2 and 5, falls in bands 3 and 4 (steeper in 3), rises steeply in 6, slowly in 7, and steps up in 1. The P wave sits just before band 1, the QRS just before band 2, and the T wave in band 4.
Use this example
Prompt
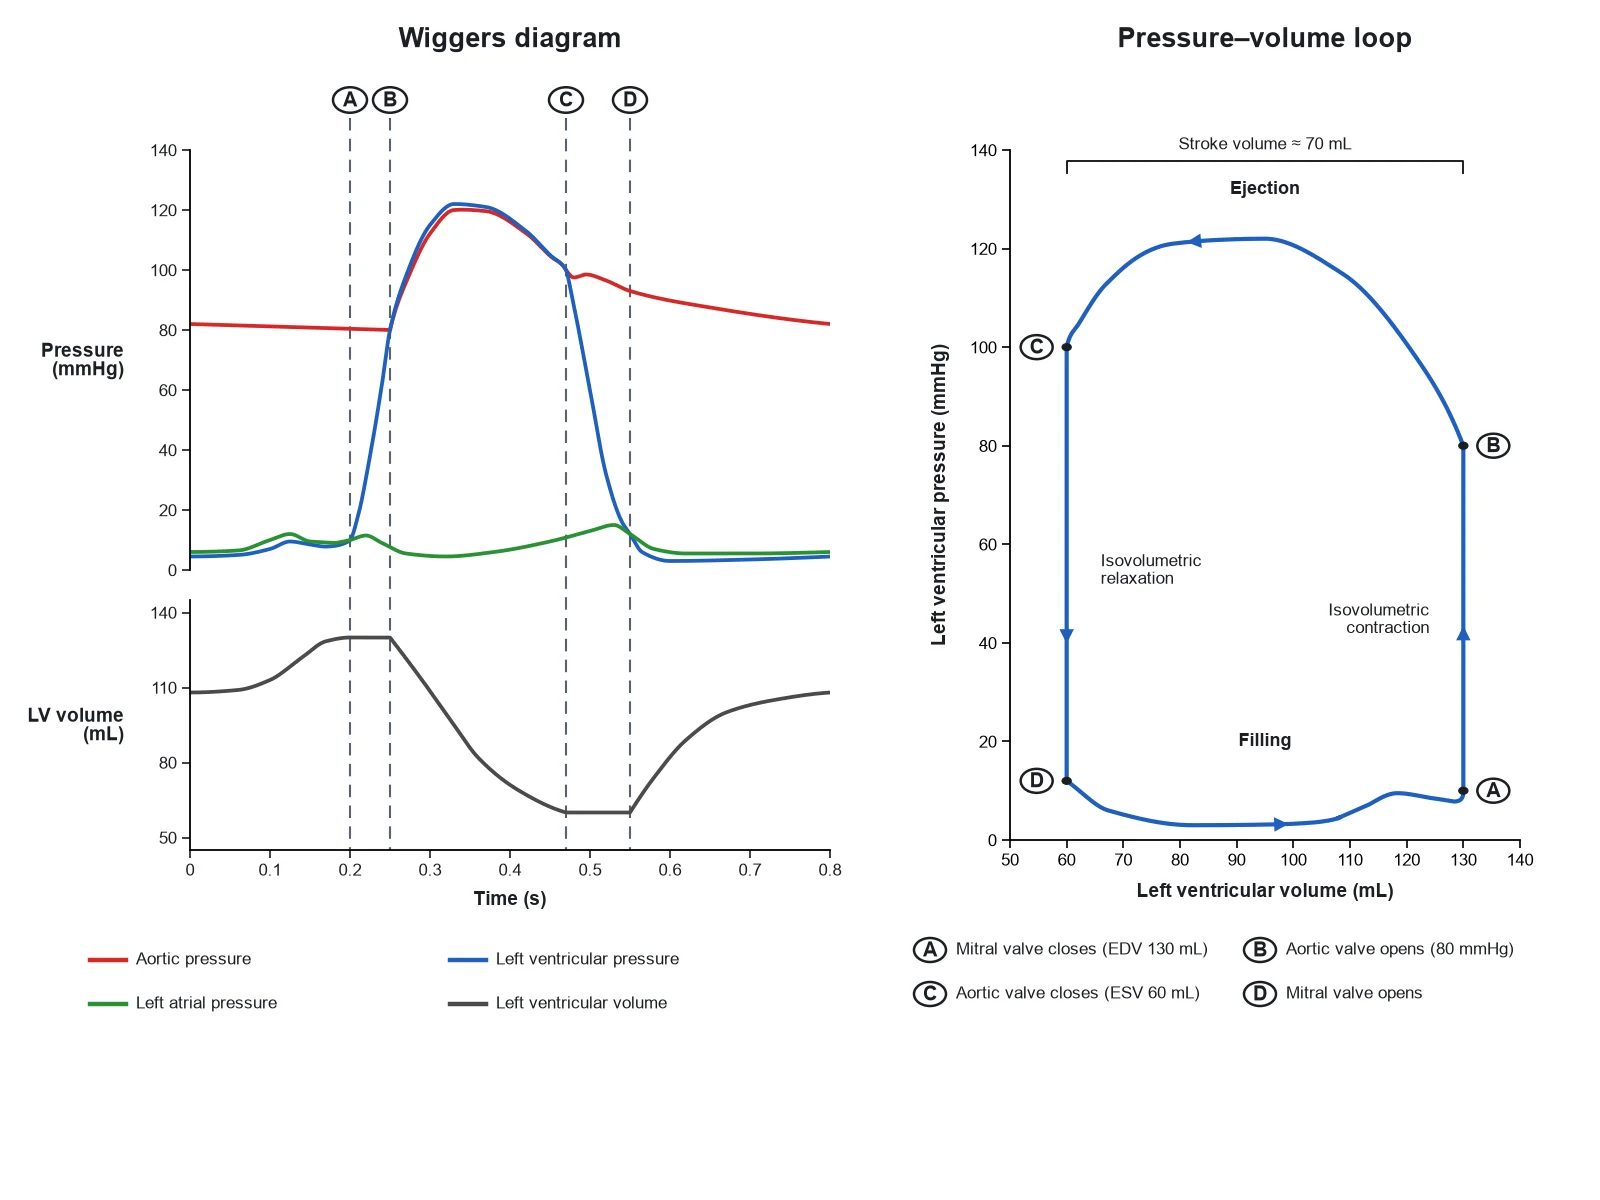
Create a two-panel figure on a white background. Left panel: a compact Wiggers diagram with "Pressure (mmHg)" (aortic red, left ventricular blue, left atrial green) and "Left ventricular volume (mL)" on one x axis "Time (s)", 0 to 0.8, with four vertical dashed lines marked A, B, C, D where the traces cross: A mitral valve closes, B aortic valve opens, C aortic valve closes, D mitral valve opens. Right panel: a pressure–volume loop with x axis "Left ventricular volume (mL)", 50 to 140, and y axis "Left ventricular pressure (mmHg)", 0 to 140. Draw one closed loop running anticlockwise with arrowheads: bottom-right corner "A Mitral valve closes (EDV 130 mL)", right side straight up "Isovolumetric contraction", top-right corner "B Aortic valve opens (80 mmHg)", top edge leftward "Ejection", top-left corner "C Aortic valve closes (ESV 60 mL)", left side straight down "Isovolumetric relaxation", bottom-left corner "D Mitral valve opens", bottom edge rightward "Filling". Bracket the loop width "Stroke volume about 70 mL".
Use this example
Prompt
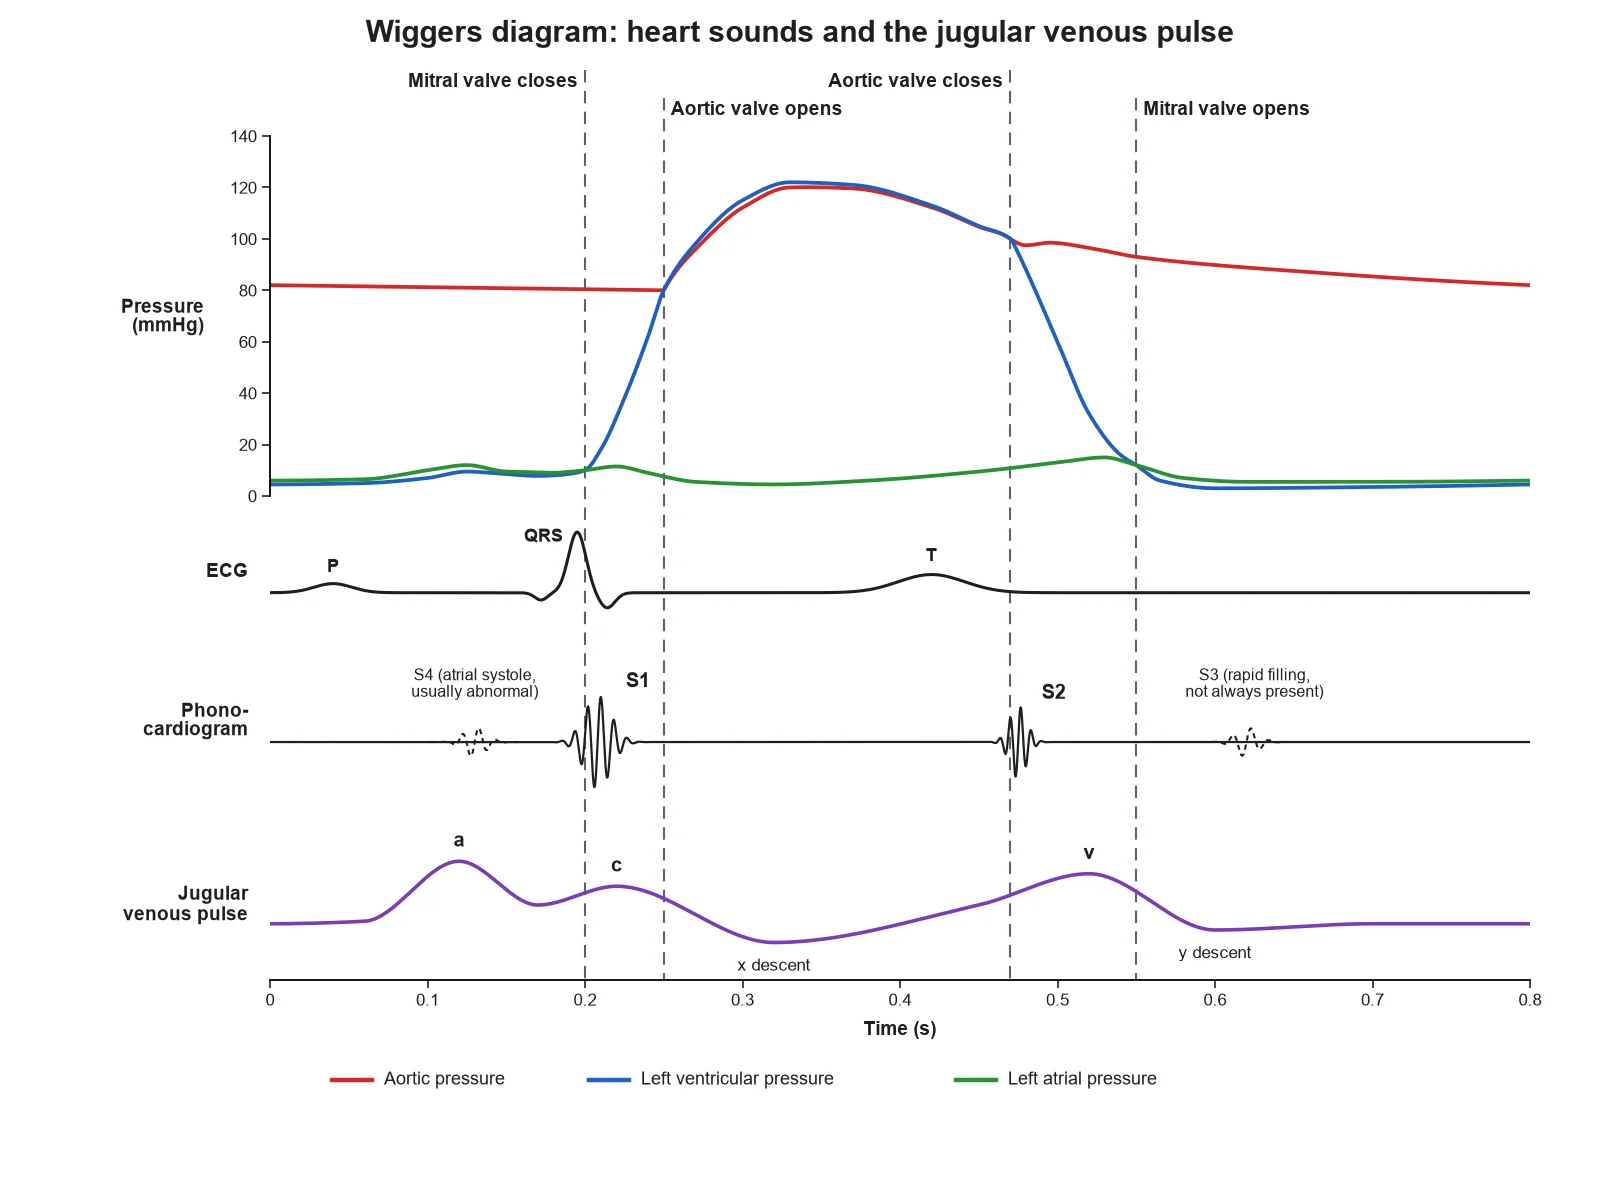
Create a Wiggers diagram focused on heart sounds and the venous pulse, on a white background. Rows on one shared x axis "Time (s)", 0 to 0.8: "Pressure (mmHg)" with left ventricular (blue), aortic (red), and left atrial (green) pressure; "ECG" with P, QRS, and T; "Phonocardiogram"; "Jugular venous pulse". Draw four vertical dashed lines through every row: "Mitral valve closes" at 0.20 s, "Aortic valve opens" at 0.25 s, "Aortic valve closes" at 0.47 s, "Mitral valve opens" at 0.55 s. On the phonocardiogram put a burst labeled "S1" on the first line and a shorter burst "S2" on the third line, plus two small dashed bursts labeled "S3 (rapid filling, not always present)" at about 0.62 s and "S4 (atrial systole, usually abnormal)" at about 0.12 s, just before S1. On the jugular venous pulse label "a" after the P wave, "c" just after S1, the "x descent" after it, "v" peaking at the fourth line, and the "y descent" after the fourth line.
Use this example
Prompt
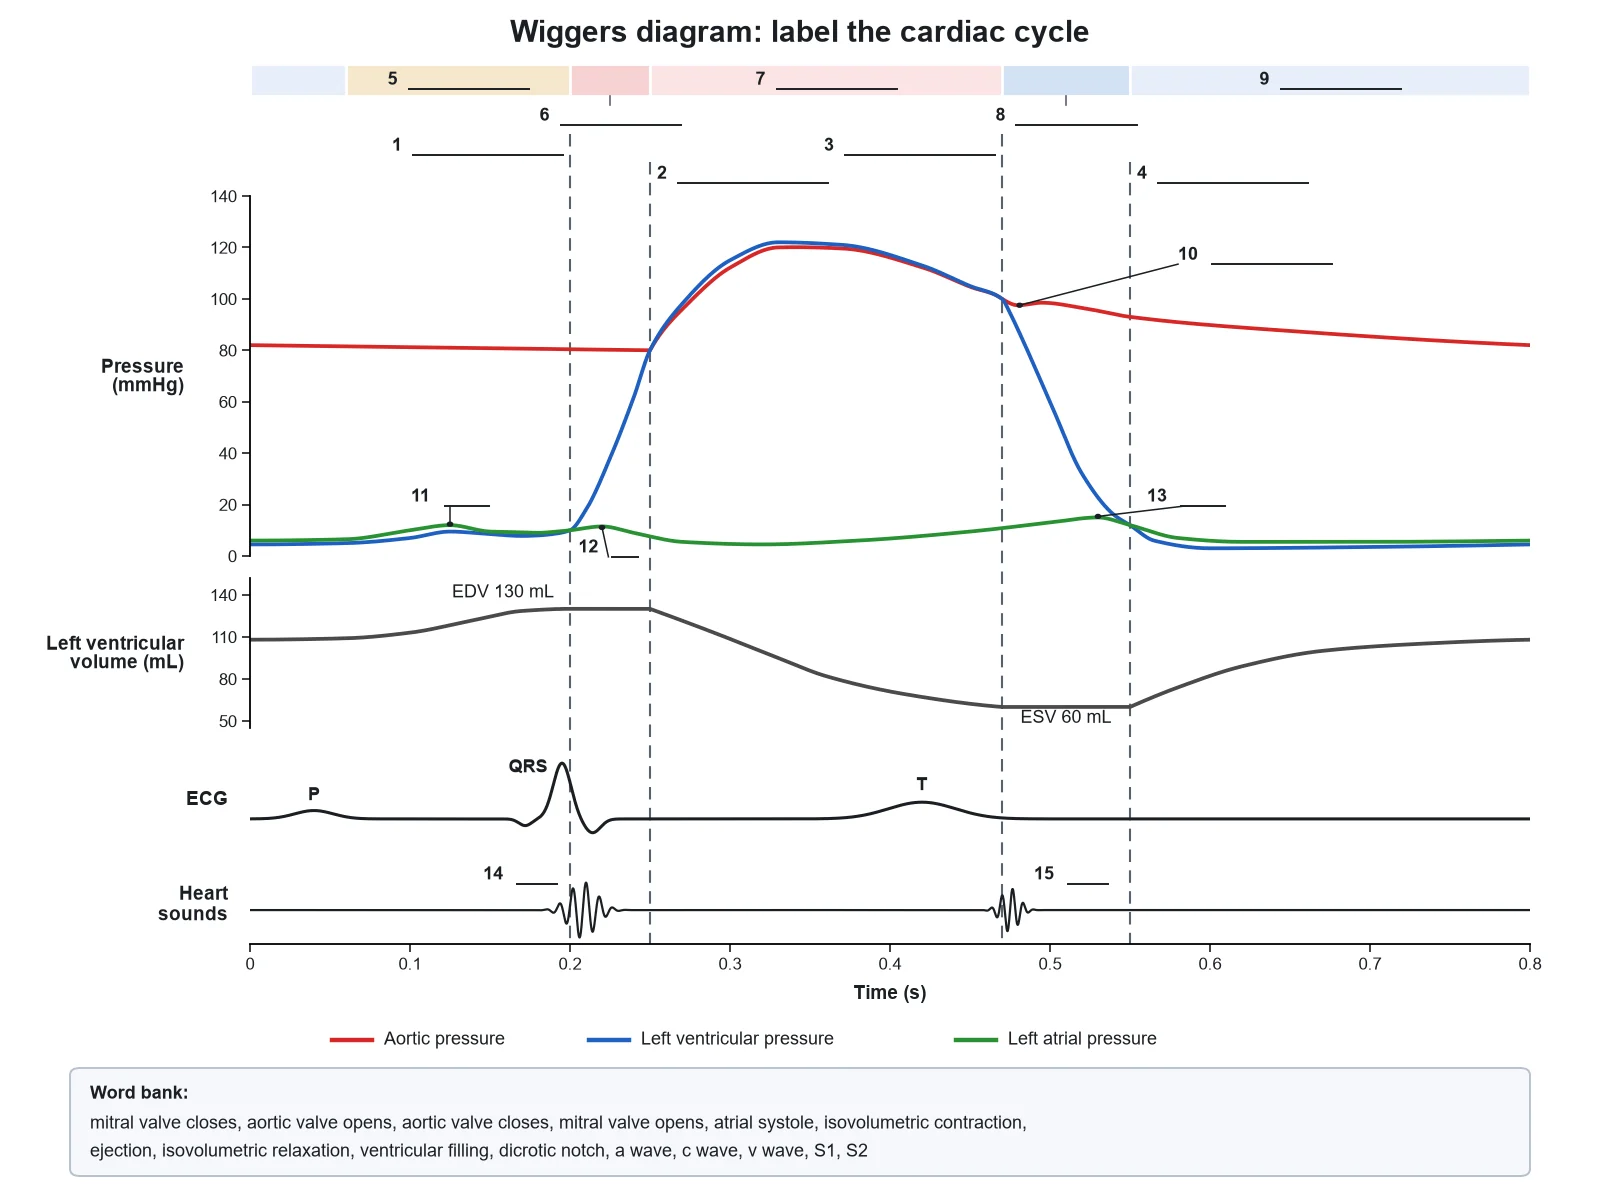
Create a blank Wiggers diagram worksheet that is the same drawing as a labeled textbook Wiggers diagram with the event names removed. Keep everything needed to read the graph: the x axis "Time (s)", 0 to 0.8; the rows "Pressure (mmHg)" 0 to 140 with the legend "Aortic pressure", "Left ventricular pressure", "Left atrial pressure"; "Left ventricular volume (mL)" 50 to 140 with "EDV 130 mL" and "ESV 60 mL"; "ECG" with "P", "QRS", "T"; "Heart sounds"; and the four vertical dashed lines at 0.20, 0.25, 0.47, and 0.55 s. Replace these fifteen labels with numbered empty answer lines: 1 to 4 the four lines, left to right (mitral valve closes, aortic valve opens, aortic valve closes, mitral valve opens); 5 to 9 the phases across the top (atrial systole, isovolumetric contraction, ejection, isovolumetric relaxation, ventricular filling); 10 the notch on the aortic trace (dicrotic notch); 11, 12, 13 the bumps on the atrial trace (a wave, c wave, v wave); 14 and 15 the two sounds (S1, S2). Add a word bank: "mitral valve closes, aortic valve opens, aortic valve closes, mitral valve opens, atrial systole, isovolumetric contraction, ejection, isovolumetric relaxation, ventricular filling, dicrotic notch, a wave, c wave, v wave, S1, S2".
Blank worksheet
Use this example
How to make a labeled Wiggers diagram
1
Pick the traces and the labels
Choose the classic left-heart set, pressures only, pressures with volume and ECG, the full set with the venous pulse and S3 and S4, or the right heart. Then choose labeled, numbered with a key, or a blank worksheet, and the level that matches your course.
2
Generate the diagram
The generator stacks the traces on one time axis, draws the four valve events where the pressure traces cross, keeps the volume flat while both valves are shut, and puts S1 and S2 on the closing valves.
3
Read down every line, then export
At each valve line, check the pressure crossover, the volume trace, the ECG, and the sound. Then download the PNG, or make the matching blank worksheet or answer key from the same image.
Wiggers diagram key facts
Cycle length
About 0.8 s at 75 beats/min
Ventricular systole
About 0.27 s; diastole about 0.53 s including atrial systole
A Wiggers diagram is the standard graph of the cardiac cycle: one heartbeat drawn as a stack of traces that share a single horizontal time axis. In its classic form the top panel holds three pressures in mmHg — aortic pressure, left ventricular pressure, and left atrial pressure — and below it come left ventricular volume in mL, the electrocardiogram, and a phonocardiogram of the heart sounds. Because the traces share one clock, any vertical line drawn through the diagram shows what every one of them is doing at the same instant, which is what makes the figure so powerful for teaching and so easy to get wrong.
The figure is named after Carl J. Wiggers, the American physiologist who recorded pressures in the heart chambers and great arteries with unusual precision in the early twentieth century and laid them out against one another on a common time base. Modern textbook versions, including the one in Guyton and Hall, are idealised redrawings of that layout. The values are those of a resting adult at about 75 beats per minute, so one cycle takes about 0.8 seconds.
Wiggers diagram labeled: the traces and what to mark
Time axis: one shared x axis in seconds, about 0 to 0.8 s for one beat at 75 beats per minute.
Pressure panel: aortic pressure swinging between about 120 and 80 mmHg, left ventricular pressure from near 0 up to about 120 mmHg, and left atrial pressure staying low, about 0 to 15 mmHg.
Left ventricular volume: from an end-diastolic volume (EDV) of about 130 mL down to an end-systolic volume (ESV) of about 50 to 60 mL and back.
ECG: the P wave, the QRS complex, and the T wave, each just ahead of the mechanical event it triggers.
Heart sounds: S1 at the start of ventricular systole and S2 at its end; S3 and S4 only when they are the point of the figure.
Valve events: four vertical lines through every row — mitral valve closes, aortic valve opens, aortic valve closes, mitral valve opens.
Phases: named between the lines, either the seven phases of physiology textbooks or the four of introductory courses.
Landmarks: the dicrotic notch on the aortic trace, and the a, c, and v waves on the atrial trace.
The four valve events: where the pressure lines cross
Heart valves are passive. They open and close only because the pressure on one side overtakes the pressure on the other, which is why every valve event on a Wiggers diagram sits exactly where two pressure traces cross. Learn the four crossings and the rest of the diagram follows from them.
First, the mitral valve closes when left ventricular pressure rises above left atrial pressure, a few hundredths of a second after the QRS complex begins. This is the first heart sound, S1, and the start of isovolumetric contraction. Second, the aortic valve opens when left ventricular pressure rises above aortic pressure, at about 80 mmHg — the diastolic pressure in the aorta — and ejection begins. Third, the aortic valve closes when the relaxing ventricle’s pressure falls back below aortic pressure, at about 100 mmHg; the brief backflow that snaps it shut makes the dicrotic notch on the aortic trace and the second heart sound, S2. Fourth, the mitral valve opens when left ventricular pressure falls below left atrial pressure, and filling begins. At 75 beats per minute these four lines fall at roughly 0.20, 0.25, 0.47, and 0.55 seconds after the start of the P wave.
Wiggers diagram explained: the cardiac cycle phase by phase
Atrial systole. The P wave spreads depolarisation through the atria, which contract and push the last 20 to 30 percent of the ventricle’s filling through the open mitral valve. The atrial trace shows the a wave, ventricular pressure and volume rise slightly, and the ventricle reaches its end-diastolic volume of about 130 mL. Isovolumetric contraction. The QRS complex triggers ventricular contraction; as soon as ventricular pressure exceeds atrial pressure the mitral valve closes with S1. With the aortic valve still shut, pressure climbs steeply from under 10 mmHg to about 80 mmHg while volume stays exactly the same, for about 0.05 seconds. The closing mitral valve bulging back into the atrium gives the small c wave.
Rapid and reduced ejection. When ventricular pressure passes aortic pressure the aortic valve opens. Blood leaves quickly at first, so volume drops steeply while both pressures rise together to a peak of about 120 mmHg; later the flow slows, the pressures fall, and the T wave of ventricular repolarisation appears. By the end, the ventricle holds its end-systolic volume of about 50 to 60 mL, and the stroke volume — about 70 mL — has gone into the aorta. Meanwhile the atrium is refilling from the pulmonary veins against the closed mitral valve, so atrial pressure climbs into the v wave.
Isovolumetric relaxation. As the ventricle relaxes its pressure falls below aortic pressure, the aortic valve closes with S2, and the aortic trace shows the dicrotic notch. Both valves are shut again, so ventricular pressure plunges at constant volume for about 0.08 seconds. Rapid filling and diastasis. When ventricular pressure drops below atrial pressure the mitral valve opens, the blood stored in the atrium rushes in, volume rises steeply, and the v wave collapses into the y descent; this is where an S3 would be heard. Filling then slows to a trickle until the next P wave starts the cycle again. Ventricular systole has taken about 0.27 seconds and diastole about 0.53 seconds, which matches OpenStax’s figures of roughly 100 ms atrial systole, 270 ms ventricular systole, and 430 ms of ventricular diastole after it.
Reading the volume trace: EDV, ESV, and stroke volume
The left ventricular volume trace is the quickest way to check whether a Wiggers diagram is honest. It has two perfectly flat stretches, one for each isovolumetric phase, because blood can only move when a valve is open. Between those stretches it tells the story of the beat: a steep fall in rapid ejection and a gentler one in reduced ejection, down to the end-systolic volume; a steep rise in rapid filling, a slow creep through diastasis, and a final small step from atrial systole up to the end-diastolic volume. The difference between the top and bottom plateaus is the stroke volume, about 70 mL at rest, and dividing it by the end-diastolic volume gives the ejection fraction, normally about 55 to 60 percent. If the plateaus slope, or the curve starts falling before the aortic valve opens, the diagram is wrong — unless it is deliberately showing a leaking valve.
Wiggers diagram heart sounds and ECG: lining up the electrical and acoustic events
The ECG row records electrical activity, and electrical events always come just before the mechanical ones they cause. The P wave precedes atrial contraction and the a wave. The QRS complex precedes the rise in ventricular pressure and the closure of the mitral valve. The T wave, ventricular repolarisation, sits in the later part of ejection and ends at roughly the moment the aortic valve closes. A diagram that draws the QRS after ventricular pressure has already risen, or the T wave after S2, has the order backwards.
The heart sounds row is simpler still, because in a healthy heart the sounds come only from valves closing. S1, the “lub”, is the mitral and tricuspid valves closing and sits on the first valve line. S2, the “dub”, is the aortic and pulmonary valves closing and sits on the third line, at the dicrotic notch. Valve openings are silent. Two extra sounds are added only when they are the subject of the figure: S3 early in diastole, during rapid filling, and S4 late in diastole, during atrial systole just before S1.
The a, c, and v waves of atrial pressure
The atrial pressure trace is small but busy, and the same pattern appears in the jugular venous pulse that clinicians watch in the neck. The a wave is atrial contraction, following the P wave. The c wave is a small bump just after S1, as the closing atrioventricular valve bulges back into the atrium at the start of ventricular contraction. The x descent follows as the atrium relaxes and the valve ring is pulled down during ejection. The v wave builds slowly while venous blood fills the atrium against the closed valve; it keeps rising until the valve opens and then falls away — the y descent — as the stored blood empties into the ventricle. On a Wiggers diagram, the v wave peak should sit on the fourth valve line, where the mitral valve opens, never back at the end of ejection.
The right-heart Wiggers diagram
The right side of the heart runs the same cycle on the same clock, so a right-heart Wiggers diagram has the same shape with much smaller numbers. Right ventricular pressure peaks at about 25 mmHg, pulmonary artery pressure runs about 25 over 8 to 10 mmHg, and right atrial pressure sits around 0 to 5 mmHg. The valves are the tricuspid and the pulmonary instead of the mitral and the aortic. The two sides are not perfectly simultaneous: the pulmonary valve closes slightly after the aortic valve, so S2 has two parts, A2 then P2, and the gap widens on inspiration — the physiological splitting of the second heart sound.
Wiggers diagram vs pressure–volume loop
A pressure–volume loop takes two traces from the Wiggers diagram — left ventricular pressure and left ventricular volume — and plots them against each other instead of against time. One beat becomes a closed loop that runs anticlockwise. The bottom-right corner is mitral valve closure at the end-diastolic volume; the vertical right side is isovolumetric contraction; the top-right corner is aortic valve opening; the curved top is ejection; the top-left corner is aortic valve closure at the end-systolic volume; the vertical left side is isovolumetric relaxation; the bottom-left corner is mitral valve opening; and the bottom edge is filling. The loop’s width is the stroke volume and its area is the stroke work. The two figures answer different questions: the Wiggers diagram shows when things happen, and the loop shows how preload, afterload, and contractility change the work the ventricle does.
How valve disease changes the traces
Valve disease shows up on a Wiggers diagram as broken versions of the normal rules, which is why the figure is used in medical teaching. In aortic stenosis, left ventricular pressure rises far above aortic pressure during ejection, because the narrowed valve needs a pressure gradient to force blood through. In mitral stenosis, left atrial pressure stays well above ventricular pressure all through diastole. In mitral regurgitation, blood leaks back into the atrium during systole, producing a tall v wave, and in aortic regurgitation aortic pressure falls further in diastole as blood leaks back into the ventricle. The generator draws these only when your request names the condition; a standard Wiggers diagram is always a healthy resting heart.
How to draw a Wiggers diagram by hand
Drawing the Wiggers diagram yourself is the fastest way to learn it, and the order matters. Start with the time axis, 0 to 0.8 seconds, and stack empty rows above it for pressure, volume, the ECG, and the heart sounds. Draw the ECG first, because everything else hangs off it: a P wave near the start, a QRS complex at about 0.16 seconds, and a T wave ending at about 0.47 seconds. Next draw the four valve lines straight down through every row at about 0.20, 0.25, 0.47, and 0.55 seconds. Now add the pressures so that they cross on those lines: aortic pressure decaying to 80 mmHg at the second line, rising to 120, and notching at the third; ventricular pressure low in diastole, climbing between the first and second lines, peaking with the aorta, and plunging between the third and fourth; atrial pressure low with its a, c, and v bumps. Finish with the volume trace, flat between lines one and two and between lines three and four, and put S1 on the first line and S2 on the third.
Checking the alignment of a Wiggers diagram
Is every valve line vertical, and does it cross every row from the top panel to the time axis?
Does each line pass exactly through its pressure crossover — LV above LA, LV above aorta, LV below aorta, LV below LA?
Is the volume trace flat between the first two lines and between the last two?
Is the dicrotic notch on the aortic trace, on the third line, at about 100 mmHg?
Is S1 on the first line and S2 on the third, with nothing on the opening lines?
Does the QRS come just before the first line, and does the T wave end around the third?
Does aortic pressure stay between about 80 and 120 mmHg, and left atrial pressure stay low?
Most common Wiggers diagram mistakes
A Wiggers diagram is only useful if its traces line up in time. These are the errors that turn up most often in student drawings, online images, and AI output.
MistakeCorrect
MistakeS1 is placed at aortic valve opening, or S2 at mitral valve opening.
CorrectHeart sounds come from valves closing: S1 at mitral (and tricuspid) closure, S2 at aortic (and pulmonary) closure.
MistakeThe dicrotic notch is drawn on the ventricular pressure trace.
CorrectThe notch is on the aortic trace, at aortic valve closure, lined up with S2.
MistakeVentricular volume keeps changing during isovolumetric contraction or relaxation.
CorrectWith both valves closed, the volume trace is flat — at EDV after mitral closure, at ESV after aortic closure.
MistakeValve lines sit somewhere near the crossovers, or stop at the pressure panel.
CorrectEach valve line passes exactly through its pressure crossover and runs straight down through every row.
MistakeAortic pressure drops towards 0 mmHg in diastole.
CorrectAortic pressure only decays to about 80 mmHg before the next ejection; the ventricle is what falls near zero.
MistakeThe QRS is drawn after ventricular pressure has started to rise.
CorrectElectrical precedes mechanical: QRS first, then the pressure rise and mitral closure.
MistakeS3 and S4 appear on a standard diagram of a healthy adult heart.
CorrectA standard Wiggers diagram shows S1 and S2. Add S3 and S4 only when they are the point of the figure.
MistakeLeft ventricular pressure towers far above aortic pressure during ejection.
CorrectIn a normal heart the two traces run almost together; a large gradient means aortic stenosis.
Wiggers diagram vs pressure–volume loop
Both describe the same left ventricular beat. The Wiggers diagram is best for timing; the pressure–volume loop is best for mechanics.
Wiggers diagram
Pressure–volume loop
What is plotted
Several traces against time
Left ventricular pressure against left ventricular volume
Time axis
Yes — one shared axis, about 0.8 s per beat
None — one closed loop per beat
Valve events appear as
Vertical lines where pressure traces cross
The four corners of the loop
Isovolumetric phases appear as
Flat stretches of the volume trace
The two vertical sides of the loop
Stroke volume
Drop in the volume trace, EDV − ESV
Width of the loop
ECG and heart sounds
Shown on their own rows
Not shown
Best for
What happens when, and in what order
Contractility, preload, afterload, and stroke work (loop area)
Wiggers Diagram FAQ
A Wiggers diagram is a graph of one heartbeat drawn as several traces stacked on a single shared time axis: aortic, left ventricular, and left atrial pressure in one panel, left ventricular volume below it, then the ECG and the heart sounds. Because every trace shares the same clock, you can read straight down the page and see what the valves, the pressures, the volume, the electrical signal, and the sounds are doing at the same instant. It is named after the American physiologist Carl J. Wiggers, who published the format in the early twentieth century, and it is still the standard way to teach the cardiac cycle.
Generate heart and circulation diagrams, nerve and muscle physiology graphs, and worksheet-ready medical illustrations with the same SciFigure AI workflow.