
Free DFD creator
Data flow diagram generator with context and level 1 DFD templates
Show where the data in a system comes from, what happens to it and where it is kept: external entities as rectangles, numbered processes as circles, data stores as parallel lines and every data flow as a labelled arrow. Type the flows as text or add them with the builder, and a rule check flags store-to-store flows, black holes and unlabelled arrows as you work. Free, private, with SVG, PNG and PDF export.
DFD rule check: no problems found
Everything runs in your browser: nothing is uploaded, and the diagram is drawn exactly from your code. Undo with Ctrl+Z.
Step by step
How to make a data flow diagram
Six steps from a context diagram to a balanced level 1 DFD, for a lab system, a data pipeline or a systems analysis assignment.
- 1
Draw the context diagram first
Put the whole system in one circle, numbered 0, and the external entities around it: who sends data in and who receives data out. Label every arrow with the data it carries. There are no data stores at this level.
- 2
Split the system into processes
For the level 1 diagram, break process 0 into the main things the system does, numbered 1.0, 2.0, 3.0 and named verb + object: Register sample, Schedule analysis.
- 3
Add the data stores
Wherever data waits between processes, add a data store with a plural noun: Samples, Analysis requests, Results. Number them D1, D2 if your course or team does.
- 4
Connect everything with labelled flows
Write one line per flow: Scientist -->|"sample details"| P1. Each flow is a noun (the data), never a verb or a command. Reads from a store are written backwards, P2 <---|"sample record"| D1, so the store sits below the processes that use it.
- 5
Balance the levels
Every flow that crosses the boundary in the context diagram must appear in level 1, between the same external entity and one of the processes, and no new external flows may appear.
- 6
Clear the rule check, then export
Fix what the rule check lists under the diagram: flows between two stores or two entities, processes without inputs or outputs, unlabelled arrows. Then download SVG or PDF for a report, or PNG for slides.
Templates
Data flow diagram examples to start from
Seven complete DFDs, including a matching context and level 1 pair, a sequencing pipeline and field sensor data. Every one passes the rule check; open one and adapt it.
Notation reference
DFD symbols in Yourdon–DeMarco and Gane–Sarson notation
The four DFD symbols as this tool draws them (Yourdon–DeMarco), with their Gane–Sarson equivalents for comparison. Add puts a working example into the LIMS level 1 diagram.
| Symbol | Element and meaning | Code in this tool |
|---|---|---|
External entity A source or destination of data outside the system (Yourdon–DeMarco rectangle). | Ethics["Ethics committee"] | |
Process Transforms incoming data into outgoing data; numbered, verb + object (a circle). | P5(("5.0<br/>Audit sample use")) | |
Data store Data at rest between processes, a plural noun (two parallel lines). | D4@{ shape: datastore, label: "D4 Consents" } | |
Data flow Data in motion, labelled with a noun for the data it carries. | A -->|"data"| B | |
Read from a data store The same data flow, written from the reading process so the store is laid out below it. The arrow still points at the process. | P2 <---|"data"| D1 | |
Gane–Sarson external entity A square, often shaded, for the same element. | Gane–Sarson shape; this tool draws Yourdon–DeMarco. Same code as an external entity. | |
Gane–Sarson process A rounded rectangle with the number in a top band. | Same element as the circle; write it as a process. | |
Gane–Sarson data store A rectangle open on the right, with its D reference in a box. | Same element as the parallel lines; write it as a data store. |
Common mistakes
Six DFD mistakes and their fixes
Data moving between two stores
WrongAn arrow from Samples straight to Results.
RightData only moves when a process moves it: Samples → 3.0 Record results → Results.
Control flow drawn as data flow
WrongArrows labelled next, yes, no or if valid, and a diamond for a decision.
RightA DFD has no order or decisions. Label arrows with data; draw the steps and decisions in a flowchart.
Black holes and miracles
WrongA process 4.0 Archive results with inputs but no output, or a process that outputs a report from nothing.
RightEvery process takes data in and gives data out. Archiving writes to a store; a report needs the data it reports on.
Unbalanced levels
WrongThe context diagram shows a monthly summary to the lab manager, but no level 1 process produces it.
RightEach external flow of the context diagram appears in level 1 between the same entity and a process.
Verbs on flows, nouns on processes
WrongA flow labelled send results and a process named Results.
RightFlows are nouns (results report); processes are verb + object (4.0 Report results).
Two notations in one diagram
WrongCircles for some processes and rounded rectangles for others.
RightPick Yourdon–DeMarco or Gane–Sarson and use it for every diagram in the set.
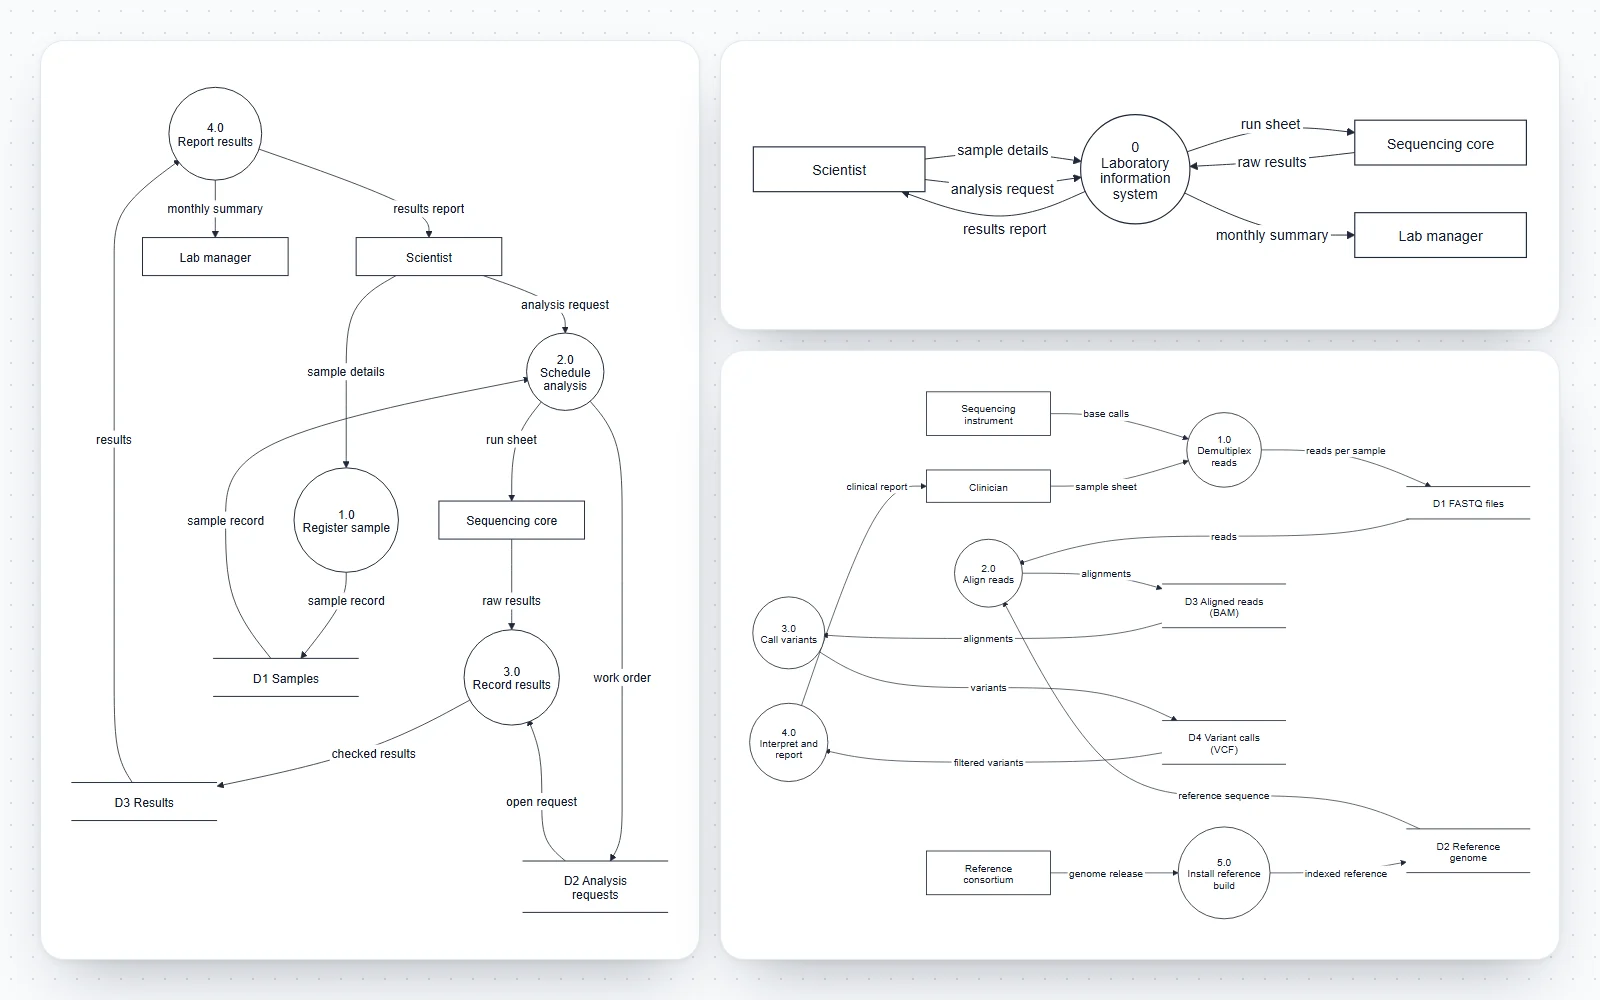
How this DFD maker works
Write processes, stores, entities and flows as short lines, or add them from forms; the diagram is redrawn as you type and every change can be undone.
- Code tab: one element or flow per line, with line numbers and plain-English error messages on the line that needs fixing.
- Build tab: add external entities, numbered processes, data stores with an optional D reference, and data flows picked from the elements already in the diagram. A flow out of a data store is written as a read (P2 <---|"data"| D1), which keeps stores below the processes in the layout.
- Rule check: under the diagram, a live list of anything that breaks the classic DFD rules, with the line number of the flow concerned. It never stops the diagram from drawing.
- Style tab: left-to-right or top-to-bottom layout, a right-angled line style, four figure styles and the text size.
- Seven templates, including a matching context diagram and level 1 diagram for a laboratory information system, a sequencing pipeline, environmental sensor data and a clinical trial.
What is a data flow diagram?
A data flow diagram (DFD) shows how data moves through a system: where it enters from outside, which processes transform it, where it is stored and where it leaves. It comes from the structured analysis methods of the late 1970s, described by Tom DeMarco and by Chris Gane and Trish Sarson.
- A DFD shows data, not control: there are no decisions, loops, start or end points, and no timing. It answers “what data goes where?”, not “in which order?”.
- A DFD is not a UML diagram. UML has no data flow diagram; its activity diagram can show object flows, but most analysts still use DFDs for data mapping. It sits in this editor next to the UML tools because the same code-and-builder approach works for it.
- DFDs are used for requirements analysis, for documenting existing systems, for data protection and privacy mapping (where does personal data go?) and for threat modelling, where each flow crossing a trust boundary is examined.
The four DFD symbols
Every DFD uses just four kinds of element. This tool draws them in Yourdon–DeMarco notation.
- External entity (rectangle): a person, organisation or other system outside the boundary that sends or receives data, such as Scientist, Sequencing core or Payment provider. Also called a terminator, source or sink.
- Process (circle): something the system does that changes data, numbered and named with a verb and an object: 2.0 Schedule analysis.
- Data store (two parallel lines): data at rest that one process writes and another reads later, named with a plural noun: Samples, Results.
- Data flow (arrow): data in motion, labelled with a noun that names the data: sample details, run sheet, checked results.
Yourdon–DeMarco vs Gane–Sarson notation
The two classic DFD notations have the same four elements and the same rules; only the shapes differ. Pick one and use it throughout a document.
- Yourdon–DeMarco: processes are circles (often called bubbles), data stores are two parallel lines, external entities are rectangles. This tool draws this notation.
- Gane–Sarson: processes are rounded rectangles with the process number in a band at the top, data stores are rectangles open at the right with a D reference box at the left, and external entities are squares, often with a shadow.
- Both number processes the same way (1.0, 2.0, then 2.1, 2.2 in the lower level), and both label every flow.
- If your course or organisation requires Gane–Sarson shapes, the model you build here (elements, numbers, flows) carries over unchanged; only the drawing style differs.
Context diagrams and levelled DFDs
Large systems are drawn as a set of diagrams at increasing levels of detail, each process opening into a diagram of its own.
- Context diagram (level 0): the whole system as a single process with every external entity and the flows between them. It fixes the scope.
- Level 1: the main processes of the system, the data stores between them and the same external flows as the context diagram.
- Level 2 and below: one diagram per process that needs more detail, numbered from its parent: process 2.0 opens into 2.1, 2.2 and 2.3.
- Balancing: the inputs and outputs of a process must match the flows that enter and leave its lower-level diagram. The LIMS context and level 1 templates here balance flow for flow.
- Stop decomposing when a process can be described in a short specification (a few sentences or a decision table) without another diagram.
DFD rules the rule check enforces
These rules come from the structured analysis texts and are what examiners and reviewers look for first.
- Every flow starts or ends at a process. Data cannot move from one store to another, from an entity to a store, or between two external entities on its own: something has to move it.
- Every process has at least one input and one output. A process with inputs only is a black hole; one with outputs only is a miracle.
- Every data store is both written and read (in this diagram or another one). A store nobody reads is dead data; a store nobody writes cannot be filled.
- Every flow is labelled with the data it carries. Unlabelled arrows usually hide either control flow or two different data items.
- Also check by eye what a program cannot: a grey hole, whose outputs need data that its inputs cannot supply, and flows labelled with verbs (“send”, “check”) instead of data.
DFD vs flowchart: data flowcharts and process flowcharts
People searching for a data flowchart maker often want one of two different diagrams.
- A flowchart shows control flow: steps in order, decisions with yes and no branches, loops, a start and an end. It answers “what happens next?”.
- A data flow diagram shows data movement: no order, no decisions, just which data passes between which processes, stores and entities.
- A test: if an arrow could be labelled “then” or “yes”, it belongs in a flowchart. If it can only be labelled with the name of some data, it belongs in a DFD.
- The two complement each other: a DFD for the system, then a flowchart or an activity diagram for the steps inside one process.
Logical vs physical DFDs
Both use the same symbols, at different levels of abstraction.
- A logical DFD shows what the system does with data, independent of technology: Register sample, Samples, sample record.
- A physical DFD shows how it is done today or will be done: LIMS web form, PostgreSQL table, CSV export, the named people and programs.
- Analysts often draw the current physical system, abstract it to a logical model, improve the logical model, and then design the new physical one.
Data flow diagrams for research data and lab systems
Research groups handle more data movement than most small businesses, and a one-page DFD makes it visible.
- Data management plans: where raw data comes from, where each version is kept, who processes it and what is deposited in a repository.
- Pipelines: sequencing data from base calls through FASTQ, BAM and VCF files to a report, or sensor readings through quality control to a published dataset.
- Clinical and personal data: which processes see identifiable data, which see pseudonymised data, and which flows leave the institution, the core of a data protection impact assessment.
- Instrument integration: what the LIMS sends to a core facility, what comes back, and which store keeps it.
Generating a DFD from text or with AI
A chat assistant can list the processes, stores and flows of a system from a description; this page turns them into an exact diagram and checks the rules.
- Ask for lines in the format under the code editor: entities as Name["Name"], processes as P1(("1.0<br/>Name")), stores with shape: datastore, and flows as A -->|"data"| B.
- Then read the rule check: generated DFDs often contain store-to-store arrows, verbs as flow labels or processes with no output.
- Nothing is guessed or added: the drawing shows exactly the code.
An exact, editable dataflow diagram maker
Every element and flow you write appears once, in one consistent notation.
- The code is Mermaid flowchart syntax, which GitHub and GitLab render in Markdown, so the DFD can live next to the documentation of the system it describes.
- Export SVG or PDF with real, editable text for a thesis, a data management plan or a design document, or PNG at 2× or 4× for slides.
Frequently asked questions
Is this data flow diagram generator free?
Yes. No sign-up, no watermark and no limits on size or exports. It runs entirely in your browser, nothing you type is uploaded, and your diagram is saved on your device so it is still there next time.
How do I make a data flow diagram?
Start with a context diagram: one process for the whole system and its external entities. Then draw level 1 with the main processes (numbered 1.0, 2.0…), the data stores between them and one labelled arrow per data flow. Here, each element and flow is one line of code, or use the Build tab. The rule check under the diagram lists anything that breaks the DFD rules.
What are the four symbols of a DFD?
External entities (rectangles in Yourdon–DeMarco), processes (circles), data stores (two parallel lines) and data flows (labelled arrows). Gane–Sarson notation uses squares, rounded rectangles and open-ended rectangles for the same three elements.
Is a data flow diagram a UML diagram?
No. DFDs come from structured analysis in the 1970s, before UML. UML has no data flow diagram; the closest is an activity diagram with object flows. DFDs are still widely used for data mapping, privacy reviews and teaching systems analysis.
What is the difference between Yourdon–DeMarco and Gane–Sarson?
Only the shapes. Yourdon–DeMarco draws processes as circles and stores as two parallel lines; Gane–Sarson draws processes as rounded rectangles with a number band and stores as open-ended rectangles with a D reference. The elements, numbering and rules are the same. This tool draws Yourdon–DeMarco.
What is a context diagram (level 0 DFD)?
The top-level DFD: the whole system as one process, surrounded by the external entities it exchanges data with, and no data stores. Open the LIMS, context template to see one, and the LIMS, level 1 template for the diagram that expands it.
What is a level 1 DFD?
The diagram that breaks the context diagram’s single process into its main processes, with the data stores between them. Its external flows must match the context diagram exactly; that is called balancing.
What are the rules of a DFD?
Every flow touches a process (no store-to-store, entity-to-store or entity-to-entity flows), every process has an input and an output, every store is written and read, and every flow is labelled with the data it carries. Levels must balance. The rule check here tests all but balancing, which you compare between two diagrams.
What is the difference between a DFD and a flowchart?
A flowchart shows the order of steps and the decisions between them. A DFD shows which data moves between processes, stores and outside entities, with no order and no decisions. Use a DFD for the system’s data, a flowchart for the steps inside one process.
Can an external entity write directly to a data store?
No. In a DFD, data reaches a store only through a process, because something in the system has to receive, check and file it. Add the process between them, such as 1.0 Register sample.
Can I generate a DFD with AI?
You can ask a chat assistant to list the entities, processes, stores and flows in the format shown under the editor, then paste the lines here. The diagram is drawn exactly from the code, and the rule check points out the usual problems in generated DFDs, such as store-to-store flows or unlabelled arrows.
Does the code work in GitHub or GitLab?
Mostly. The editor uses Mermaid flowchart syntax, which GitHub and GitLab render in Markdown. Two details differ there: the data store shape is recent, so an older renderer may not draw it, and reads written backwards (P2 <---| … | D1) show their arrowhead only here; write them D1 -->| … | P2 for other renderers. Use More, then Copy as Markdown block.
Which file format is best for a report or an assignment?
SVG or PDF: they are vector formats with real text, sharp at any size and editable in Illustrator, Inkscape or PowerPoint. Use PNG at 2× or 4× for slides and web pages.
Related diagram tools

Workflow Diagram Generator
Flowcharts of steps and decisions, for the order of work inside one process.
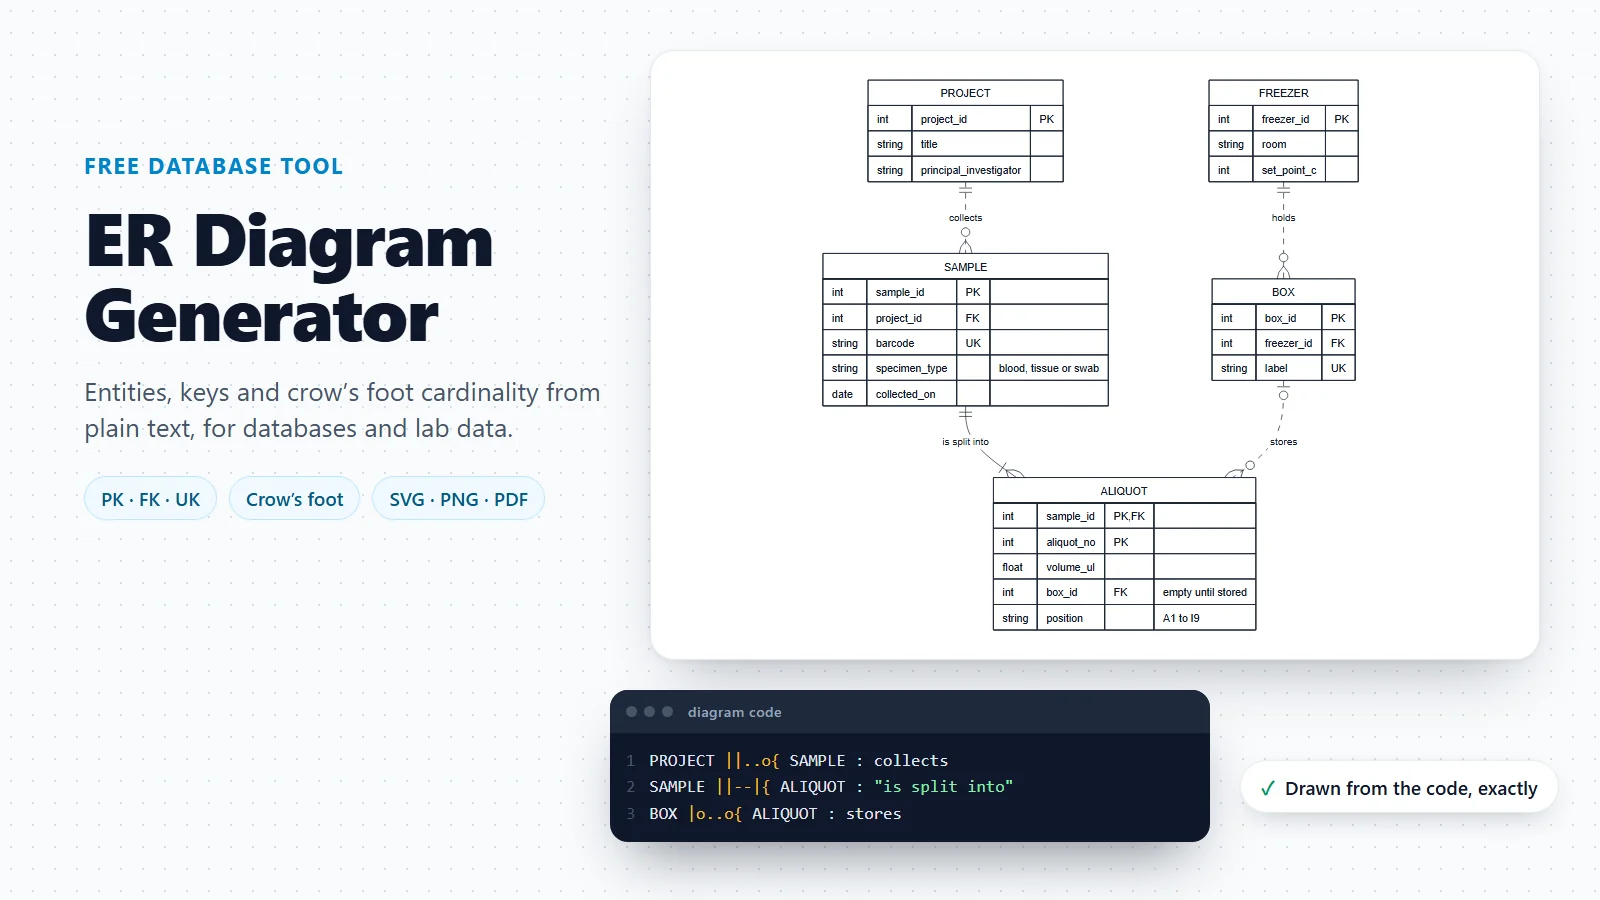
ER Diagram Generator
The data stores of a DFD, designed as tables with keys and cardinality.
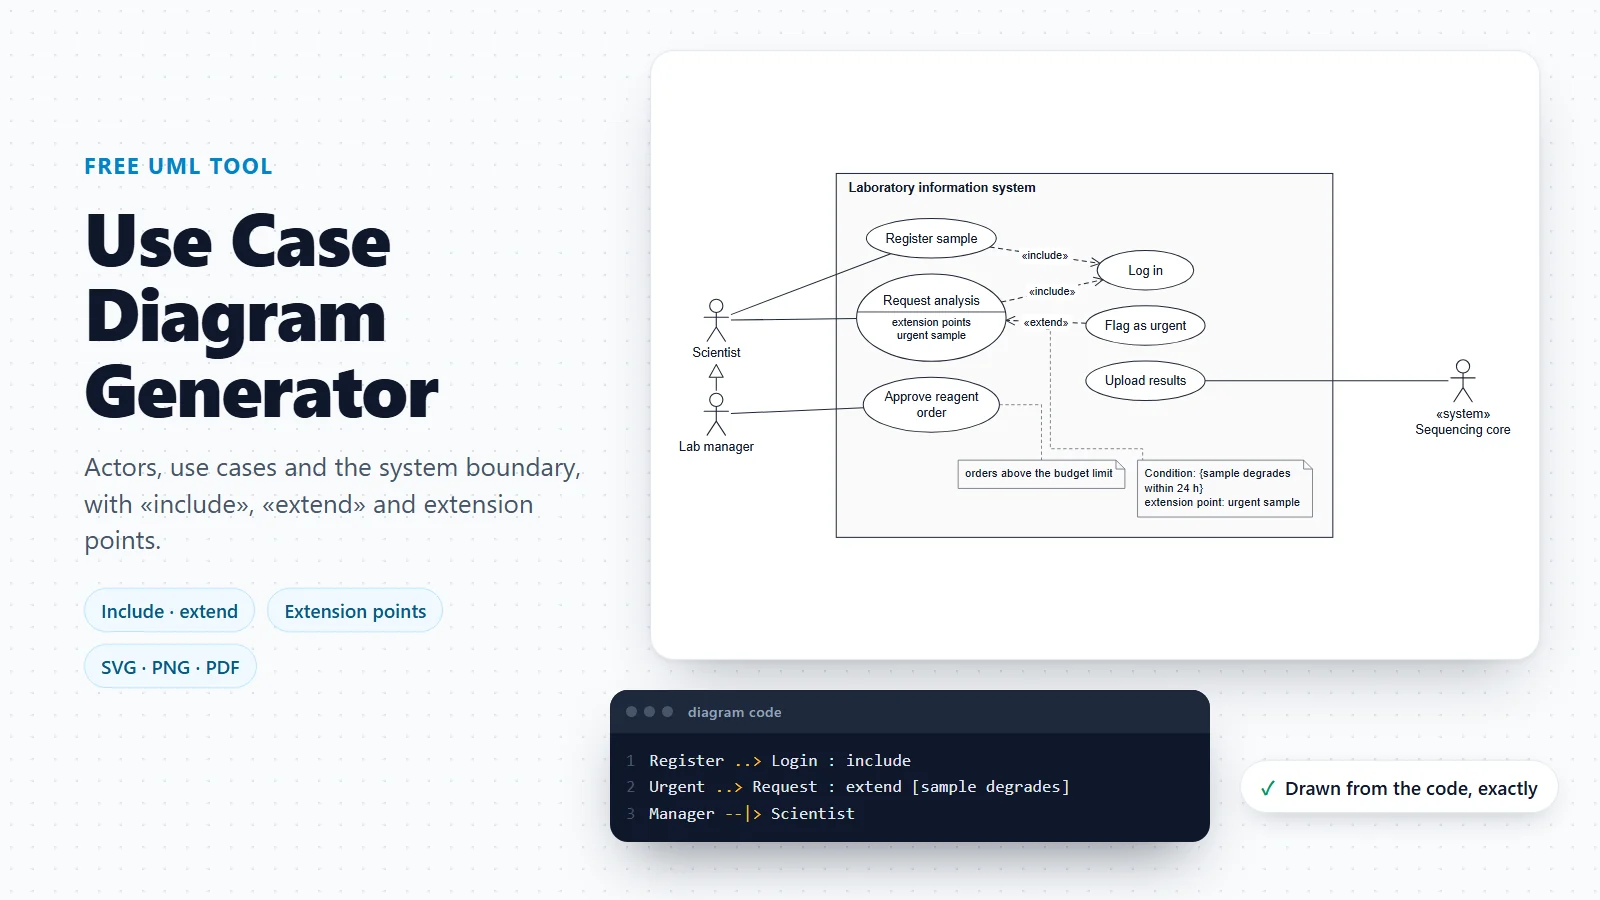
Use Case Diagram Generator
Who uses the system and for which goals, before mapping its data.
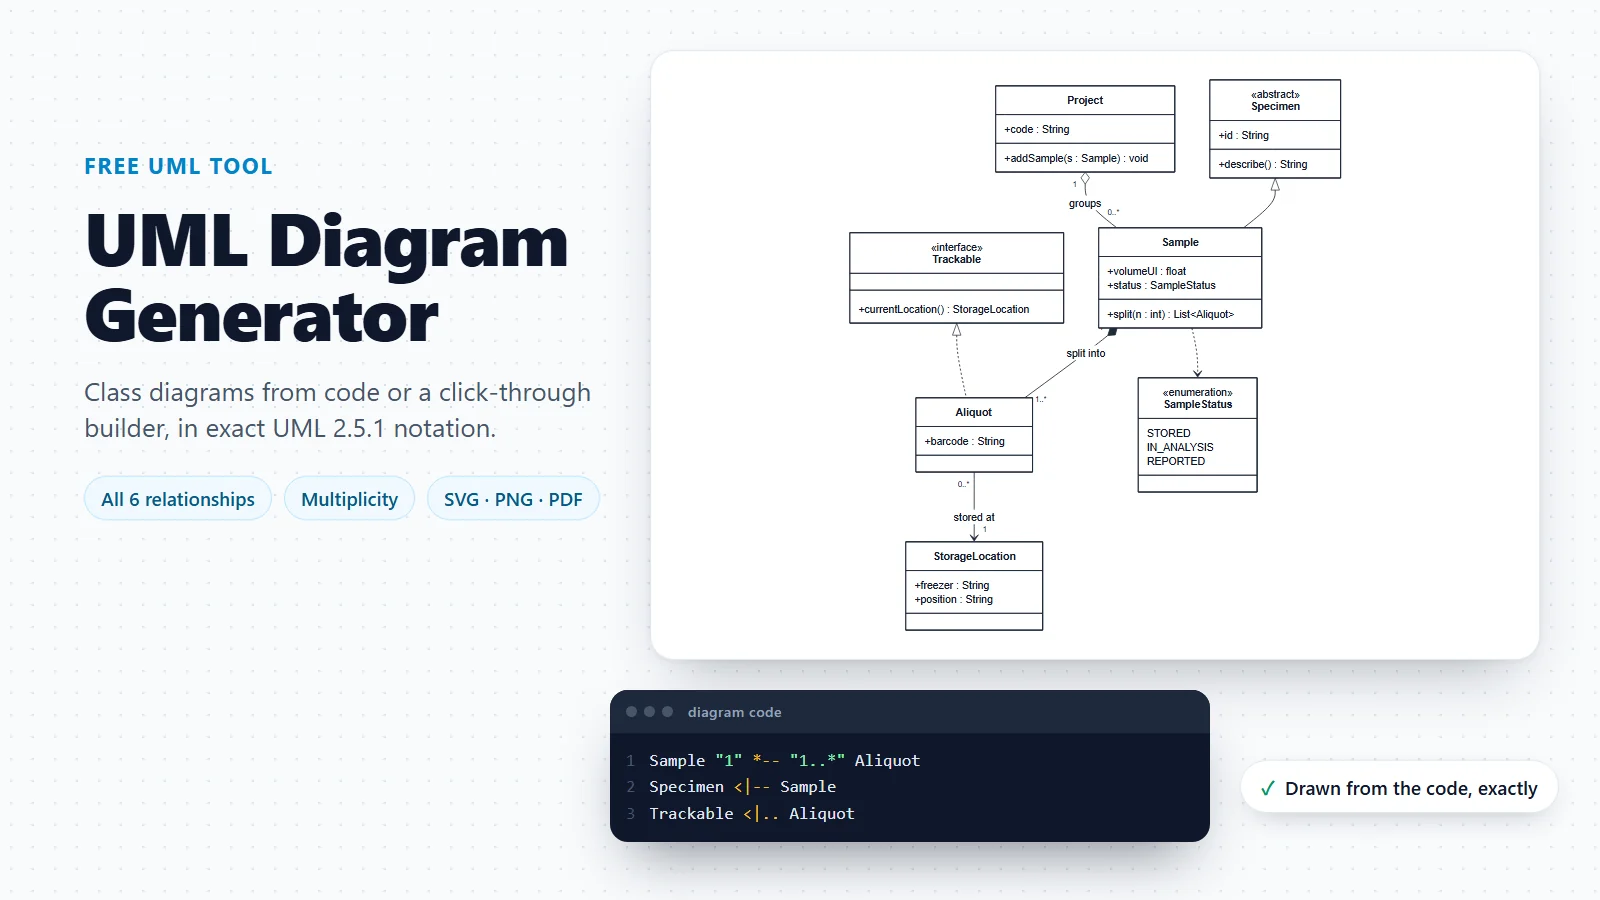
UML Diagram Generator
Class diagrams and a guide to all 14 UML diagram types.
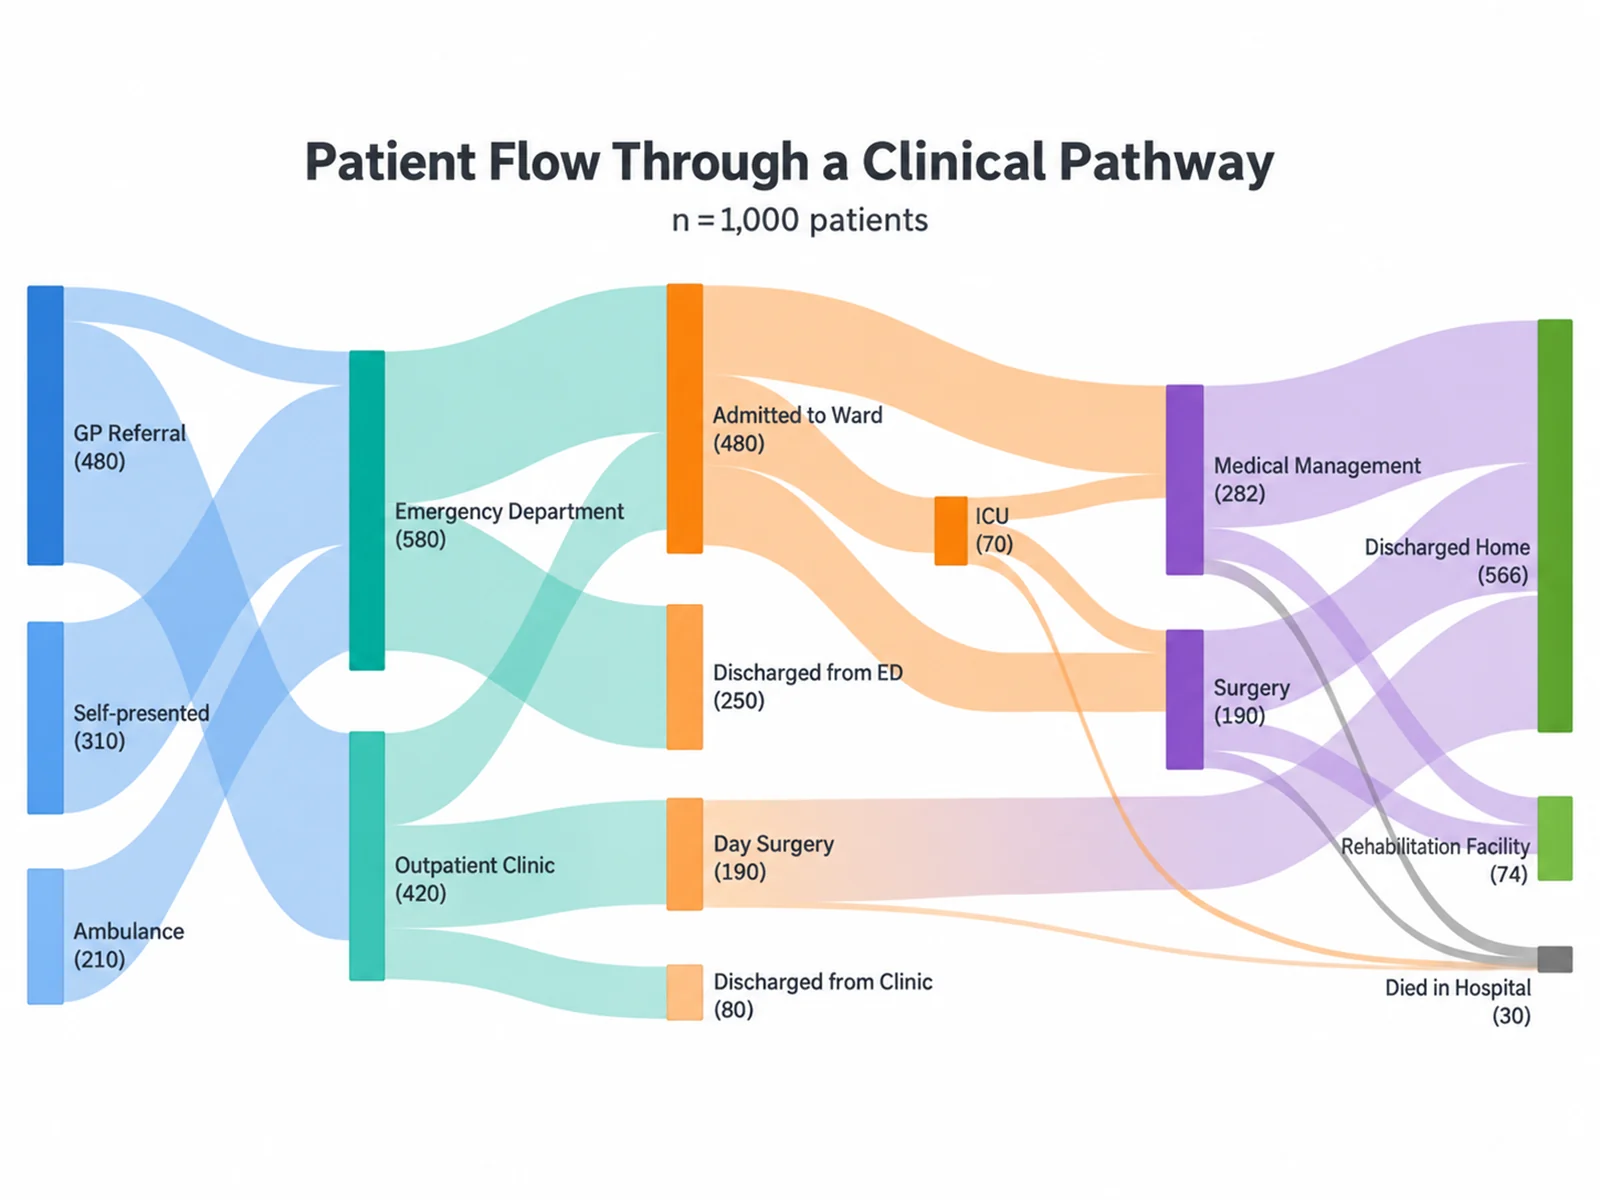
Sankey Diagram Generator
When the amount matters: flows drawn with widths proportional to their size.
Need the steps and decisions instead?
If your arrows mean “then” or “if yes”, you are drawing a flowchart, not a DFD. The workflow diagram generator turns a short description into one.
Open the workflow diagram generatorLast checked: November 17, 2026. Sources: DeMarco, Structured Analysis and System Specification (Yourdon Press, 1978); Gane and Sarson, Structured Systems Analysis: Tools and Techniques (Prentice-Hall, 1979); Yourdon, Modern Structured Analysis (Yourdon Press, 1989); Mermaid flowchart syntax, including the data store shape. The laboratory, pipeline and clinical templates are illustrative models, not the design of any real product. A data flow diagram is not part of UML; it shares this editor with the UML tools.