
Free organizational chart maker
Org chart maker and hierarchy chart generator, free online
Type your team as an indented list, one person per line with their job title, or paste a CSV of name, title and manager, and get a clean organizational chart: cards of one size on aligned levels, managers centred over their teams, assistants beside the reporting line, dotted-line reports, open positions and large teams collapsed into a +N badge. Top-down or left to right, with a colour per team. Free, private, with SVG, PNG and PDF export.
Everything runs in your browser: nothing is uploaded, and the diagram is drawn exactly from your code. Undo with Ctrl+Z.
Step by step
How to make an org chart
Six steps that work for a research lab, a department, a company or any hierarchy chart.
- 1
Start with the person at the top
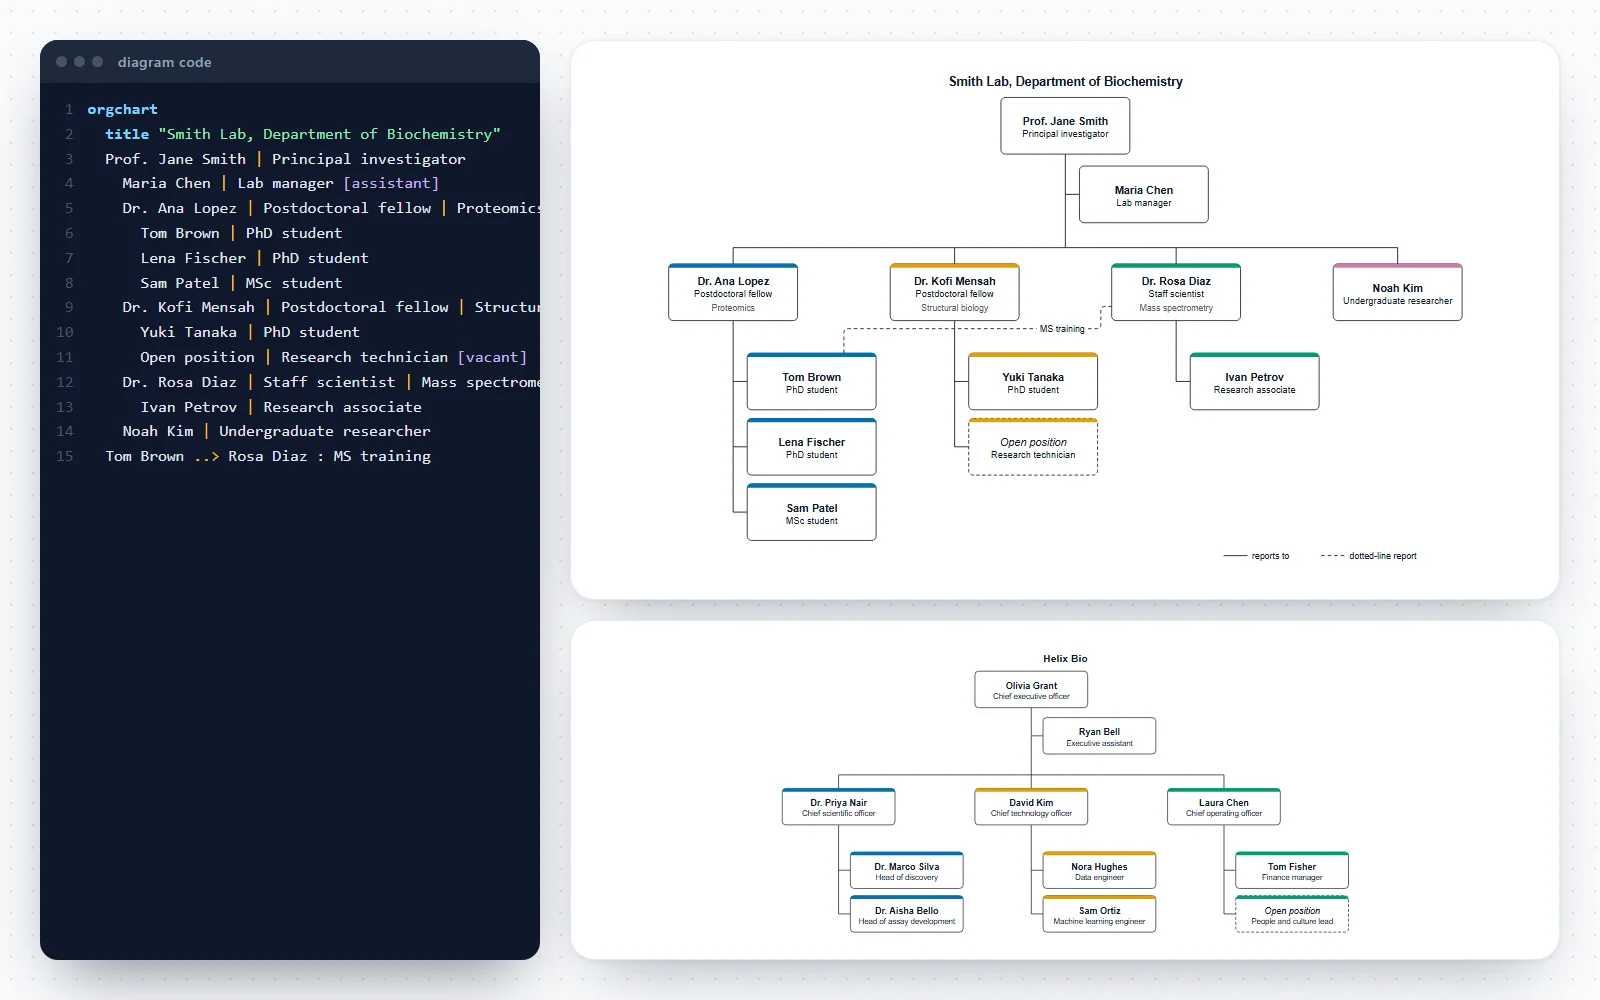
Write the head of the lab, department or company on the first line under orgchart: Name | Job title. Add a third part for a team or research area if it helps: Dr. Ana Lopez | Postdoctoral fellow | Proteomics.
- 2
Indent each person under their manager
One person per line, indented two spaces more than their manager. The indentation is the reporting line, exactly as in an indented list. Or paste a list or a CSV in the Build tab and let the tool indent it.
- 3
Mark assistants, open positions and dotted lines
Add [assistant] to someone who supports a manager rather than leading a team, [vacant] to a position you are hiring for, and a line such as Tom Brown ..> Rosa Diaz : MS training for a second, indirect manager.
- 4
Fit large teams on the page
Staff without reports are stacked in a column under their manager. Add [collapsed] to a manager to show their team as a +N badge, or set Levels shown to keep only the top two, three or four levels.
- 5
Choose the layout and style
Top-down suits most charts; left to right suits deep hierarchies on a wide slide. Pick a figure style, the text size and whether each team gets its own colour.
- 6
Check and export
Read every reporting line once (who does this person report to?), add the date to the title, then download SVG or PDF for a document and PNG for slides or a website.
Templates
Org chart examples to start from
Six complete organizational charts, from a simple three-level hierarchy to a research lab, a university department, a core facility, a hospital unit and a startup. Open one in the editor and replace the names.
Notation reference
Org chart elements and their code
Cards, reporting lines, assistants, dotted lines, open positions and collapsed teams, what each means and how to write it. Add puts a working example into the research lab chart.
| Symbol | Element and meaning | Code in this tool |
|---|---|---|
Person (card) Name, job title and an optional team or detail, separated by |. | Jane Smith | Principal investigator | Biochemistry | |
Reporting line Indent a person two spaces under their manager; the line is drawn for you. | Dr. Lee Park | Staff scientist
Ava Ross | PhD student | |
Assistant Supports a manager; drawn beside the manager’s line, not as a level. | Maria Chen | Lab manager [assistant] | |
Dotted-line report A second, indirect manager: a project lead or co-supervisor. | Tom Brown ..> Rosa Diaz : MS training | |
Open position A role you are hiring for, drawn as a dashed card. | Open position | Bioinformatician [vacant] | |
Collapsed team The team under a manager shown as a +N badge. | Dr. Ana Lopez | Postdoctoral fellow [collapsed] | |
Stacked staff People without reports listed in a column under their manager. | On by default: Style tab, Stack staff without reports. | |
| levels 2 | Levels shown Only the top levels; deeper teams become +N badges. | levels 2 |
| TB · LR | Direction Top-down (default) or left to right. | direction LR |
| title | Title A heading above the chart; add the date. | title "Smith Lab, November 2026" |
Reference
Organizational structures and how to draw them
The common ways organisations are structured, what each looks like on a hierarchy chart and how to write it here.
| Structure | What it looks like | How to chart it here |
|---|---|---|
| Functional (hierarchical) | Departments by function under one head | Indent each department and its staff under the head |
| Divisional | Divisions by product, region or client, each with its own functions | One branch per division; Colour each team keeps them apart |
| Matrix | People report to a line manager and to a project lead | Solid line (indentation) to the line manager, dotted line ..> to the project lead |
| Flat | Few levels, wide teams | Stack staff without reports, or draw left to right |
| Research lab | Principal investigator, subgroup leaders, students, a lab manager | Lab manager as [assistant]; co-supervision as a dotted line |
| Committee or consortium | A board or steering group above work packages | The board at the top; advisory bodies as dotted lines or a second top card |
Common mistakes
Six org chart mistakes and their fixes
Two solid lines to one person
WrongA postdoc drawn under two PIs with solid lines, or listed twice.
RightGive each person one line manager (the indentation) and show the second relationship as a dotted line: Postdoc ..> Co-PI : co-supervisor.
An assistant drawn as a level
WrongThe executive assistant placed in the row of directors, as if they led a department.
RightMark them [assistant]: they are drawn beside the manager’s line, between the manager and the team.
Inconsistent job titles
WrongPostdoc, Post-doctoral researcher and Research fellow for the same role.
RightUse one form per role across the chart, and the official titles if the chart is for HR or a grant.
Everyone on one page
WrongEighty cards in six levels, too small to read.
RightShow the top levels (levels 3), collapse large teams, and make one chart per department.
No date on the chart
WrongA chart from two years ago still on the lab website.
RightPut the month and year in the title and keep the code, so updating it takes a minute.
Meaning carried by colour alone
WrongRed cards for vacant positions, green for contractors, with no legend.
RightUse [vacant] (dashed card) and words in the card; keep colour for grouping teams.
How this org chart maker works
Write the hierarchy as an indented list or build it from forms; the chart is redrawn as you type and every change can be undone.
- Code tab: one person per line (Name | Job title | Team), indented under their manager, plus optional lines for a title, the direction, the levels shown and dotted-line reports. Mistakes get a plain-English message with the line number.
- Build tab: add a person under any manager (the line is placed after the rest of that manager’s team), add a dotted-line report, or import an indented list or CSV rows of name, title and manager.
- The layout is automatic and repeatable: every card has the same size, levels line up across the chart and each manager sits centred over their team. The same text always gives the same chart.
- Style tab: top-down or left to right, levels shown, stacked staff, a colour-blind-safe colour per team, four figure styles, the text size and compact spacing. Six templates, from a three-level hierarchy to a university department.
- Everything stays in your browser: names are never uploaded, and the chart is saved only on this device.
What is an org chart?
An org chart (organizational chart, or organization chart) is a diagram of who reports to whom: each box is a position, usually with the person’s name and job title, and the lines between boxes are reporting lines. It shows the structure of a team or an organisation at a glance: the levels, the size of each team and where a role sits.
- A hierarchy chart is the general name for any chart of ranked levels, an org chart being the most common one. In programming, a hierarchy chart (or structure chart) shows how a program’s modules call each other; the same tree drawing works for both.
- One of the earliest known organizational charts was drawn for the New York and Erie Railroad in 1855 by its general superintendent, Daniel McCallum, with George Holt Henshaw. It is held by the Library of Congress.
- An org chart shows formal reporting lines. It does not show how work flows between teams; a swimlane diagram does that.
Organizational structures and how to chart them
- Functional (hierarchical): departments by function (research, operations, finance) under one head. Indent each department under its head.
- Divisional: each division (a product, region or client group) has its own functions. Make each division a branch; the team colours separate them.
- Matrix: people report to a line manager and also to a project or programme lead. Draw the line manager as the solid reporting line and the second manager as a dotted line.
- Flat: few levels and wide teams. Stacked staff keep a wide team in a narrow column; a left-to-right chart can help too.
- Research labs are usually led by a principal investigator, with postdocs or staff scientists who supervise students in subgroups and a lab manager who supports the whole lab.
Assistants, dotted lines and open positions
- An assistant (an executive assistant, a lab manager who supports the PI, a unit clerk) is drawn beside the manager’s reporting line, between the manager and the team, because they support the manager rather than lead a level of the hierarchy. Mark them with [assistant].
- A dotted line is a secondary, indirect reporting relationship: a project lead, a co-supervisor, a matrix manager, a committee the person reports to on one topic. The solid line stays with the line manager.
- An open position is drawn as a dashed card with its name in italics. Write the role and add [vacant]: Open position | Research technician [vacant].
- A legend explaining the solid and dotted lines is added automatically when the chart has dotted lines.
Large organizations: stacking, collapsing and levels
- Stacked staff: people who have no reports are listed in a column under their manager instead of a long row, so a team of eight takes the width of two cards. More than five are split into two columns. Turn it off for a classic row layout.
- Collapsed teams: add [collapsed] to a manager and their whole team is replaced by a +N badge with the number of people hidden. Assistants stay visible.
- Levels shown: keep only the top two, three or four levels for an overview, and make a separate chart for each department.
- Left to right: deep hierarchies with many levels often fit a landscape slide better from left to right.
Import from a spreadsheet, an HR export or a list
- CSV: paste rows of name, title and manager, with an optional team column. A header row is recognised by its column names (name, title or position, manager or reports to, department or team); commas, semicolons and quoted values work.
- People whose manager is empty become the top of the chart; a manager that is not in the list, or a reporting loop, is reported and the person is placed at the top level instead of being lost.
- Indented list: paste an outline from a document or an email, with spaces, tabs or bullets. “Name – Title”, “Name, Title” and “Name | Title” are all understood.
- Imports replace the people in the chart and keep the title and settings; undo brings the previous chart back.
Org charts for research labs, departments and facilities
- A lab website or a lab handbook: who leads each subgroup, who to ask about equipment, safety and ordering.
- Onboarding new students and staff, and showing a visiting committee how a department or a core facility is organised.
- Grant and consortium proposals often describe a project’s management structure; a clear chart of the people and committees makes that section easier to read.
- Hospital units and clinical research teams: charge nurses per shift, the nurse manager, the educator and the medical director on a dotted line.
- The templates are illustrative: replace the names and titles with your own.
Design tips for a readable hierarchy chart
- Use the same form of job title everywhere (Postdoctoral fellow, not Postdoc in one card and Post-doctoral researcher in another).
- Keep three or four levels per page. Split a large organisation into a top-level chart and one chart per department.
- Date the chart in its title (Smith Lab, November 2026); org charts go out of date quickly.
- Colour carries the team, not the meaning of a line: the team colours come from the colour-blind-safe Okabe–Ito palette, and every card still has its text.
- Leave out photos and personal details unless everyone has agreed; names and roles are enough for most uses.
Exporting for documents, slides and websites
- SVG and PDF are vector files with real, editable text: sharp at any size in Word, PowerPoint, Illustrator or Inkscape.
- PNG at 2× (or 4× from More) for slides, intranets and lab websites.
- The code is plain text: keep it with the chart and update it when someone joins or leaves, instead of redrawing boxes.
Frequently asked questions
Is this org chart maker free?
Yes. Drawing, the templates, list and CSV import and every export (SVG, PNG and PDF) are free, with no account and no watermark.
How do I make an org chart?
Write the person at the top on the first line as Name | Job title, then each other person on their own line, indented two spaces under their manager. Mark assistants with [assistant] and open roles with [vacant], add dotted lines with A ..> B, and download the chart as SVG, PNG or PDF. The Build tab does the same with forms.
What is the difference between an org chart and a hierarchy chart?
An org chart is a hierarchy chart of people and positions: who reports to whom. Hierarchy chart is the broader term for any chart of ranked levels, such as the modules of a program, a taxonomy or the levels of a committee structure. This tool draws both: each line is a box and the indentation sets the level.
How do I make a hierarchy chart online?
Type the levels as an indented list (or paste one), one item per line, and the hierarchy chart is drawn as you type: the first line at the top, each indented line under the line above it. Choose top-down or left to right, then download the chart. Nothing to install and nothing uploaded.
Can I import an org chart from Excel or a CSV file?
Yes. In Excel or Google Sheets, keep columns for name, job title and manager’s name (and optionally team), copy the rows and paste them into Import CSV in the Build tab. People without a manager go to the top; a manager name that is not in the list is reported instead of silently dropped.
How do I show an assistant in an org chart?
Add [assistant] at the end of the person’s line, indented under the manager they support. The card is drawn beside the manager’s reporting line rather than on the team’s level. Assistants cannot have their own reports in this tool.
What does a dotted line mean on an org chart?
A dotted (or dashed) line shows a secondary, indirect reporting relationship: the person also answers to someone other than their line manager, for a project, a programme or one area such as safety. Write it as Person ..> Second manager : what it is for.
How do I show a vacant position?
Write the role in place of a name and add [vacant]: Open position | Research technician [vacant]. The card is drawn with a dashed border and the name in italics.
How do I fit a large organization on one page?
Keep Stack staff without reports on, collapse big teams with [collapsed], or set Levels shown to the top two or three levels. For a whole institution, make a top-level chart and a separate chart per department.
Should an org chart be top-down or left to right?
Top-down is the convention and reads best for most teams. Left to right suits charts with many levels on a wide slide. Switch with the Direction option; the cards and lines are redrawn.
Can I add photos to the cards?
No. Cards carry a name, a job title and an optional team, which keeps the chart small, accessible and free of personal images. If you need photos, export the SVG and place them in a drawing program.
How do I make an org chart for a research lab?
Open the Research lab template: the principal investigator at the top, the lab manager as an assistant, postdocs and staff scientists with their students, an open position and a dotted line for training. Replace the names and titles with your own.
Are the names I type uploaded anywhere?
No. The chart is drawn in your browser and saved only in this browser’s storage. Nothing is sent to a server, so staff names stay on your device.
Which file format should I use?
SVG or PDF for documents and reports: vector files with real text, sharp at any size. PNG at 2× or 4× for slides, intranet pages and websites.
Who drew the first organizational chart?
One of the earliest known organizational charts was made for the New York and Erie Railroad in 1855 by Daniel McCallum, its general superintendent, and drawn by George Holt Henshaw. A copy is held by the Library of Congress.
Related diagram tools
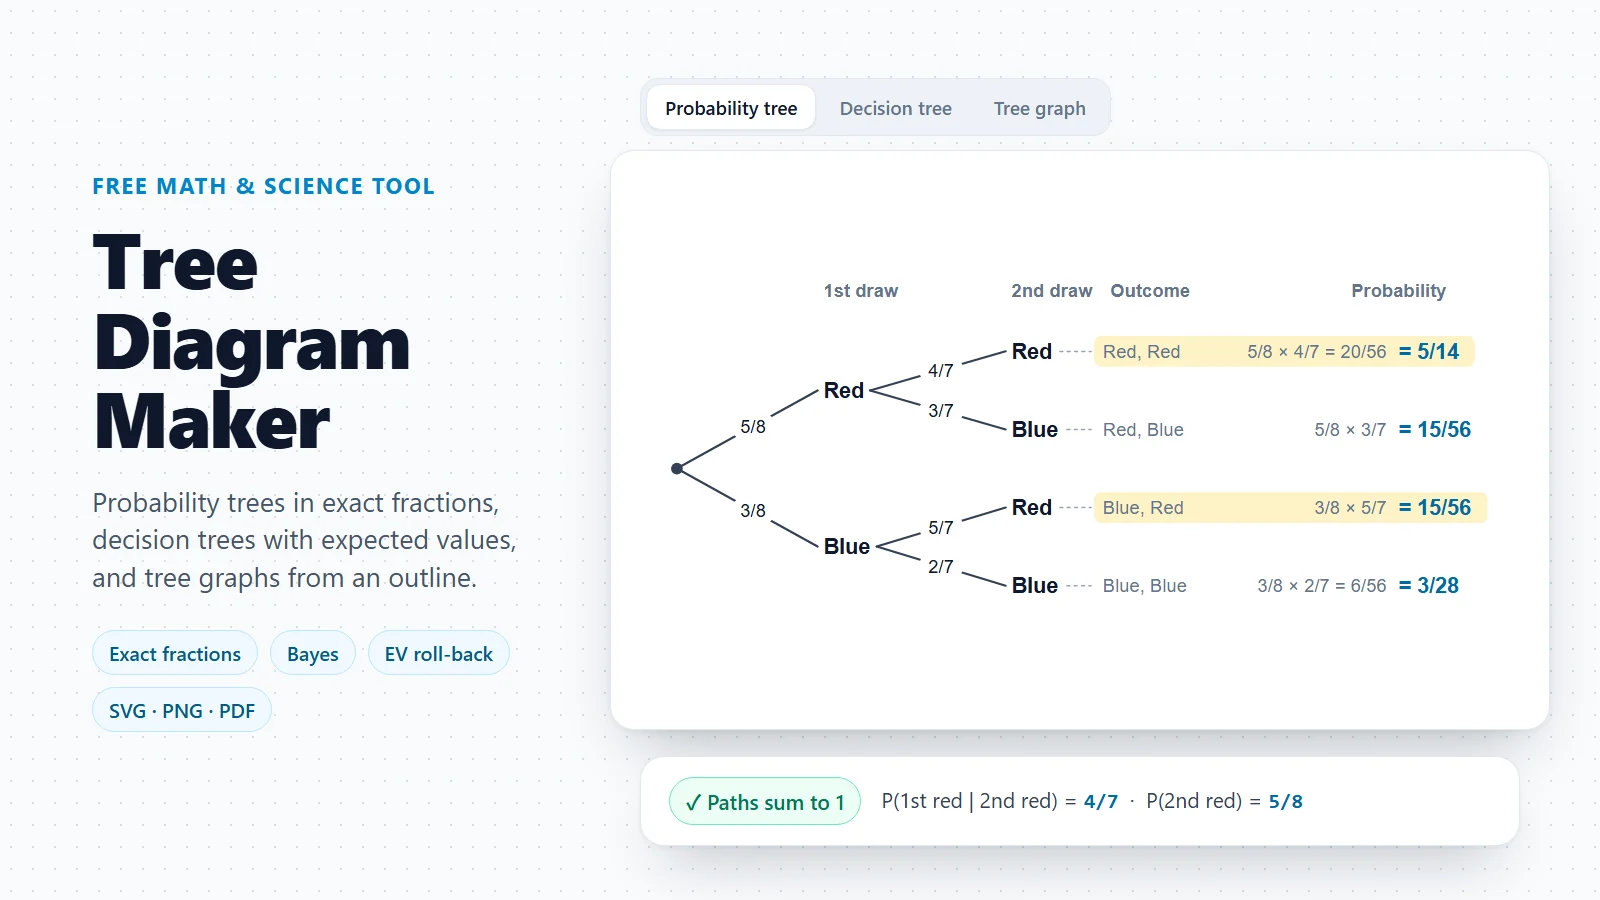
Tree Diagram Maker
Probability trees, decision trees and tree graphs drawn from an outline.
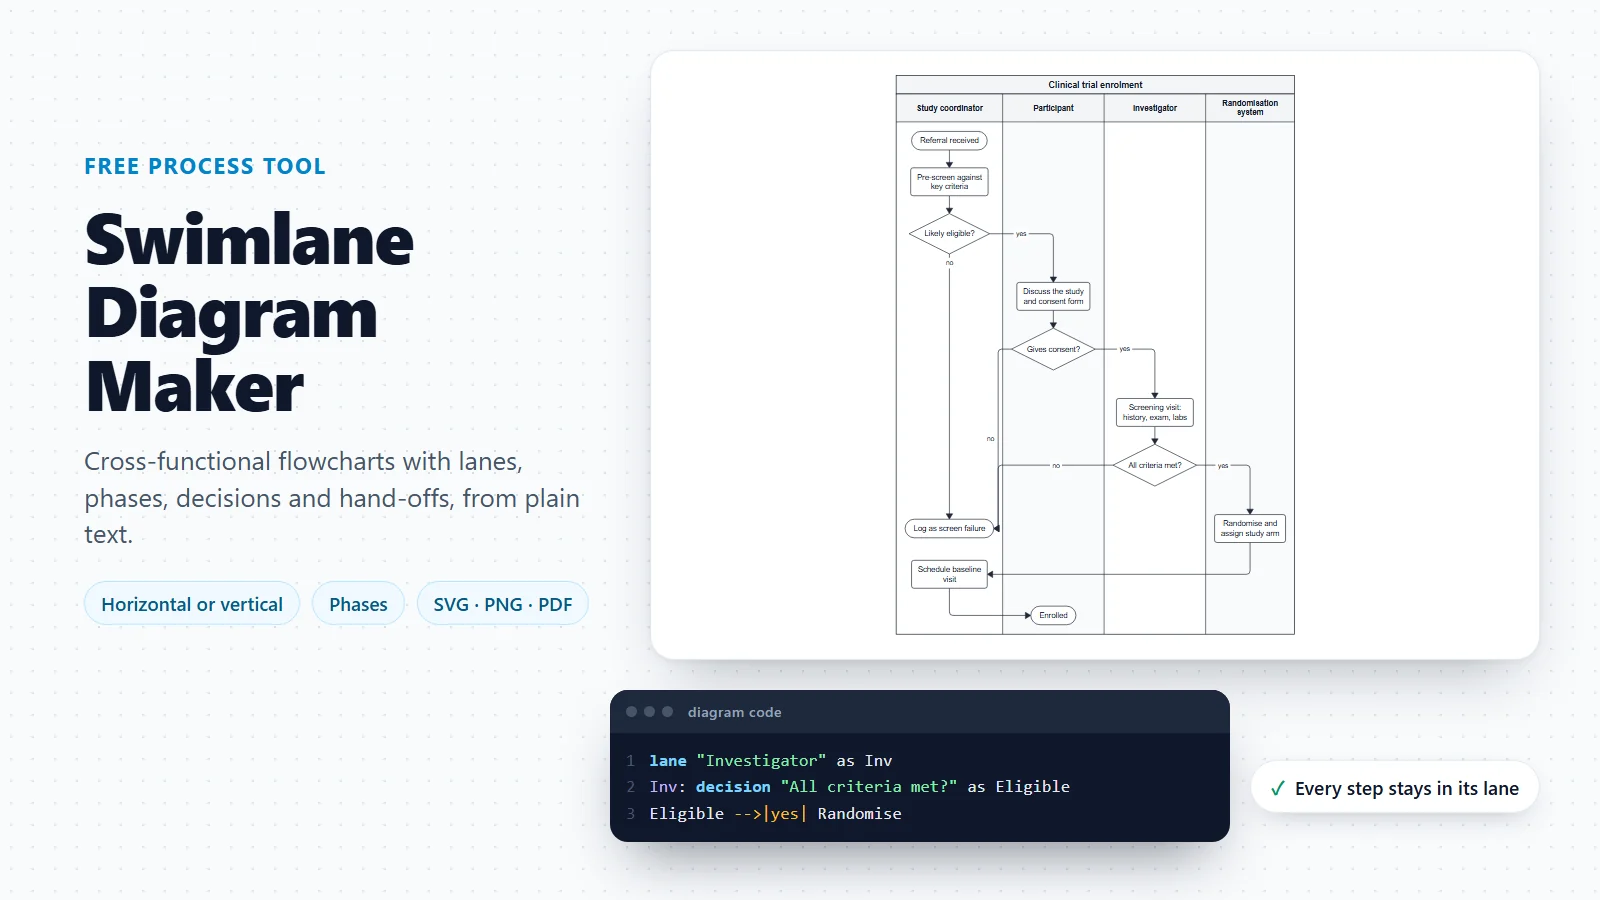
Swimlane Diagram Maker
What the roles on the chart do together: a process in lanes, with every hand-off visible.
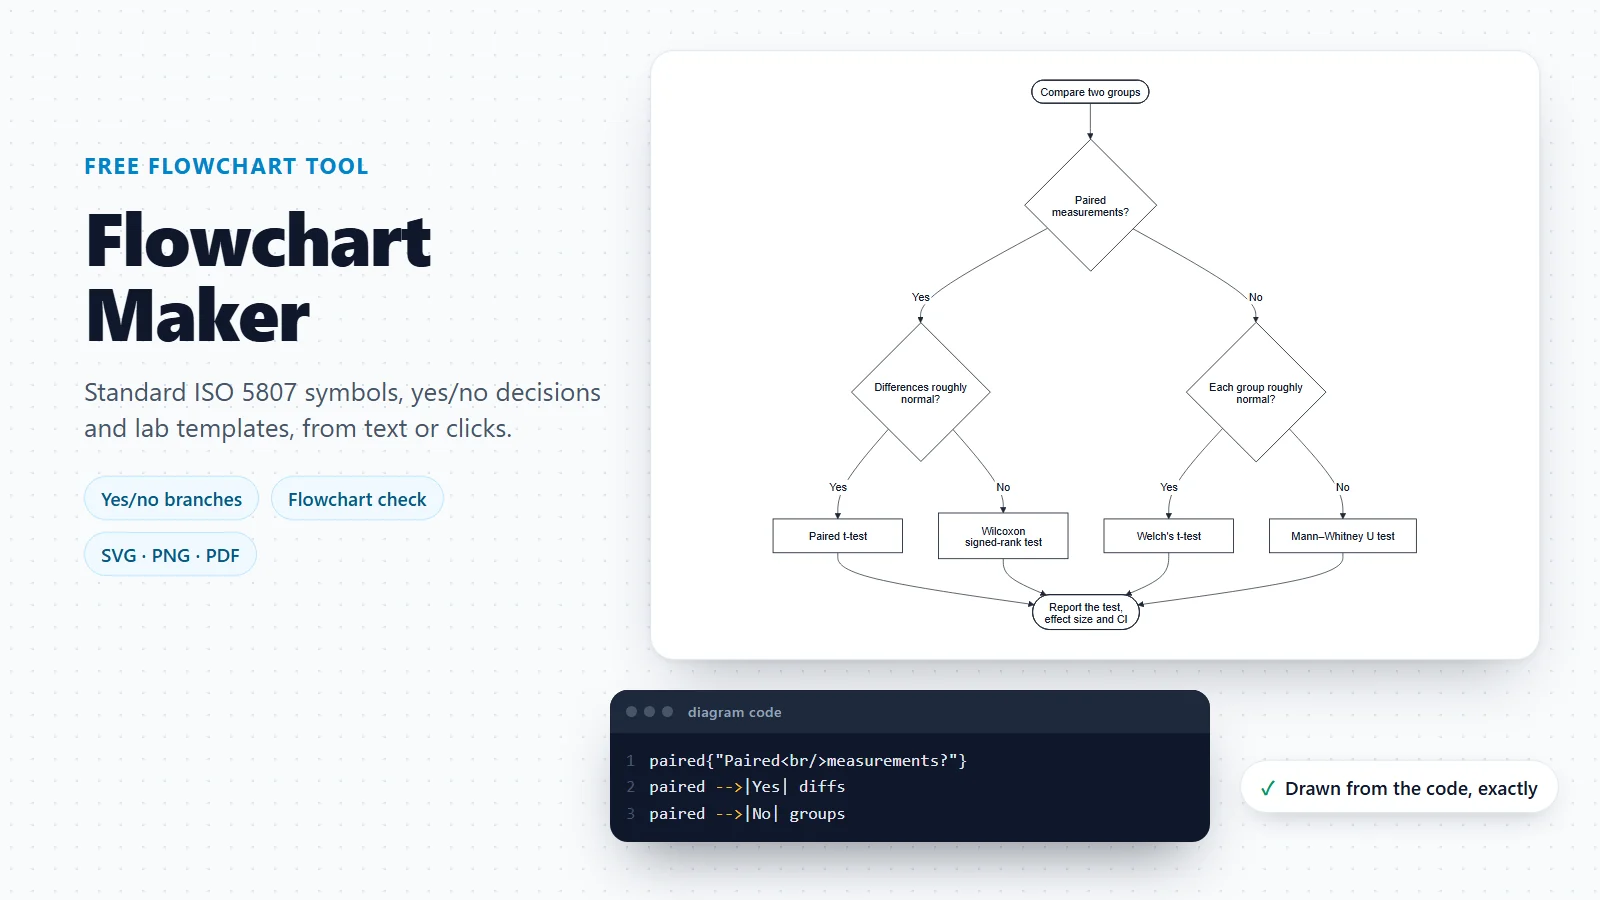
Flowchart Maker
Steps, decisions and loops of a procedure, without lanes.
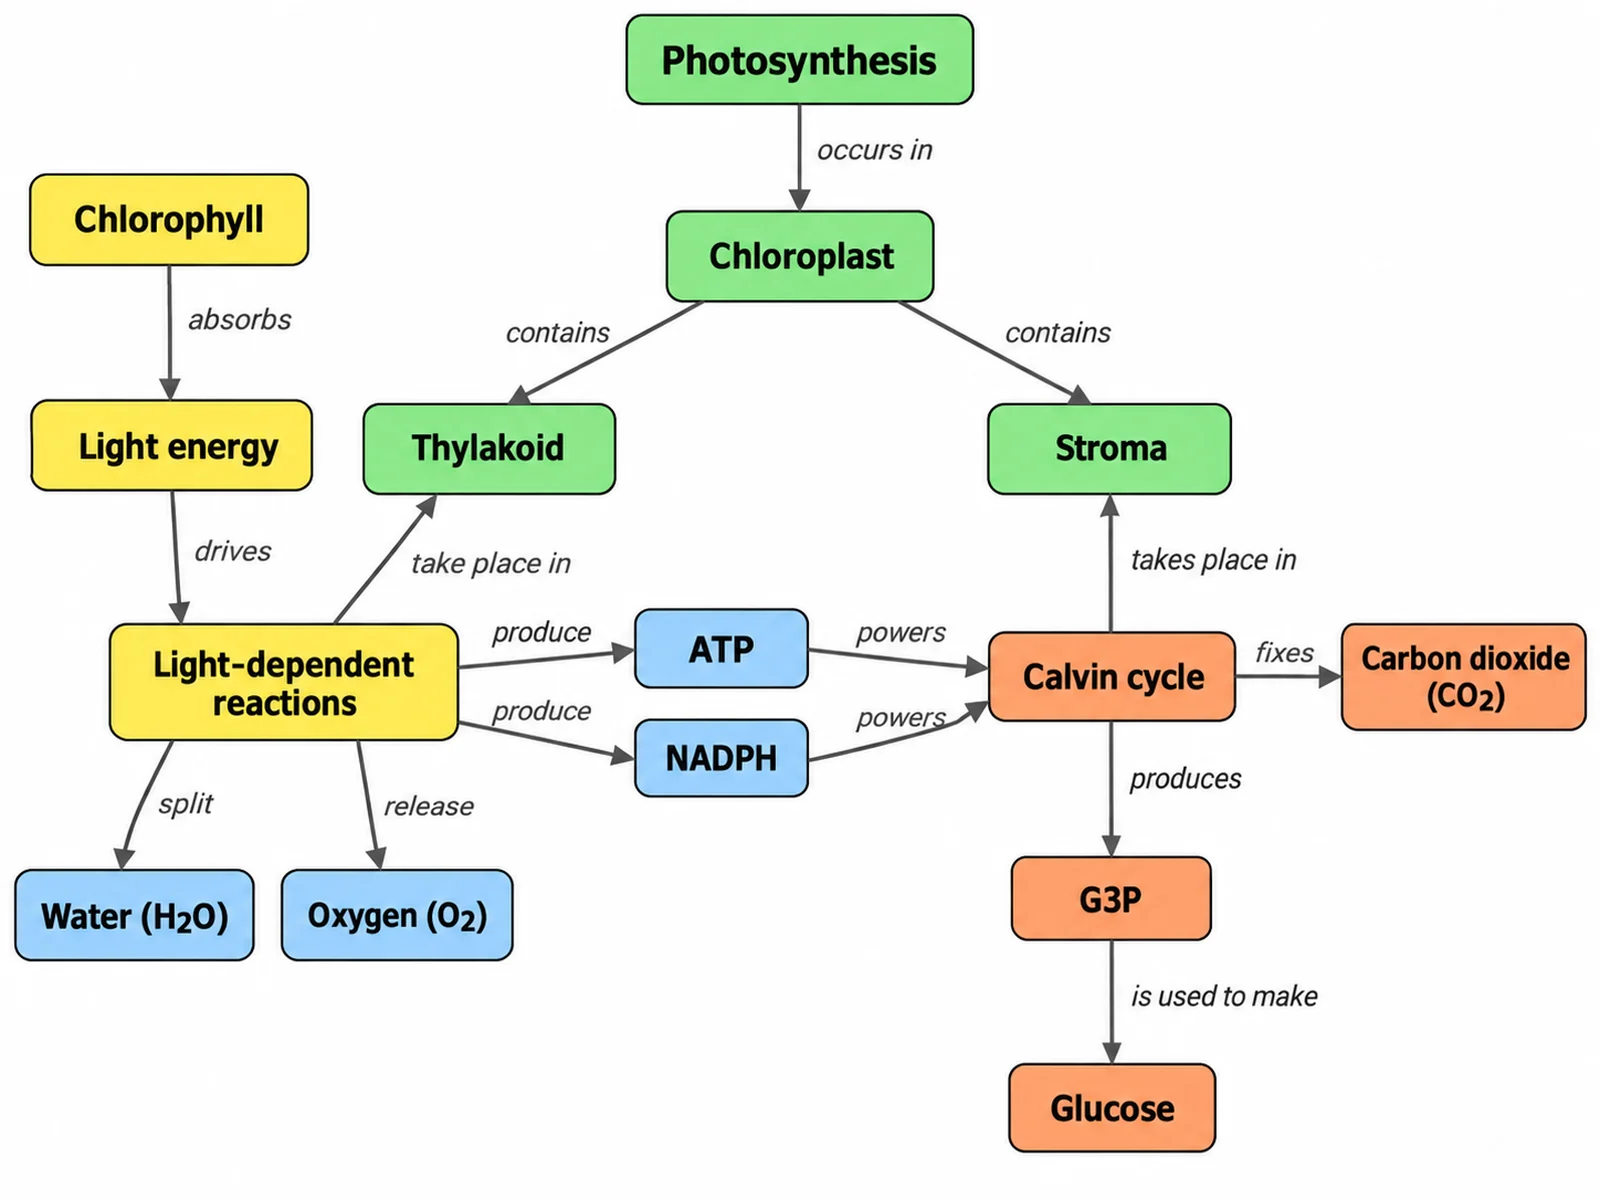
Concept Map Generator
Ideas and how they relate, when the structure is a network rather than a hierarchy.
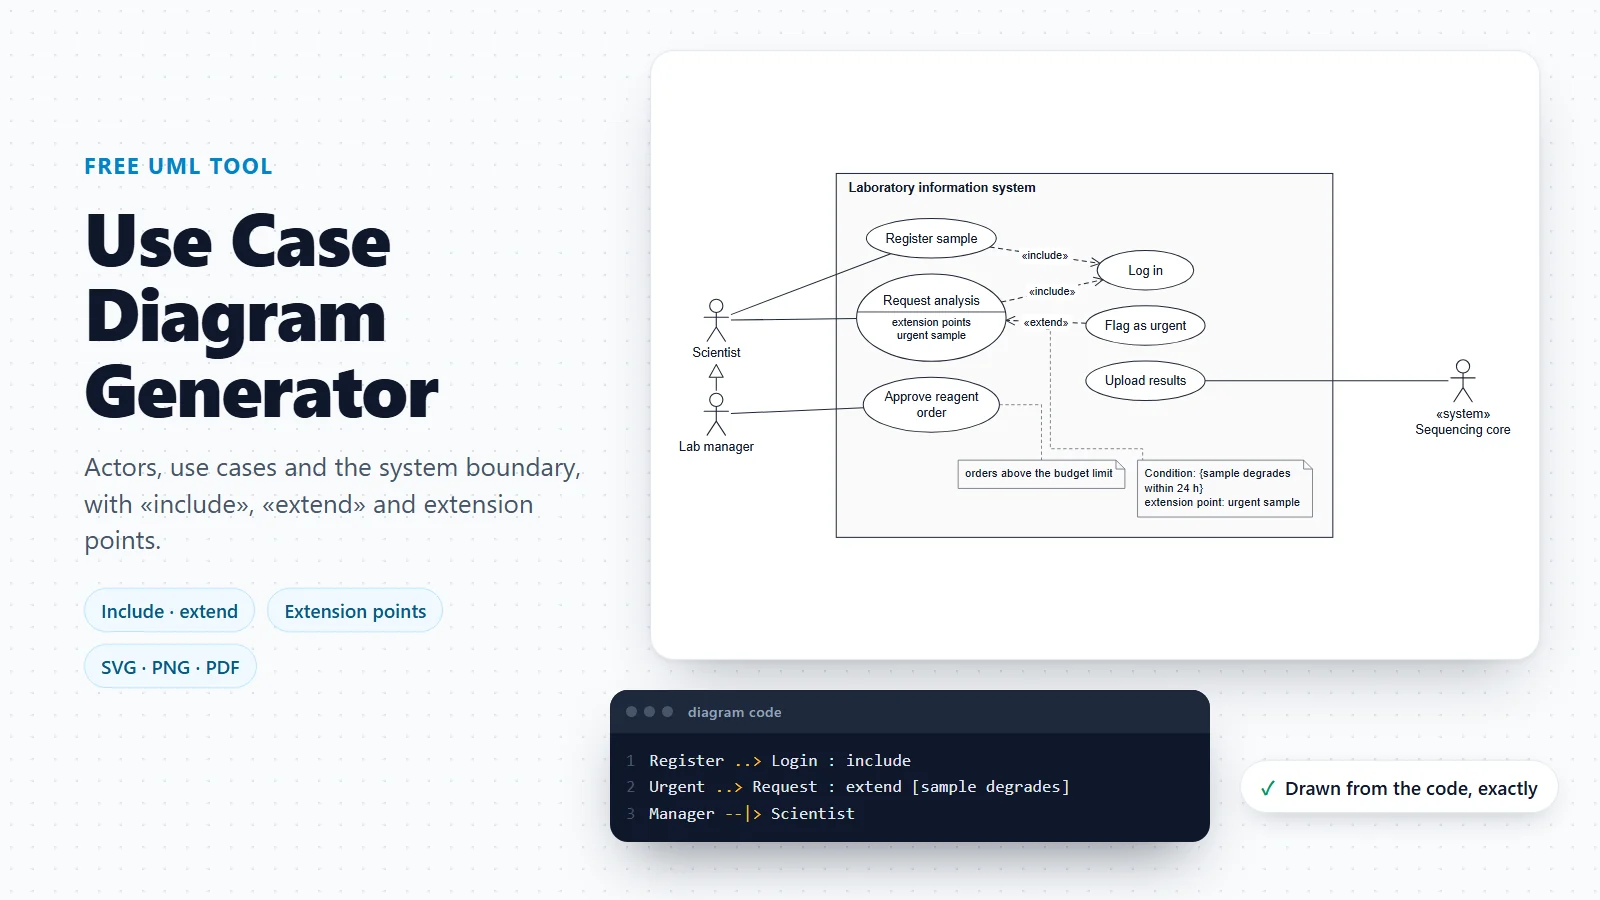
Use Case Diagram Generator
The roles that use a system and the goals they reach with it.
Need a branching diagram that is not about people?
Probability trees, decision trees and other outlines that branch level by level are drawn with the tree diagram maker.
Open the tree diagram makerLast checked: November 17, 2026. Sources: Library of Congress, New York and Erie Railroad diagram representing a plan of organization (D. C. McCallum, G. H. Henshaw, 1855); OpenStax, Principles of Management: organizational structure; Galbraith, Designing Matrix Organizations that Actually Work (Jossey-Bass, 2009); Okabe and Ito, Color Universal Design: how to make figures and presentations that are friendly to colorblind people; RFC 4180, Common Format and MIME Type for Comma-Separated Values (CSV) Files. The templates use invented names and are illustrative structures, not the staff of any real organisation.