Flow Cytometry Plot Generator for FACS Dot Plots, Quadrants and Histograms
Turn exported flow cytometry events into publication-ready FACS plots, with every gate percentage counted from your data.
Upload a CSV of events with one column per channel. SciFigure draws FSC vs SSC scatter plots, two-color quadrant plots and histogram overlays on linear, log or biexponential-style axes, applies the pre-gates and gates you describe, and prints the exact percentage in each gate for every sample.
Quadrant, region & marker gatesBiexponential (arcsinh) axesAnnexin V / PI ready
AI Flow Cytometry Plot Generator
Upload exported events and describe the plot and its gates.
Try sample data
Aspect ratio
329 / 2000 characters
Costs 5 credits. Gate percentages, medians and the event density are computed from your uploaded events, then drawn as a PNG.
Preview
Flow Cytometry Plot Examples
Aspect ratio: 16:9
These previews were drawn from the sample event files. Load a sample or upload your own events to generate a FACS plot.
Flow cytometry plot examples
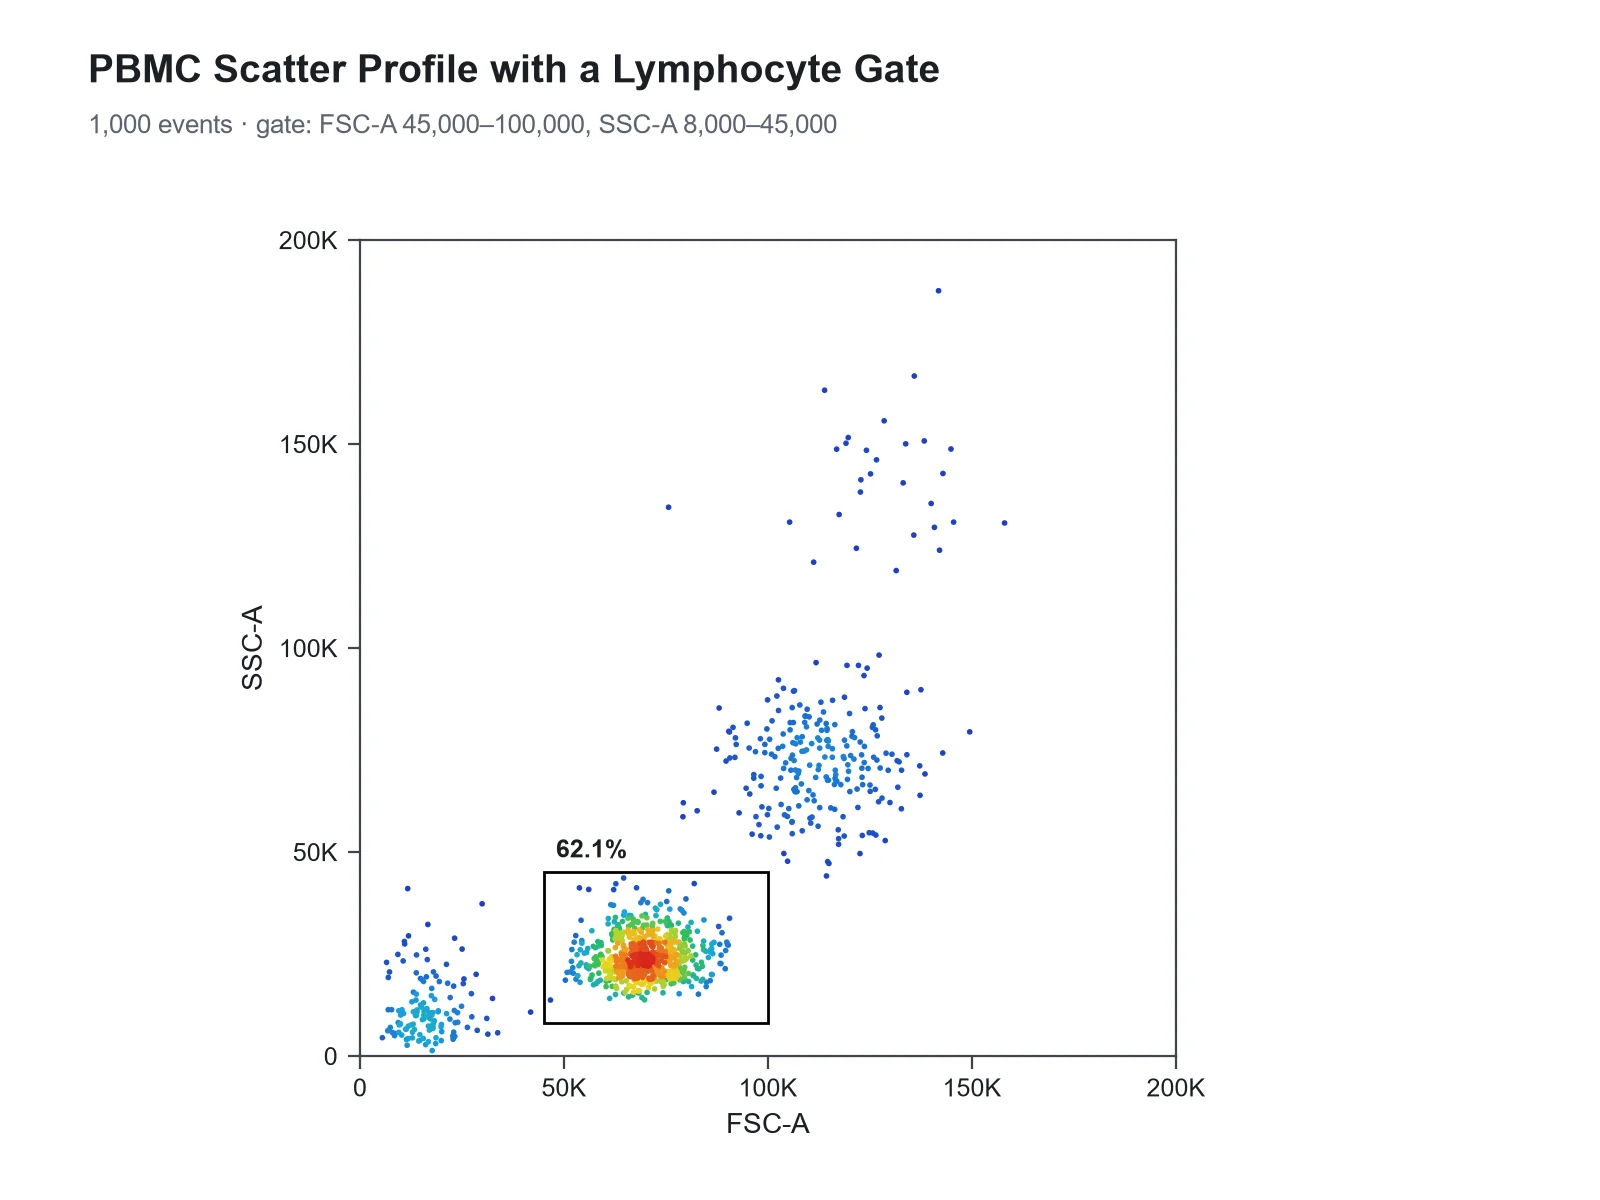
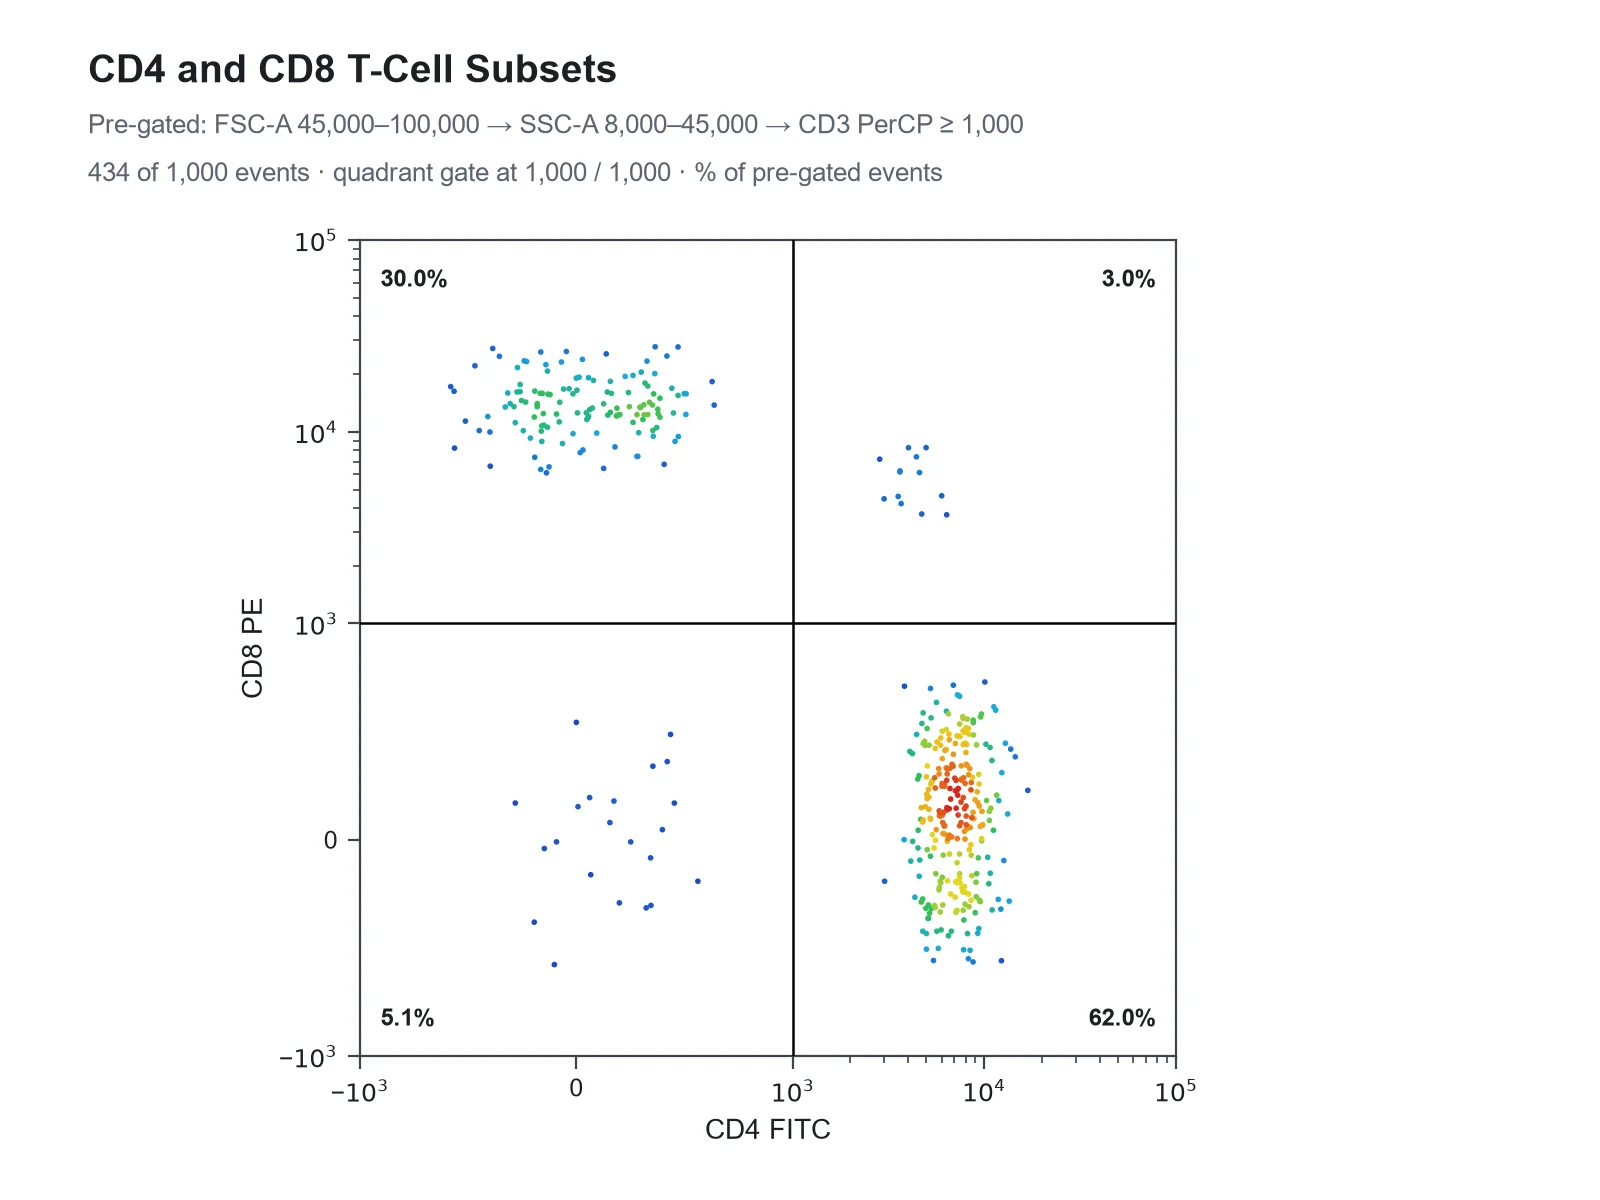
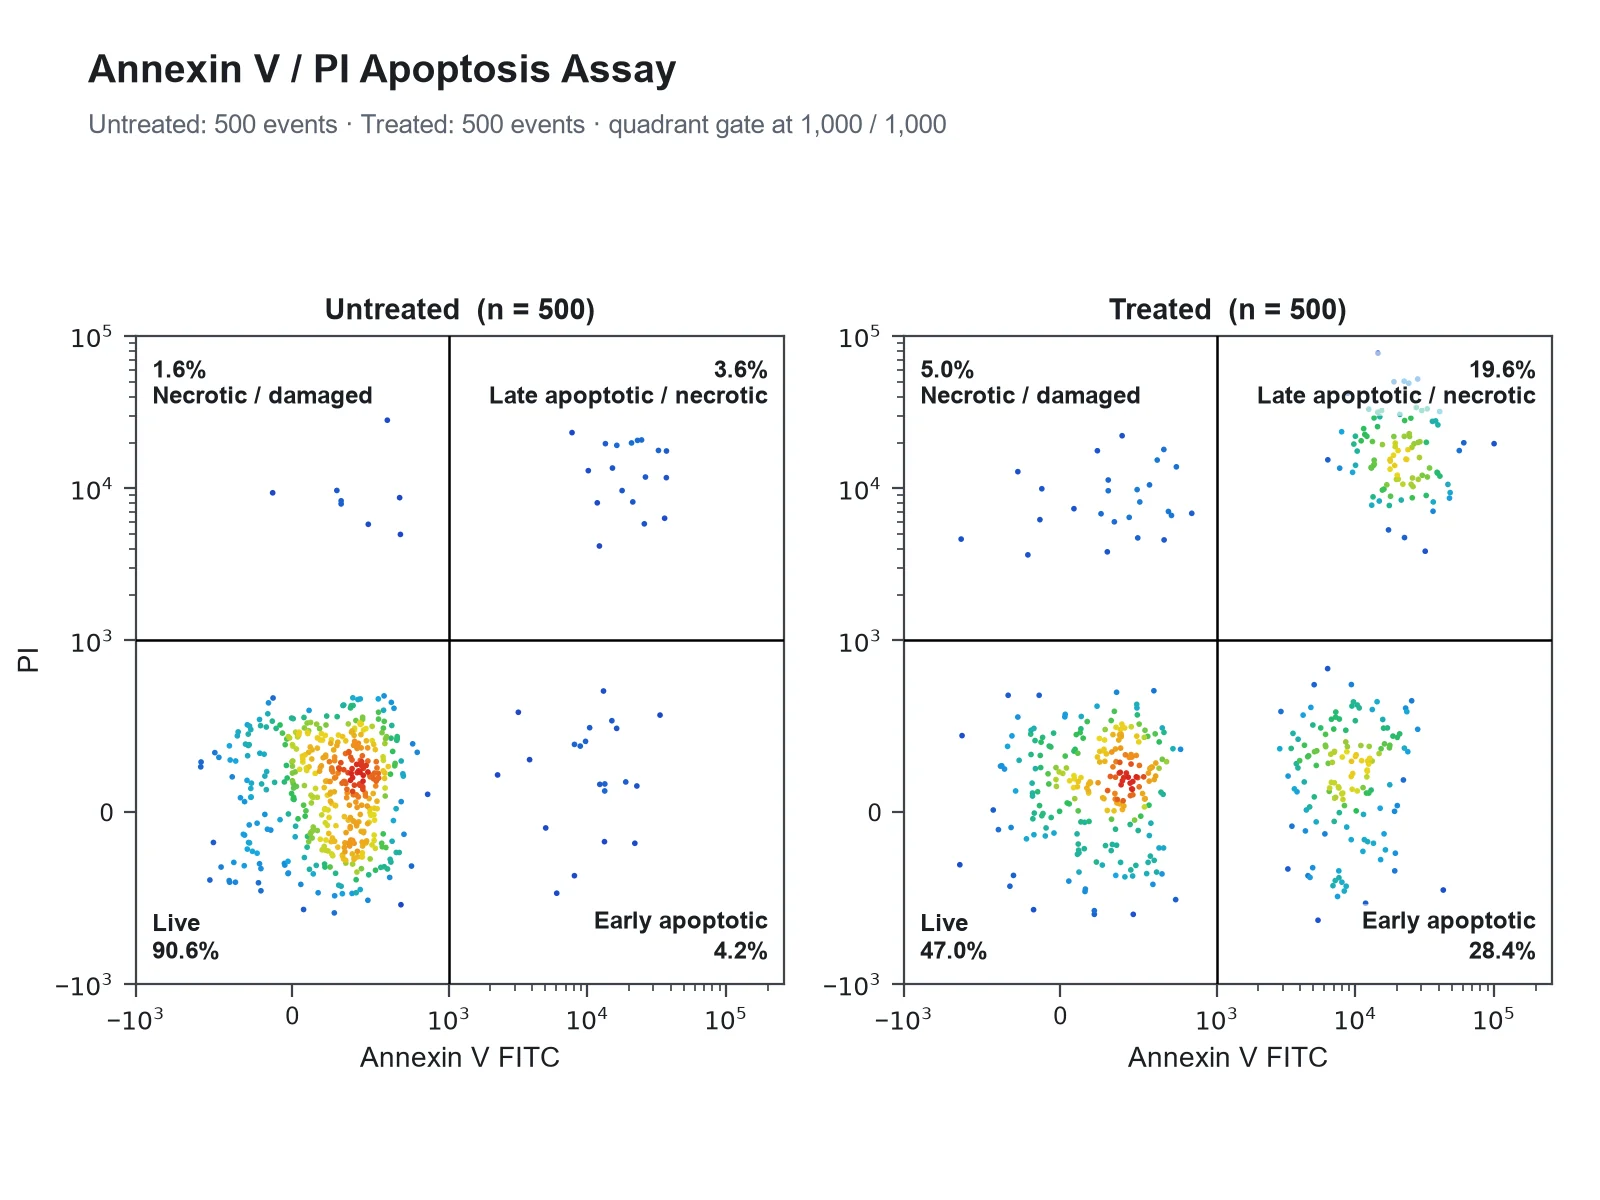
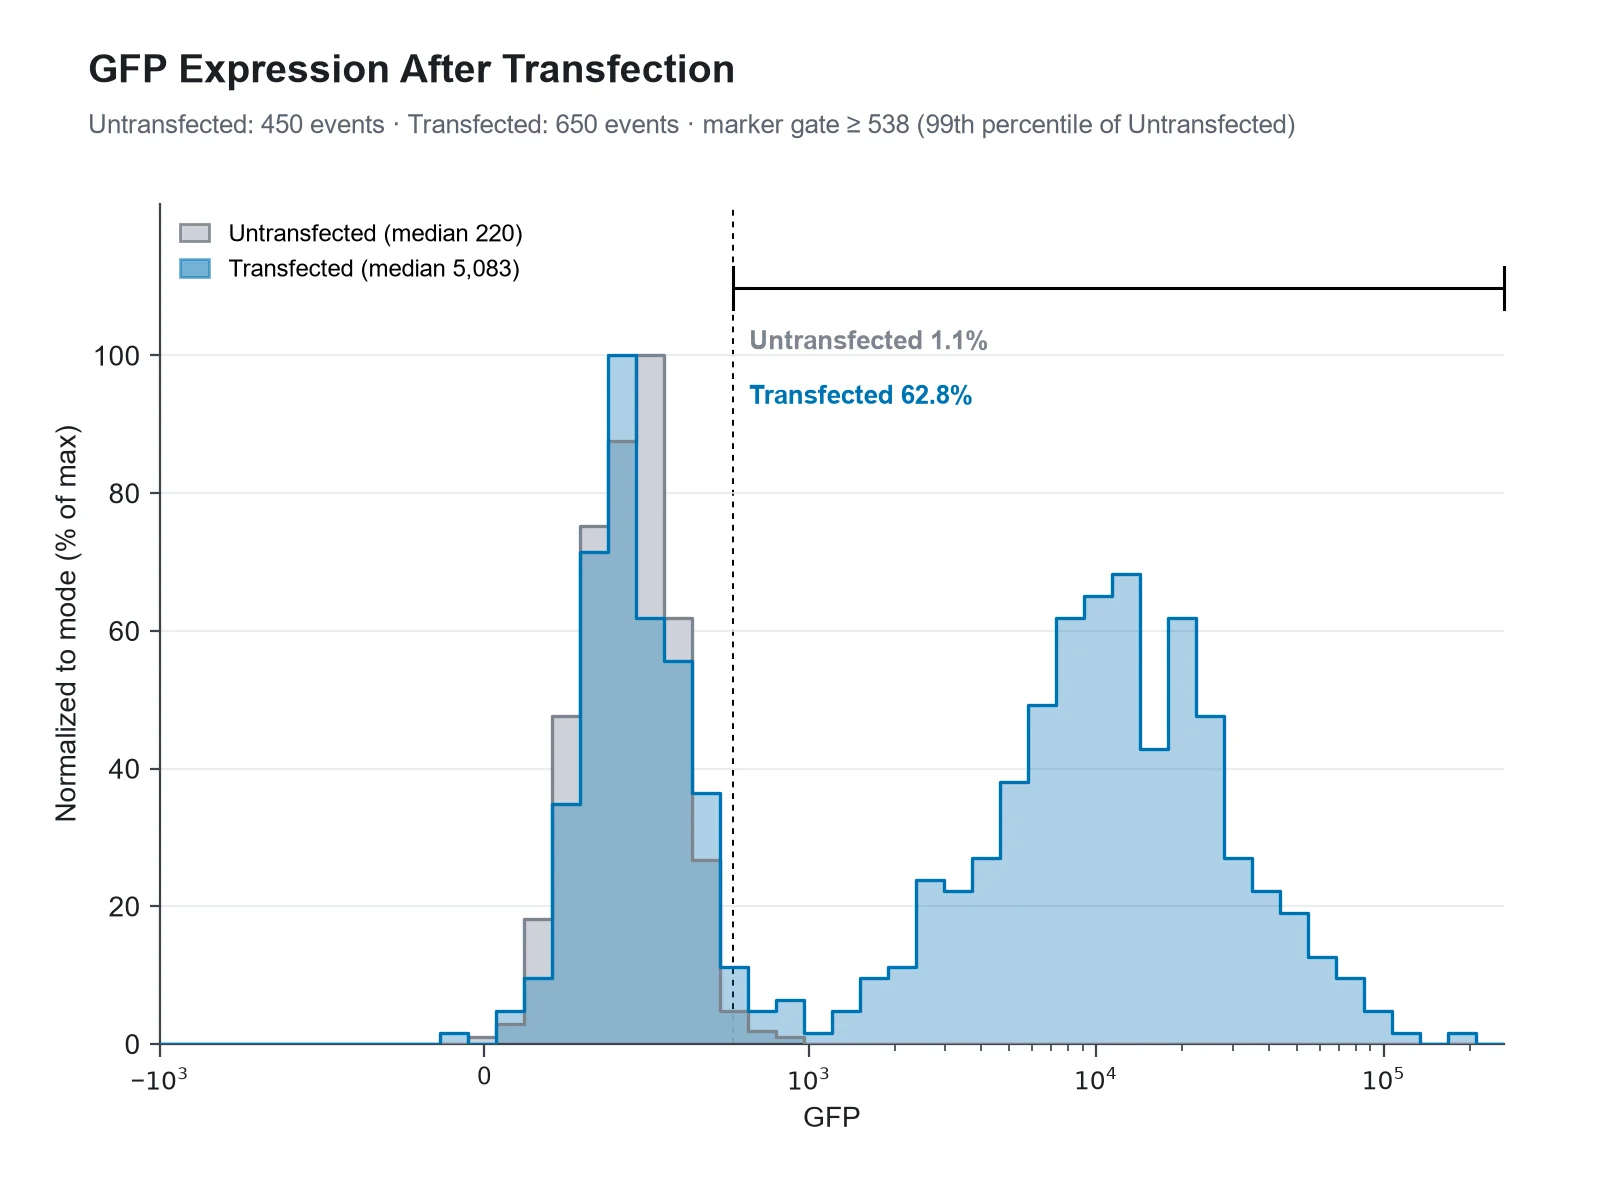
Each example was drawn from one of the sample event files: an Annexin V / PI apoptosis assay, PBMCs stained for CD3, CD4 and CD8, and a GFP transfection. The percentage in every gate is the count the generator makes from those events.
Prompt
Based on the uploaded annexin_v_pi_events.csv file, create two pseudocolor plots side by side, Untreated and Treated, with Annexin V FITC on the x-axis and PI on the y-axis on biexponential axes, a quadrant gate at 1,000 and 1,000, the percentage in each quadrant, and the quadrant names Live, Early apoptotic, Late apoptotic / necrotic and Necrotic / damaged.
Annexin V / PI Apoptosis Quadrant Plot
Prompt
Based on the uploaded pbmc_cd3_cd4_cd8_events.csv file, create an FSC-A vs SSC-A pseudocolor density plot on linear axes with a rectangle gate around the lymphocytes from FSC-A 45,000 to 100,000 and SSC-A 8,000 to 45,000, labeled with the percentage of events inside it.
FSC-A vs SSC-A Density Plot with a Lymphocyte Gate
Prompt
Based on the uploaded pbmc_cd3_cd4_cd8_events.csv file, create a CD4 FITC vs CD8 PE pseudocolor plot on biexponential axes. Pre-gate on lymphocytes and T cells: FSC-A 45,000 to 100,000, SSC-A 8,000 to 45,000 and CD3 PerCP above 1,000. Add a quadrant gate at 1,000 and 1,000 and print the percentage of CD3+ lymphocytes in each quadrant.
CD4 vs CD8 Quadrant Plot of CD3+ T Cells
Prompt
Based on the uploaded gfp_transfection_events.csv file, create a histogram overlay of GFP for the Untransfected and Transfected samples on a biexponential x-axis, normalized to mode, with a marker gate set from the Untransfected control and the % GFP-positive cells printed for each sample.
GFP Transfection Histogram Overlay
Prompt
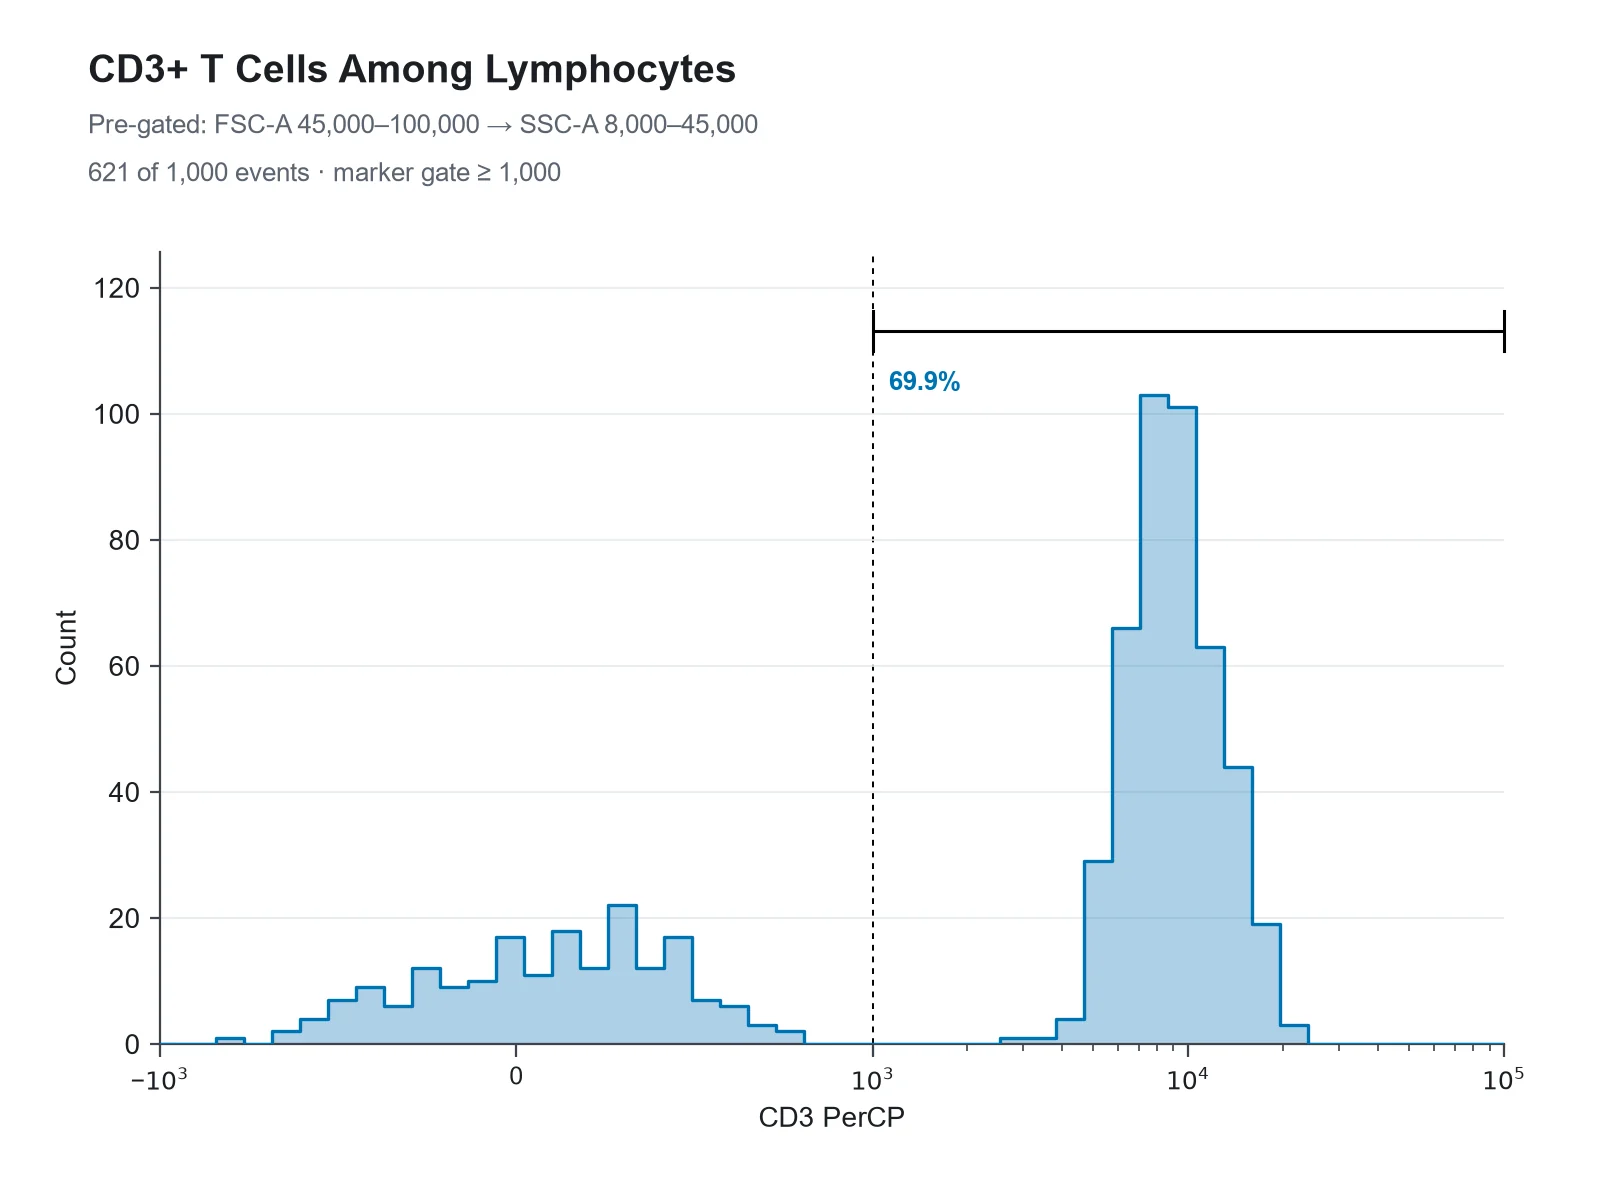
Based on the uploaded pbmc_cd3_cd4_cd8_events.csv file, create a histogram of CD3 PerCP on a biexponential x-axis for events pre-gated on lymphocytes (FSC-A 45,000 to 100,000 and SSC-A 8,000 to 45,000). Show event counts on the y-axis and add a marker gate above 1,000 labeled with the percentage of CD3+ lymphocytes.
CD3 Histogram with a Marker Gate
Prompt
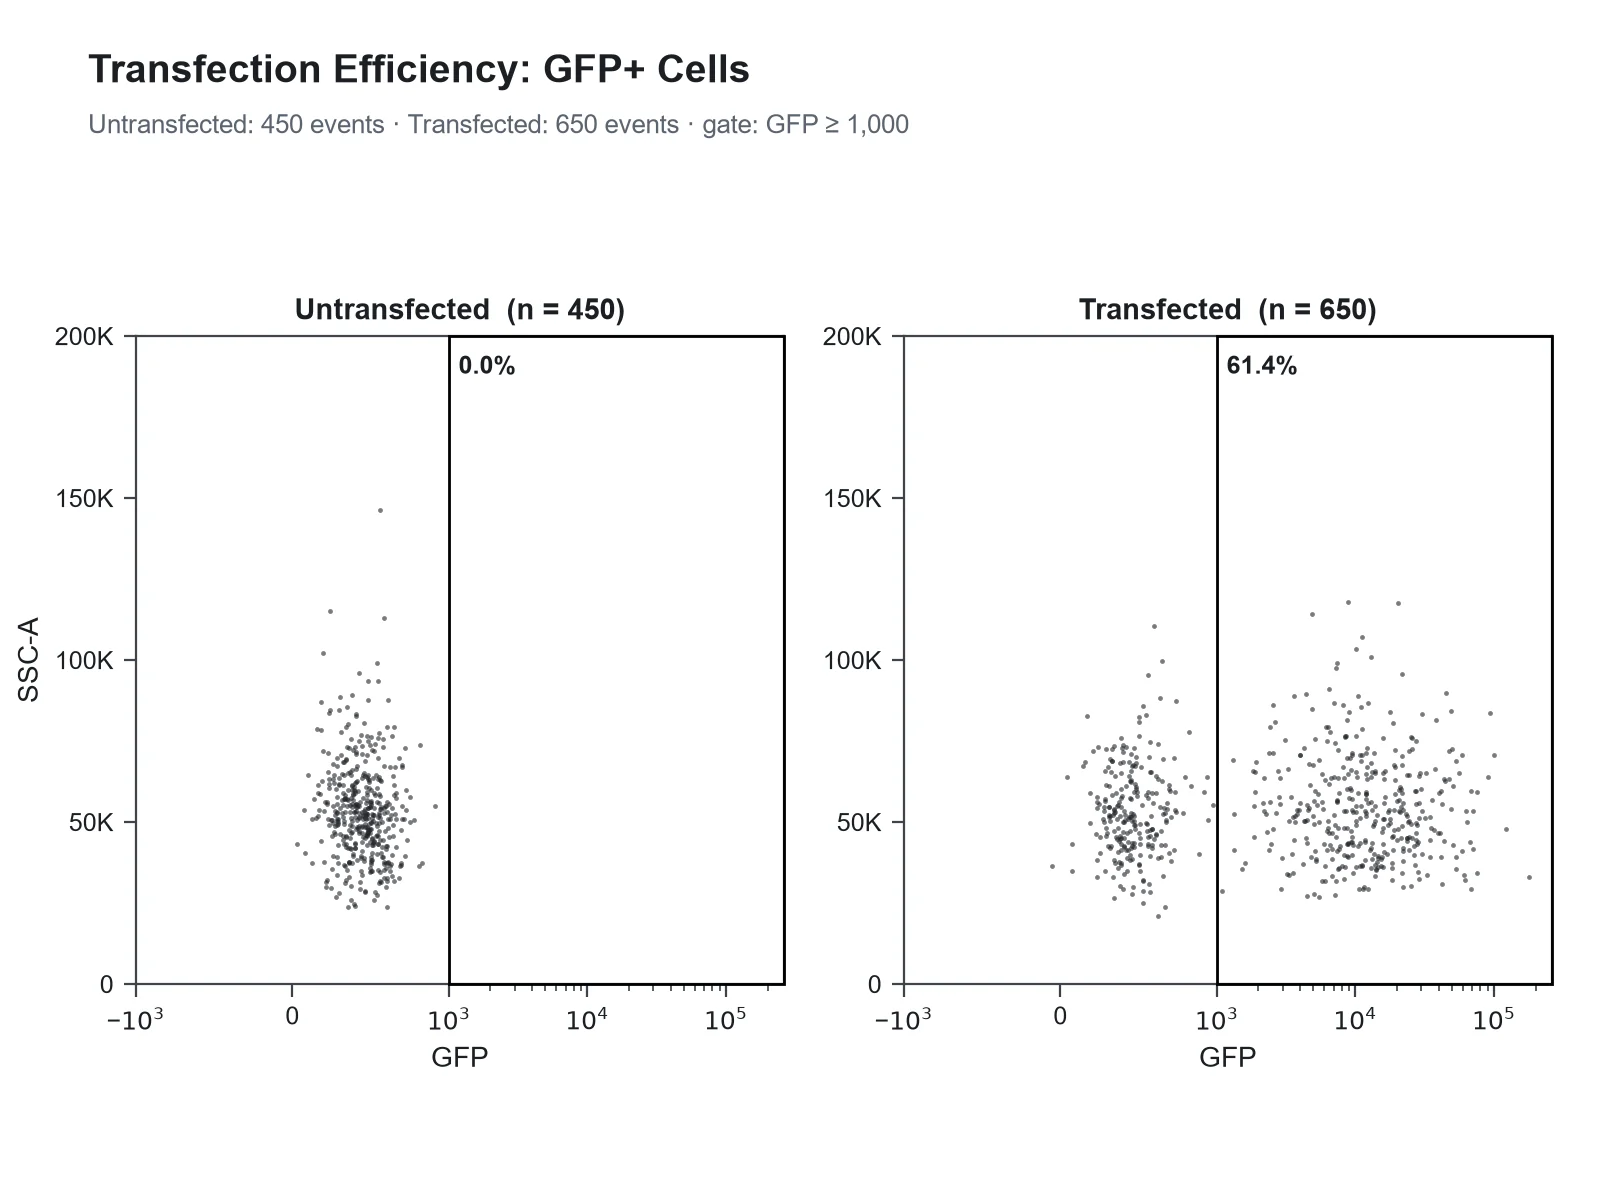
Based on the uploaded gfp_transfection_events.csv file, create GFP vs SSC-A dot plots for the Untransfected and Transfected samples side by side, GFP on a biexponential x-axis and SSC-A on a linear y-axis, with a rectangle gate for GFP above 1,000 labeled with the percentage of GFP-positive cells.
GFP vs SSC-A Dot Plots with a Region Gate
How to make a flow cytometry plot
1
Export your events
From FlowJo, FCS Express, FACSDiva or R (flowCore), export the events you want to show as CSV: one row per event, one column per channel with compensated values, plus a Sample column if you combine tubes. Up to 1,200 events are read, so export a random subsample.
2
Pick channels and describe the gates
Choose the X and Y channels, or a histogram channel. Then write the gates in plain words: "pre-gate FSC-A 45,000 to 100,000", "quadrant gate at 1,000 and 1,000", "marker gate above 2,000", or "set the gate from the Unstained control".
3
Generate, check & download
SciFigure counts the events in every gate for each sample, draws the plot with those percentages, and lets you download a PNG for papers, posters and slides.
Flow cytometry plot key facts
FSC (forward scatter)
Rises roughly with cell size
SSC (side scatter)
Rises with internal complexity and granularity
Quadrant names in FlowJo
Q1 upper left, Q2 upper right (double positive), Q3 lower right, Q4 lower left (double negative)
Annexin V / PI
Live −/−, early apoptotic +/−, late apoptotic or necrotic +/+
Gate percentage
Share of the parent gate unless stated as % of total
Biexponential axis here
arcsinh(value / 150): linear near zero, logarithmic above about 10^3
Events read per upload
Up to 1,200 rows (one row per event)
What is a flow cytometry plot?
A flow cytometer measures cells one at a time as they pass a laser in a narrow stream. For every cell, or event, it records forward scatter (FSC), side scatter (SSC) and the fluorescence collected in each detector. A flow cytometry plot shows those single-cell measurements. A two-parameter dot plot puts each event at its values on two channels; a density or pseudocolor plot colors the same dots by how crowded they are; a contour plot draws lines of equal event density; and a single-parameter histogram counts events in bins of one channel. Strictly, FACS means fluorescence-activated cell sorting, but researchers often call any flow cytometry graph a FACS plot, so a FACS plot, a flow cytometry chart and a flow cytometry graph usually mean these same figures.
Fluidics: sheath fluid squeezes the sample stream so cells pass the laser in single file, one event at a time.
Optics: light scattered at small forward angles is collected in line with the laser as forward scatter; light scattered sideways is collected at about 90° together with the fluorescence, then split by dichroic mirrors and band-pass filters so each detector sees one color range.
Electronics: each cell gives a voltage pulse in every detector, stored as its area (-A), height (-H) and width (-W). FSC-A, SSC-A and CD4 FITC-A in an exported file are these pulse areas.
A flow cytometry diagram of the instrument shows these three parts; the plots on this page show what they record, one row per event.
How to read a flow cytometry scatter plot (FSC vs SSC)
Forward scatter rises with cell size, though only roughly: it also depends on how the cell refracts light. Side scatter rises with internal complexity, such as granules and a lobed nucleus.
In blood, lymphocytes form a tight cluster at low FSC and low SSC, monocytes sit higher on both, and granulocytes have the highest side scatter. Debris and dead cells collect at the low-FSC edge.
Scatter channels are normally shown on linear axes running up to the instrument’s maximum, 262,144 on instruments that record 18-bit values.
A gate drawn on this plot, often called the lymphocyte gate, selects the parent population for every later plot. Doublets are removed on a separate FSC-A vs FSC-H plot, where single cells fall on the diagonal.
The percentage in an FSC vs SSC gate is a share of all events, debris included, so it is a quality check rather than a biological result.
Dot plot, density plot, contour plot or histogram?
Dot plot: every event is a dot of the same color. It shows rare events honestly but hides density once dots overlap, so the core of a large population looks no denser than its edge.
Pseudocolor (density) plot: the same dots colored from blue where events are sparse to red where they are densest. This is the usual choice for figures with thousands of events.
Contour plot: lines of equal density, often with outlying events drawn as dots. Clean in print, but the contour levels hide how many events sit in a small population.
Histogram: one channel only, with events counted per bin. Best for a single marker, for comparing stained and control samples, and for reporting the percentage of positive cells.
Gating strategy basics
A gating strategy is the ordered list of gates that leads from all events to the population you report, for example: cells on FSC vs SSC, then single cells on FSC-A vs FSC-H, then live cells on a viability dye, then CD3+ T cells, then CD4 vs CD8.
Each gate’s percentage is normally a share of its parent gate, so "62% CD4+" means 62% of CD3+ lymphocytes, not of all events.
Place positivity gates with controls, not by eye: fluorescence-minus-one (FMO) controls show where the negative population ends when every other color is present.
Apply the same gates to every sample you compare, and show the full hierarchy, usually as a supplementary figure.
In this generator a pre-gate is a range on any channel ("pre-gate FSC-A 45,000 to 100,000, SSC-A 8,000 to 45,000 and CD3 PerCP above 1,000"). Pre-gates run in order, and the event count after each one is passed to the figure, so the gating path is documented.
Quadrant plots, with Annexin V / PI as a worked example
A quadrant gate splits a two-color plot with one vertical and one horizontal line into four populations: negative for both markers, positive for one, or positive for both. FlowJo labels them from the top left clockwise, so Q2 is always double positive and Q4 double negative. The Annexin V / PI assay is the classic case. Annexin V binds phosphatidylserine, which apoptotic cells expose on the outside of their membrane, and propidium iodide (PI) only enters cells whose membrane is no longer intact. So the lower-left quadrant (Annexin V− PI−) holds live cells, the lower right (Annexin V+ PI−) early apoptotic cells, the upper right (Annexin V+ PI+) late apoptotic or necrotic cells, and the upper left (Annexin V− PI+) mostly necrotic cells or damaged nuclei. In the sample file, with the gate at 1,000 on both channels, the untreated cells are 90.6% live, 4.2% early apoptotic, 3.6% late apoptotic or necrotic and 1.6% in the upper left; the treated cells are 47.0%, 28.4%, 19.6% and 5.0%. Total apoptosis, early plus late, rises from 7.8% to 48.0%.
A single-parameter histogram shows how one marker is distributed. Overlaying a stained sample on its unstained, FMO or isotype control shows how far the signal moves.
When samples have different numbers of events, scale each histogram to its own tallest bin (normalized to mode, often labeled % of max) so the shapes can be compared.
A marker (interval) gate counts the share of events above a threshold: the percentage of positive cells. A common convention places it where about 1% of the negative control is positive, its 99th percentile, which is what this generator does when you name a control and give no value.
Report the median fluorescence intensity (MFI) for brightness. Fluorescence is roughly log-normal, so the median describes a population better than the arithmetic mean.
Worked example from the GFP sample: the marker gate at the untransfected control’s 99th percentile (538) holds 1.1% of untransfected and 62.8% of transfected cells; the median GFP signal rises from 220 to 5,083.
For more than four samples, stack the histograms as a ridgeline plot instead of overlaying them.
Fluorescence spans several orders of magnitude, so it is shown on a log-like axis; scatter is usually linear.
After compensation many events have values at or below zero. A log axis cannot place them, so they pile up on the axis and can look like a separate population.
Biexponential displays such as Logicle (Parks, Roederer and Moore, 2006) are linear around zero and logarithmic above it, so negative and low events form a normal-looking population.
This generator draws its biexponential-style axis as arcsinh(value / 150), which behaves the same way but is not the Logicle algorithm, so tick spacing differs slightly from FlowJo’s. Write "cofactor 500" to widen the linear region, or "log x-axis" or "linear y-axis" to change an axis.
Scaling changes only the picture: gates are applied to the raw values, so the percentages are the same on every scale.
Compensation: the caveat behind every quadrant
Each fluorochrome emits light into neighboring detectors as well as its own. Compensation subtracts that spillover using single-stained controls, and it leaves compensated values that can be negative and populations that spread out at high intensity. Without proper compensation, a single-positive population leans diagonally into the double-positive quadrant and the percentages are wrong. This generator does not compensate: upload compensated (or spectrally unmixed) values exported from your analysis software, and check single-stained controls before trusting a quadrant.
What does this flow cytometry plot generator calculate?
It reads one row per event and one numeric column per channel, with an optional sample column for up to four panels or overlays. It picks linear axes for scatter channels and biexponential-style axes for fluorescence unless you ask otherwise, applies your pre-gates in order, and counts the events in each quadrant (events exactly on a line count as positive), in a rectangular region gate, or inside a histogram marker gate, as a share of the pre-gated parent or, if you ask, of all events. Without a gate value it uses a control sample (named Unstained, Isotype, FMO, Untransfected and so on, or the one you name) at its 99th percentile. It computes medians, histogram bins, and a density map of where events fall, and passes all of these to the figure. It does not compensate, draw polygon or elliptical gates, or cluster cells (t-SNE, UMAP).
How many events, and how precise are the percentages?
Each upload reads up to 1,200 rows. Every percentage is exact for the events you upload.
As an estimate for the whole sample, a percentage from n random events has a 95% margin of about ±1.96 × √(p(1 − p) / n): ±3.1 points for a 50% population and ±1.4 points for a 5% population at 1,000 events.
Export a random subsample of the parent population rather than the first rows of a file: acquisition order can drift with clogs or temperature.
For rare populations below about 1%, take the percentage from the full file in your analysis software and quote it in the legend.
Flow cytometry figure tips for journals
Label axes with the marker and fluorochrome (CD4 FITC), not the detector (FL1-H), and say which scale is used.
Print gate percentages and state their parent in the legend ("% of CD3+ lymphocytes").
Use the same gates and axis ranges on every sample you compare, and put the full gating strategy in a supplementary figure.
Report the controls used to set gates (FMO, unstained, isotype), the number of events, and the instrument and software. MIFlowCyt, the minimum information standard for flow cytometry experiments, lists what to report.
Plot summary statistics across replicates (% positive or MFI) as a dot or box plot rather than showing a single representative plot alone.
Three ways to show the same events. Pick by the number of parameters and what the reader needs to count.
Dot plot
Pseudocolor / density plot
Histogram
Parameters
Two
Two
One
Each event shown as
A dot
A dot colored by local density
A count in a bin
Best for
Small files and rare events
Large files and overlapping populations
One marker, overlays, % positive
Typical gates
Quadrant, region
Quadrant, region
Marker (interval)
Watch out for
Overplotting hides density
Colors are relative within each plot
Loses the second parameter
Common flow cytometry plot mistakes
These are the problems reviewers most often catch in FACS figures.
MistakeCorrect
MistakeShowing compensated fluorescence on a log axis, so events at or below zero pile up on the axis like a separate population.
CorrectUse a biexponential (Logicle-type) axis for compensated data, or say in the legend that those events sit on the axis.
MistakePlacing quadrant lines by eye on the stained sample.
CorrectSet gates from FMO or unstained controls and apply the same gates to every sample you compare.
MistakePrinting a percentage without saying what it is a percentage of.
CorrectName the parent ("% of CD3+ lymphocytes") and show the gating path.
MistakeLabeling axes with detector names such as FL1-H or PE-A.
CorrectLabel each axis with the marker and fluorochrome, for example CD4 FITC.
MistakeOverlaying histograms of samples with different event numbers on a count axis.
CorrectNormalize each histogram to its mode (% of max) and report % positive and median from the counts.
MistakeCalling every Annexin V+ PI+ cell late apoptotic.
CorrectDouble-positive cells can be late apoptotic or primarily necrotic; a time course or a second assay separates them.
MistakeUploading the first rows of a large file as if they were a fair sample.
CorrectExport a random subsample of the parent population so the percentages stay representative.
Flow Cytometry Plot Generator FAQ
What is a flow cytometry plot?
A flow cytometry plot shows single-cell measurements from a flow cytometer: a two-parameter dot, density or contour plot of two channels (for example FSC vs SSC or CD4 vs CD8), or a single-parameter histogram of one channel. Each point or count is one event, usually one cell.
What is a FACS plot?
FACS stands for fluorescence-activated cell sorting, but "FACS plot" is commonly used for any flow cytometry plot, sorted or not. The figures are the same: dot plots, density plots, quadrant plots and histograms.
How do I read a flow cytometry scatter plot?
On an FSC vs SSC plot, forward scatter (x) rises roughly with cell size and side scatter (y) with internal complexity. In blood, lymphocytes sit low on both, monocytes higher, granulocytes highest on SSC, and debris at the low-FSC edge.
What is the difference between a flow cytometry dot plot and a density plot?
Both show every event at its two channel values. A dot plot draws all events in one color; a density (pseudocolor) plot colors each dot by how many events are near it, so the dense core of a population stands out.
How are quadrants numbered on a flow cytometry plot?
FlowJo numbers quadrant gates from the top left clockwise: Q1 upper left, Q2 upper right (double positive), Q3 lower right and Q4 lower left (double negative). This generator names each quadrant by position and marker state as well, for example "Q2, CD4+ CD8+".
How do I interpret Annexin V / PI quadrants?
With Annexin V on x and PI on y: lower left (−/−) live, lower right (Annexin V+ PI−) early apoptotic, upper right (+/+) late apoptotic or necrotic, upper left (Annexin V− PI+) mostly necrotic cells or damaged nuclei. Early plus late apoptotic is often reported as total apoptosis.
What file do I upload?
A CSV, TSV or Excel file with one row per event and one numeric column per channel, with compensated values, plus an optional text column naming the sample. FCS files are not read directly: export the population to CSV first.
How do I export events from an FCS file?
In FlowJo, FCS Express or FACSDiva, export the gated population as CSV with compensated values. In R with flowCore, write the expression matrix of a flowFrame, exprs(frame), to CSV. Take a random subsample of up to 1,200 events.
How many events can I upload?
Up to 1,200 rows per upload. Percentages are exact for those events; as an estimate for the whole sample they carry a sampling margin of about ±3 points for a 50% population at 1,000 events.
How do I describe the gates?
Write them in your instructions: "pre-gate FSC-A 45,000 to 100,000 and CD3 PerCP above 1,000", "quadrant gate at 1,000 and 1,000", "rectangle gate x 45,000 to 100,000, y 8,000 to 45,000", or "marker gate above 2,000". Values are in the units of your file; 10^3, 1e3 and 50K also work.
Can the generator set gates from a control?
Yes. If your sample column contains a control such as Unstained, Isotype, FMO or Untransfected, or you write "set the gate from the Unstained control", and you give no gate value, the gate is placed at the control’s 99th percentile so that about 1% of control events count as positive.
Does the generator compensate my data?
No. Compensation needs single-stained controls and belongs in your analysis software. Upload compensated or spectrally unmixed values; uncompensated data give wrong quadrant percentages.
Does it support biexponential or Logicle axes?
It draws a biexponential-style axis with arcsinh(value / 150), which is linear near zero and logarithmic above, like Logicle, though tick spacing differs slightly. Log and linear axes are available too; the scale never changes the percentages.
Can I overlay histograms of several samples?
Yes. Map a histogram channel and a sample column; up to four samples are overlaid and normalized to mode, and a marker gate reports % positive for each sample.
Can I make a full gating strategy figure?
Each generation draws one plot type. Generate each step with the same pre-gates (FSC vs SSC, then CD3, then CD4 vs CD8) and arrange the panels; the counts after each pre-gate are reported so the steps match.
Can it draw polygon or elliptical gates?
No. It draws quadrant gates, rectangular region gates and histogram marker gates. For an irregular population, export only the gated events from your analysis software and plot those.