
Free ecology tool
Food web maker with automatic trophic levels
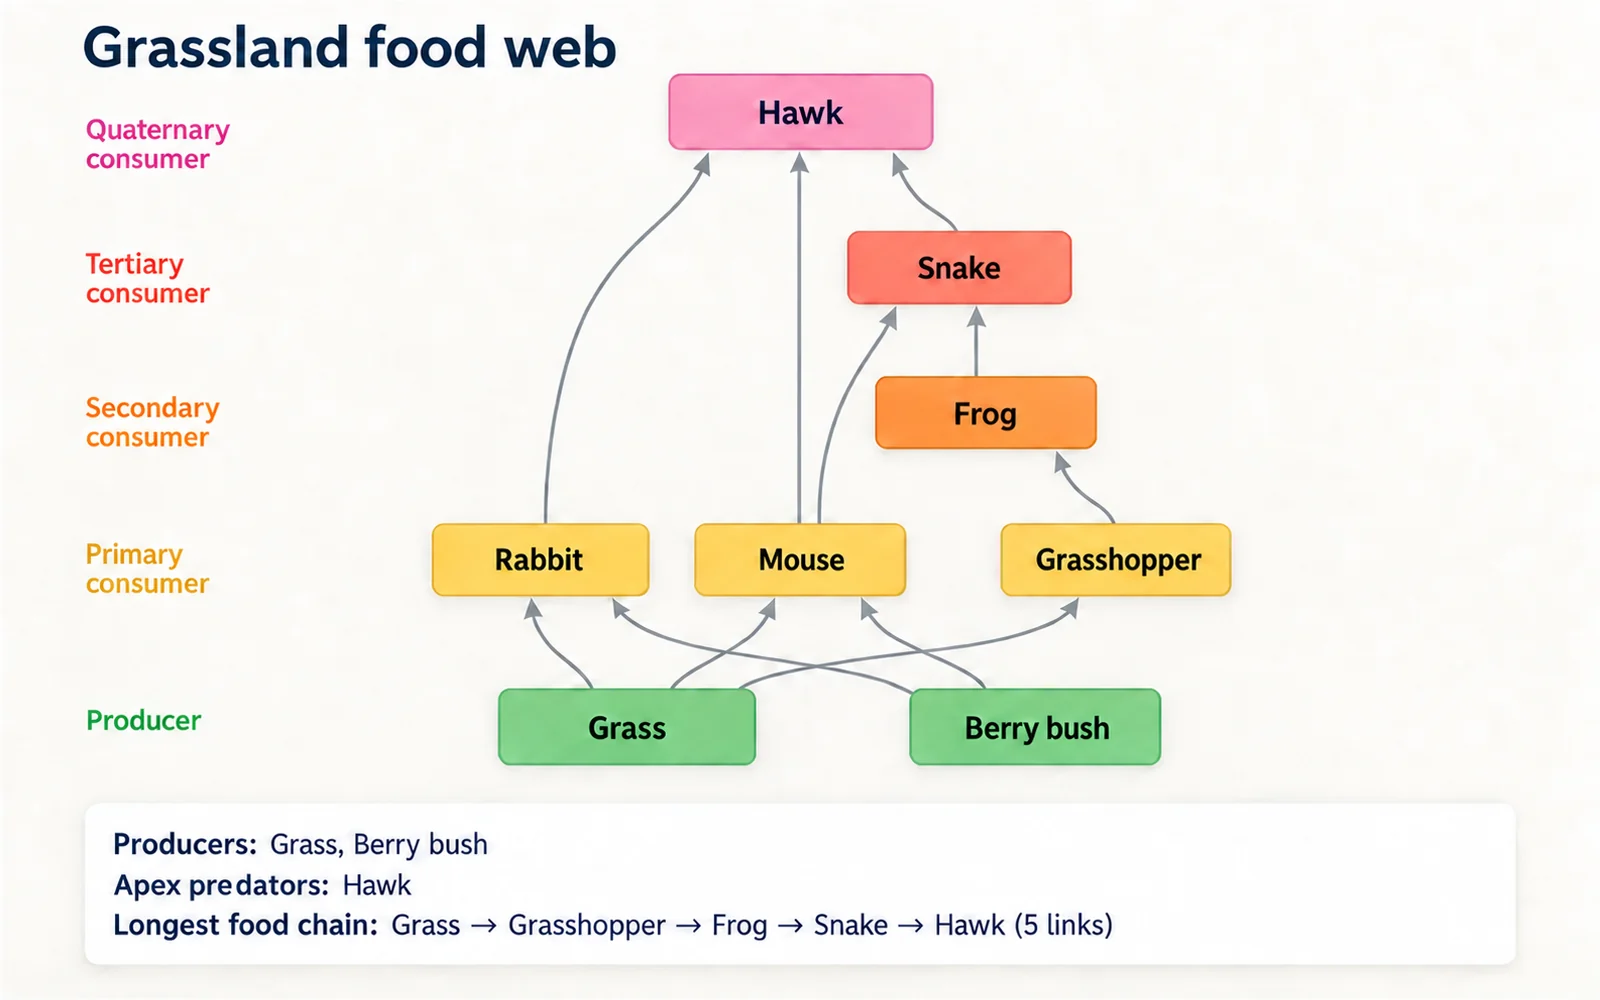
Add your organisms, click what eats what, and this food web maker works out the trophic level of every species, stacks them from producers upward, and draws the arrows in the direction energy actually flows. It also names the producers and apex predators and traces the longest food chain.
What the web shows
- Producers:
- Grass, Berry bush
- Apex predators:
- Hawk
- Longest food chain:
- Grass → Grasshopper → Frog → Snake → Hawk (5 links)
- Trophic levels:
- 5
How to make a food web
A food web joins several food chains into one picture of who eats whom in a habitat. Building one is a matter of listing the organisms and then drawing every feeding relationship you know of.
- Start with the producers: plants, algae, or phytoplankton that make their own food by photosynthesis. Everything else depends on them.
- Add the consumers, and for each one click every organism it eats. Most animals eat at more than one level, which is exactly what makes a web rather than a chain.
- Draw the arrow from the organism being eaten to the organism eating it. The arrow shows the direction energy flows, which is the opposite of the direction the predator moves.
- The tool places each organism one level above the highest thing it eats, so an omnivore sits above its highest-level prey rather than averaging.
- Check the result: producers should sit on the bottom row and the apex predator, eaten by nothing, on the top.
Which way do the arrows point?
This is the single most common mistake, and it costs marks every year. The arrow points from prey to predator, in the direction the energy travels.
- Grass → Rabbit → Fox. The grass is eaten by the rabbit, which is eaten by the fox.
- Read the arrow as "is eaten by" and it always makes sense. Read it as "eats" and every arrow in your web is backwards.
- The arrow also tracks biomass and stored chemical energy, which is why the convention exists: it is an energy-flow diagram before it is a feeding diagram.
- Arrows never point into a producer, because producers make their own food rather than eating anything.
Trophic levels and the ten per cent rule
Each step up a food web loses most of the energy that entered it. That loss is why food chains are short and why there are always fewer top predators than producers.
- Level 1, producers: capture light energy through photosynthesis.
- Level 2, primary consumers: herbivores that eat producers.
- Level 3, secondary consumers: carnivores and omnivores that eat primary consumers.
- Level 4 and above, tertiary and quaternary consumers, up to the apex predator that nothing eats.
- Roughly ten per cent of the energy at one level is passed to the next. The rest is lost to respiration, movement, heat, and the parts that are never eaten.
- That is why food chains rarely exceed four or five links: after four steps there is too little energy left to support another level.
- Decomposers feed on every level and return nutrients to the soil, which is why they are often drawn to the side rather than on a single level.
What a food web tells you that a chain cannot
A food chain is a single path. A web shows the alternatives, and the alternatives are what determine whether an ecosystem survives a shock.
- Redundancy. If a predator eats three prey species, losing one is survivable. A specialist with a single food source is not.
- Knock-on effects. Removing one species changes the populations of everything connected to it, in both directions: its prey increase and its predators decline.
- Keystone species. Some species hold a web together far out of proportion to their numbers, usually because many arrows pass through them.
- Bioaccumulation. Persistent toxins concentrate as they move up the levels, which is why apex predators carry the highest burden.
- The tool highlights circular feeding if you create it, because energy cannot flow in a loop and a cycle in the diagram means a relationship has been entered backwards.
Frequently asked questions
Is this food web maker free?
Yes. It runs entirely in your browser, needs no account, and exports PNG, SVG, and CSV without a watermark. Nothing you enter is uploaded to a server.
Which way should food web arrows point?
From the organism being eaten to the organism eating it, because the arrow shows the direction energy flows. Grass → Rabbit → Fox. Reading each arrow as "is eaten by" keeps you right.
What is the difference between a food chain and a food web?
A food chain is one path from producer to top predator. A food web combines many chains, showing that most organisms eat more than one thing and are eaten by more than one thing. Real ecosystems are webs; chains are a simplification of a single route through one.
How does the tool decide the trophic level?
Each organism sits one level above the highest-level thing it eats. A fox that eats both rabbits (level 2) and frogs (level 3) is placed at level 4 rather than averaged, which matches how trophic level is defined for the longest chain reaching that species.
Why are there fewer organisms at the top?
Because only about ten per cent of the energy at each level passes to the next. The rest is lost as heat, used for movement and respiration, or contained in parts that are never eaten. After four or five steps there is not enough energy left to support another level.
Where do decomposers go?
Decomposers such as fungi and bacteria feed on dead material from every level, so they do not belong on one. Add them as an organism that eats several others if you want them shown, or leave them out and mention them in the caption, which is what most textbook diagrams do.
Can I export the web for a report?
Yes. PNG for a document or slide, SVG if you want to edit the labels in Illustrator or Inkscape, and CSV which lists every organism with its trophic level, role, and prey for a table or an analysis script.
Related tools
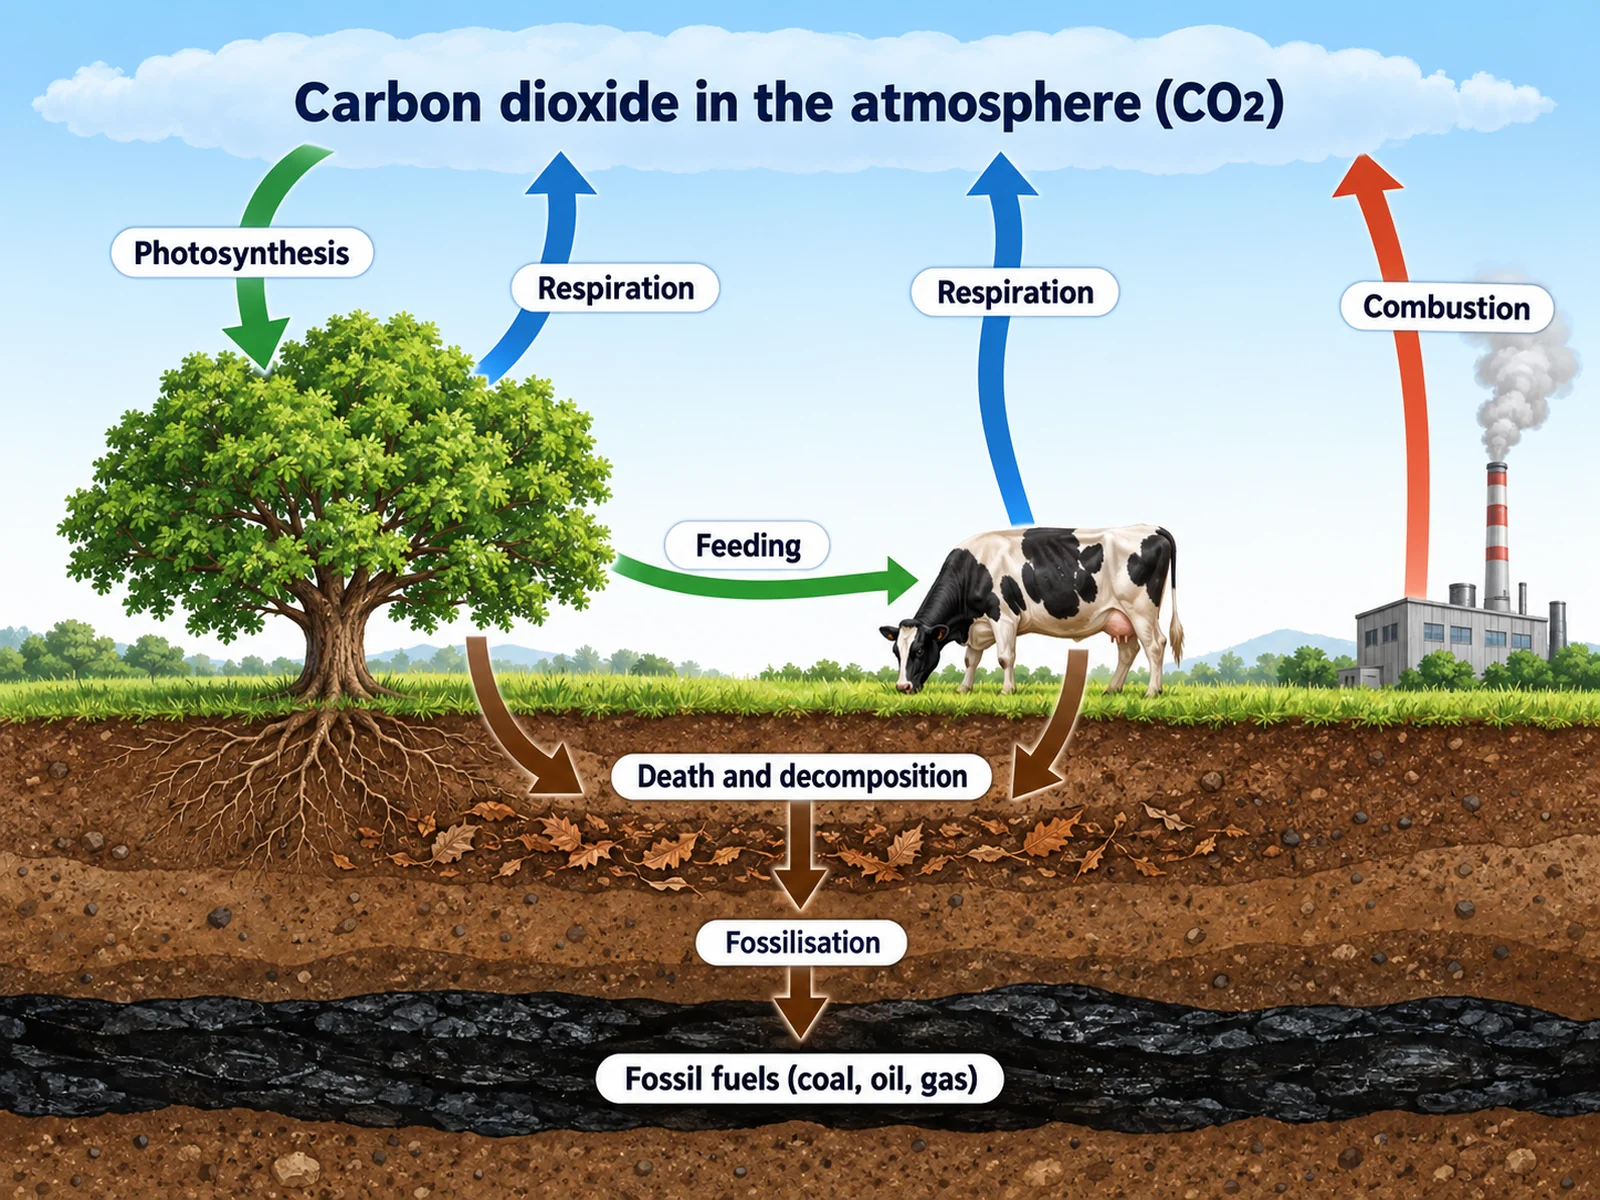
Carbon Cycle Diagram Generator
Draw photosynthesis, respiration, decomposition, and combustion in one cycle.
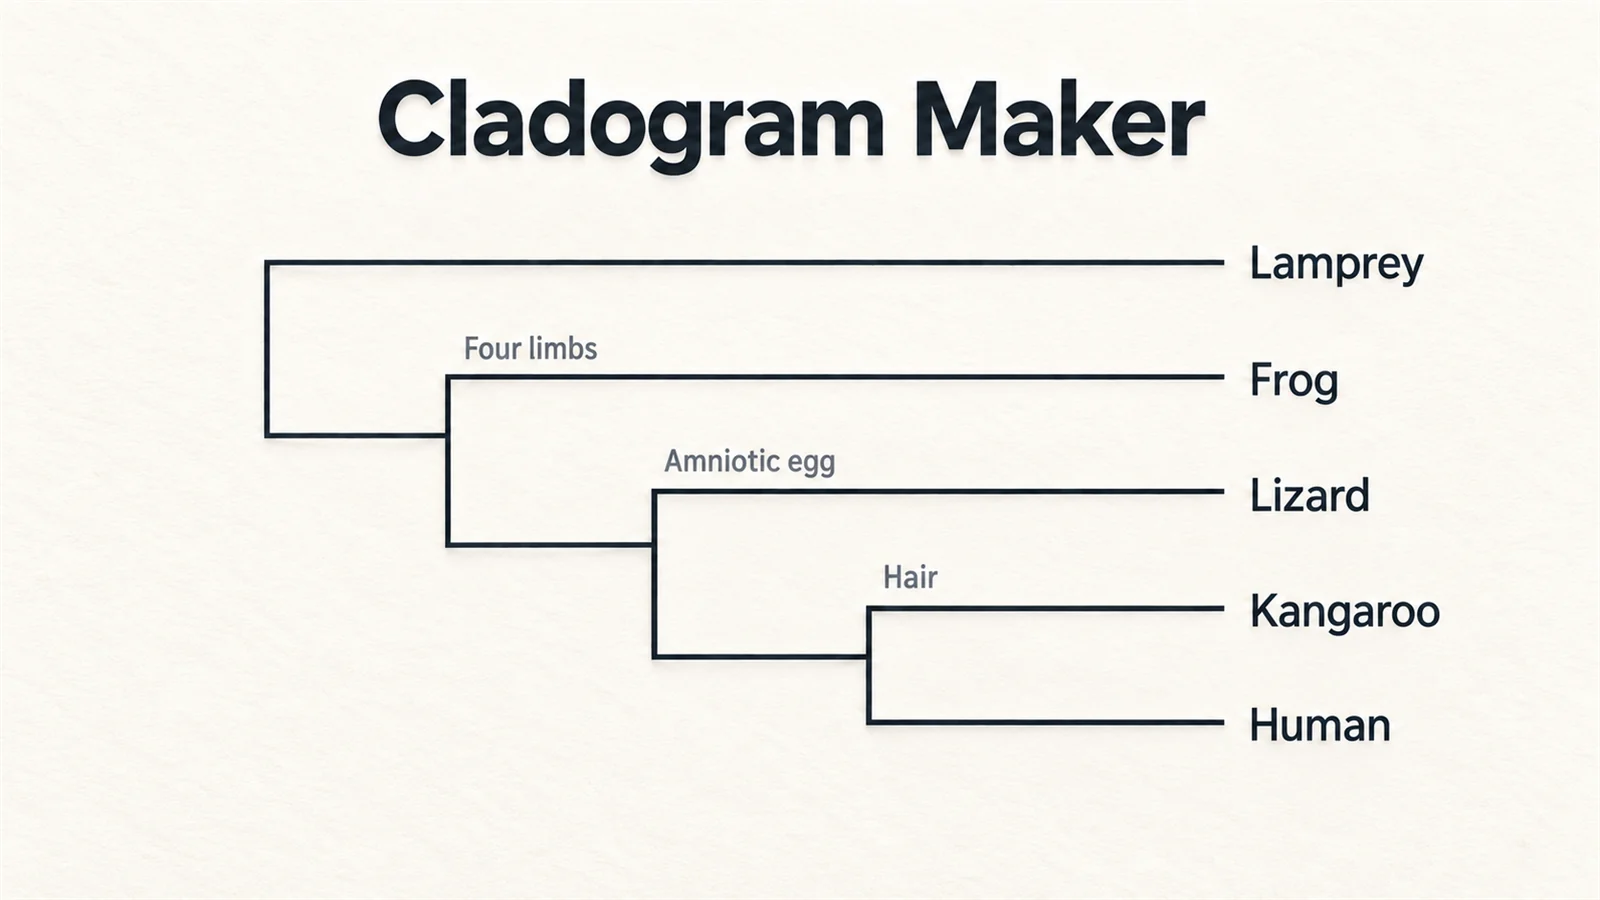
Cladogram Maker
Build a cladogram from a character matrix of taxa and traits.
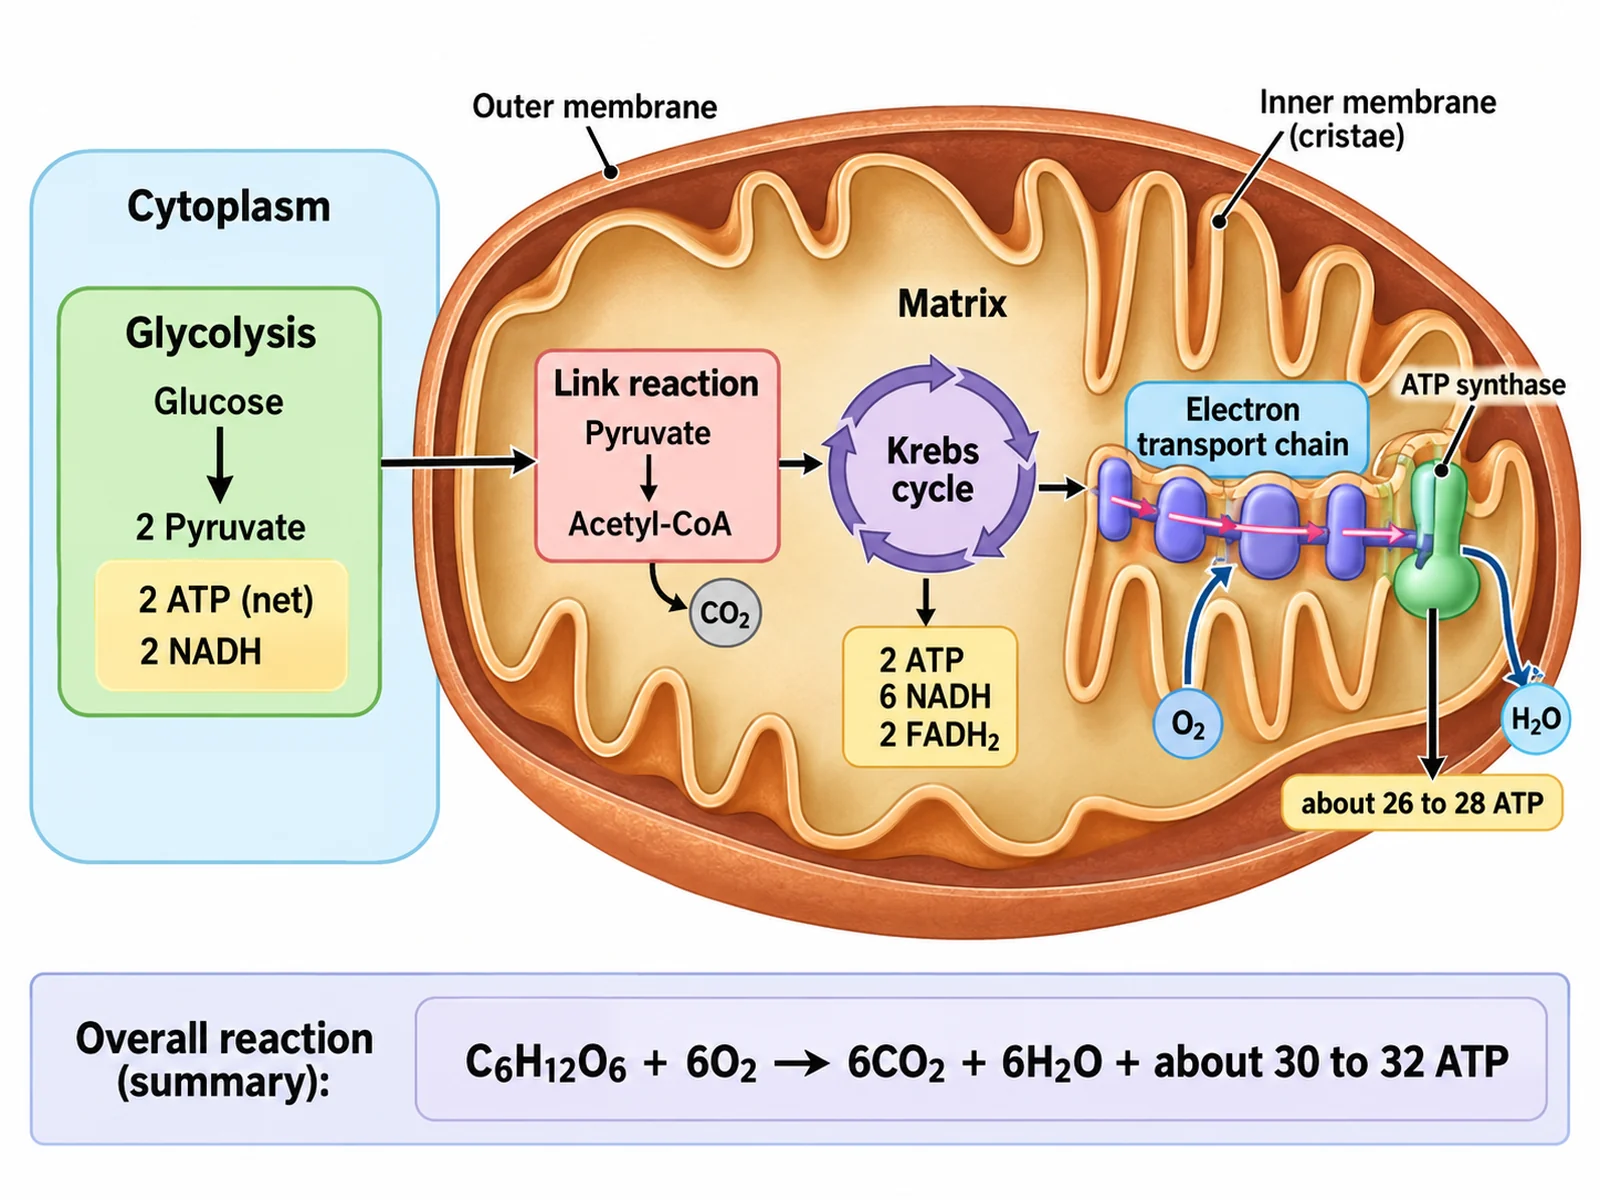
Cellular Respiration Diagram
Draw glycolysis, the Krebs cycle, and the electron transport chain.
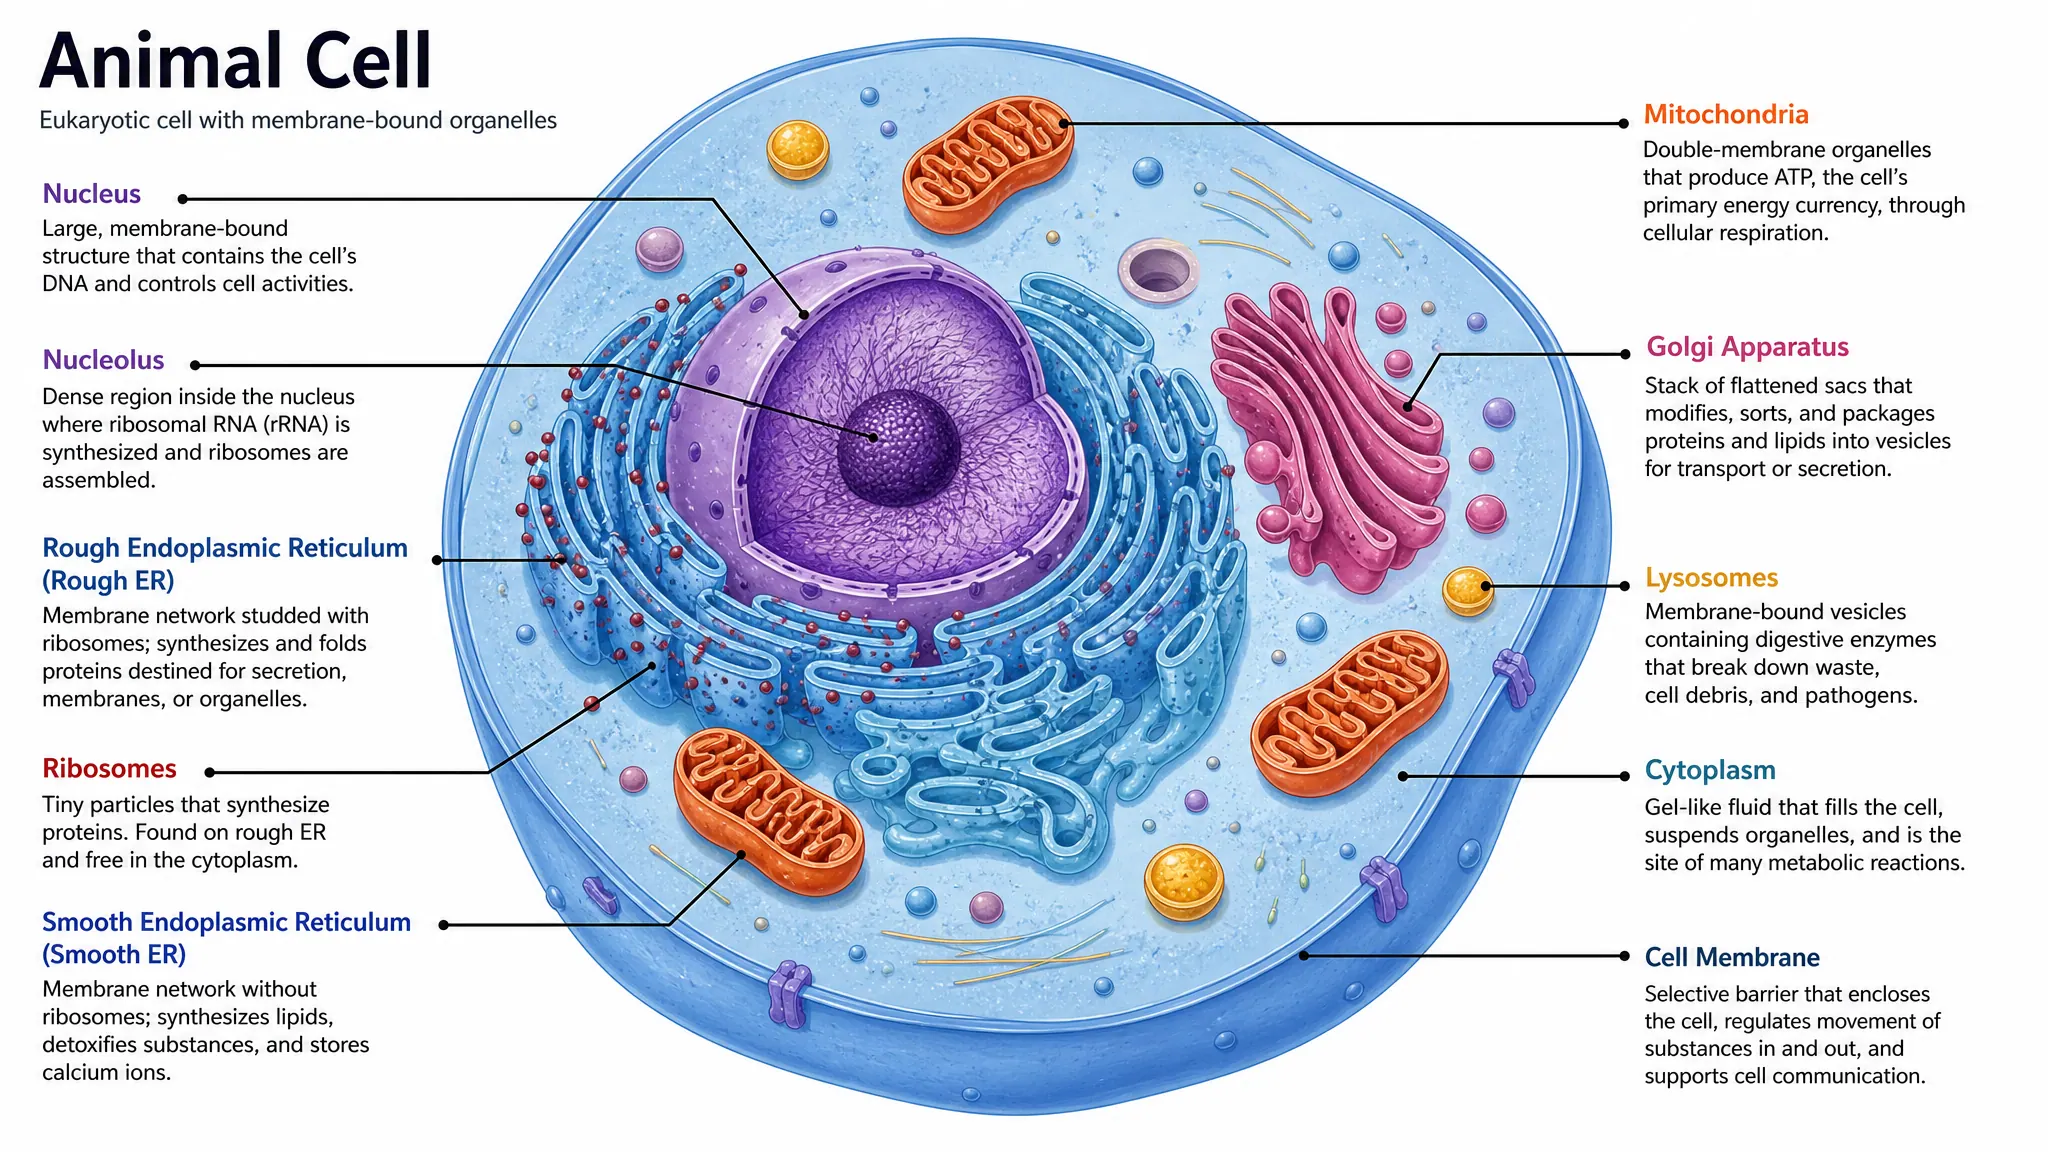
Biology Diagram Maker
Generate labelled cell, pathway, and anatomy diagrams with AI.
Need a full ecology figure?
SciFigure AI turns ecosystems, cycles, and experimental results into publication-ready figures for papers and slides.
Explore the biology toolsLast checked: September 20, 2026. Sources: OpenStax Biology 2e: Energy Flow through Ecosystems; Okabe & Ito, colour-blind safe palette.