Free fishbone diagram maker

Fishbone diagram maker for Ishikawa cause-and-effect analysis

Write the problem, list the possible causes under 6M, 8P, 4S or your own categories, and the fishbone draws itself: bones alternate above and below the spine, sub-causes branch off their causes, and every label is measured so nothing overlaps. Start from a lab template such as a failed PCR, or paste an indented list, then print it as a worksheet with an answer key or download it as SVG, PNG or PDF. Free, and it all runs in your browser.

Free, no sign-up6M, 8P, 4S and lab templatesPaste an indented listSVG, PNG and PDF export
TemplatesLab:Frameworks:
6 categories · 26 causes
Template DNAToo little templateDegraded templateRepeated freeze–thawNuclease contaminationInhibitors carried overEthanol or phenolfrom extractionEDTA chelating Mg2+PrimersAnnealingtemperature too highPoor primer designPrimer-dimersHairpins or 3′ mismatchesWrong pair or dilutionReagentsPolymerase inactiveLeft at room temperaturePast its expiry dateMg2+ too lowdNTPs degradedThermal cyclerWrong program loadedHeated lid offBlock temperature offProtocolToo few cyclesExtension too shortfor the ampliconHot-start enzymenot activatedOperatorComponent left out of the mixPipetting error atsmall volumesNo positive control runNo PCR producton the gel
Saved in this browser · nothing uploaded

Everything runs in your browser: nothing is uploaded, and your fishbone is kept on this device only. Undo with Ctrl+Z.

Templates

Fishbone diagram templates to start from

Three lab troubleshooting fishbones, the 6M, 8P and 4S category sets with worked examples, a hospital quality-improvement example and a blank fish. Open one in the editor and change any label, or print it as a worksheet with the causes left blank.

Template DNAToo little templateDegraded templateRepeated freeze–thawNuclease contaminationInhibitors carried overEthanol or phenolfrom extractionEDTA chelating Mg2+PrimersAnnealingtemperature too highPoor primer designPrimer-dimersHairpins or 3′ mismatchesWrong pair or dilutionReagentsPolymerase inactiveLeft at room temperaturePast its expiry dateMg2+ too lowdNTPs degradedThermal cyclerWrong program loadedHeated lid offBlock temperature offProtocolToo few cyclesExtension too shortfor the ampliconHot-start enzymenot activatedOperatorComponent left out of the mixPipetting error atsmall volumesNo positive control runNo PCR producton the gel

Why did the PCR fail?

No band on the gel: template, primers, reagents, cycler, protocol and operator.

CellsHigh passage numberOver-confluentbefore splittingPoor recoveryfrom frozen stockSlow thawDMSO not diluted promptlyMedium and reagentsWrong or expired mediumNew serum lotGlutamine broken downHandlingOver-trypsinizationHarsh pipetting or spinToo long outsidethe incubatorIncubatorCO2 drifted, pH offTemperature offWater pan dryContaminationMycoplasmaNot visible underthe microscopeNot tested forBacteria or fungiEndotoxin in reagentsMeasurementTrypan blue read too lateClumps miscountedCounter gate set wrongLow cell viabilityafter passaging

Low cell viability

Cultures dying after passage: cells, medium, handling, incubator, contamination, counting.

PipettingPipettes out of calibrationAir bubbles in wellsInconsistent techniqueTips not pre-wettedViscous samplespipetted forwardPlate and readerEdge effects from evaporationPlate washer leaves residueReader not warmed upReagentsNot at room temperatureNot mixed after thawingLot-to-lot differencesSamplesRepeated freeze–thawHaemolysis or lipaemiaOutside the standard curveProtocolUneven incubation timingPlates stackedin the incubatorWashes rushed or skippedAnalysisWrong curve fitOutliers removedinconsistentlyBlank not subtractedHigh CV betweenreplicate wells

High assay variability

Replicate wells disagree (high CV) in a plate assay such as an ELISA.

ManpowerNew operators not yet trainedFatigue on the night shiftMethodsWork instruction out of dateChangeover steps skippedMachinesWorn cutting toolPreventivemaintenance overdueMaterialsSupplier changed resin gradeMoisture in stored pelletsMeasurementsGauge not calibratedInspectors judgedefects differentlyMother NatureHumidity swings in summerDust near the loading doorHigh scraprate on line 2

6M (manufacturing)

Manpower, Methods, Machines, Materials, Measurements, Mother Nature.

ProductFeatures customersdo not usePackaging hard to openPriceFees not shown up frontCheaper rival plansPlaceShort opening hoursHard to reach by phonePromotionAds promise morethan we deliverUnclear onboarding emailsPeopleHigh staff turnoverFront-line staffcannot issue refundsProcessLong wait for supportCustomers repeatdetails on every transferPhysical evidenceDated websiteUntidy waiting areaProductivity and qualityNo first-contactresolution targetQuality checks only monthlyCustomer satisfactionscores falling

8P (services)

Product, Price, Place, Promotion, People, Process, Physical evidence, Productivity.

SurroundingsWarehouse layoutadds walkingPeak-season backlogSuppliersCarrier misses pick-up slotsPackaging shortagesSystemsStock levels wrongin the systemOrders batchedonly twice a daySkillsTemporary staffnot trained to pickNo cover for thedispatch plannerOrders delivered late

4S (service industry)

Surroundings, Suppliers, Systems, Skills.

Patient factorsConfusion or deliriumSedating orblood-pressure medicinesUrgent need for the toiletStaffFewer staff at nightHourly rounds missedEnvironmentPoor lighting at nightWet or cluttered floorEquipmentBed alarm offCall bell out of reachBed not in its lowest positionPolicies and proceduresFall-risk score not repeatedNo toileting scheduleCommunicationFall risk not handed overNo sign at the bedsidePatient fallson the ward

Patient falls (healthcare)

A ward quality-improvement fishbone: patient, staff, environment, equipment, policy, communication.

Category 1Category 2Category 3Category 4Category 5Category 6Problem statement

Blank fishbone

A problem and six empty categories to fill in.

Worked lab example

Why did the PCR fail? A fishbone and the 5 Whys, step by step

A student runs eight PCR reactions and a positive control. On the gel the DNA ladder looks normal, but there is no product band in any lane, the positive control included. Here is how a fishbone turns “it didn’t work” into a fix. (The scenario is illustrative.)

  1. 1. Write a precise problem. “No PCR product in 8 of 8 reactions or the positive control; ladder normal.” The normal ladder already rules out the gel, the stain and the imager.
  2. 2. Lay out every possible cause. The PCR template gives six bones: template DNA, primers, reagents, the thermal cycler, the protocol and the operator, with sub-causes such as inhibitors carried over from extraction or a hot-start enzyme that was never activated.
  3. 3. Let the controls prune the fish. The positive control uses a template and primers that have worked before, and it failed too. So the cause is something every tube shared: the master mix, the program, the cycler or the way the mix was made. Template DNA and primer design fade to the back (grey below).
  4. 4. Test the shortlist cheaply. The cycler log shows the right program ran. Rerunning the positive control with a fresh polymerase aliquot, beside the old one, gives a band only with the fresh enzyme: the cause is confirmed (red below).
Template DNAToo little templateDegraded templateRepeated freeze–thawNuclease contaminationInhibitors carried overEthanol or phenolfrom extractionEDTA chelating Mg2+PrimersAnnealingtemperature too highPoor primer designPrimer-dimersHairpins or 3′ mismatchesWrong pair or dilutionReagentsPolymerase inactiveLeft at room temperaturePast its expiry dateMg2+ too lowdNTPs degradedThermal cyclerWrong program loadedHeated lid offBlock temperature offProtocolToo few cyclesExtension too shortfor the ampliconHot-start enzymenot activatedOperatorComponent left out of the mixPipetting error atsmall volumesNo positive control runNo PCR producton the gel
The PCR fishbone after the controls: template DNA and primers ruled out, the inactive polymerase confirmed.

5. Ask why until the answer is a system you can fix

Replacing the enzyme fixes today’s run, but would the problem come back? Yes, so “inactive polymerase” is a contributing cause, not the root cause. The 5 Whys follows it down:

#Why?Because…
1Why was there no product in any tube?The polymerase in the shared master mix was inactive: a fresh aliquot rescued the positive control.
2Why was the working aliquot inactive?It was kept in the freezer door, where the temperature rises every time the door opens and during defrost cycles.
3Why was it in the door?The −20 °C freezer was full, and the lab’s enzymes had no assigned shelf.
4Why was there no assigned shelf?Nobody had owned the freezer inventory since the lab manager left, so space was never reallocated.

Four whys reach a cause that, once fixed, stops the problem coming back: give the freezer an owner and an inventory, keep enzymes in a labelled box on an inside shelf, split new enzyme into single-use aliquots, and keep it in a benchtop cooler during setup. Then check the fix: the next runs, positive control included, should give bands. Write the new setup steps down as a workflow diagram for the lab wiki, and if you need to weigh repairs against their chances of success, a decision tree works out the expected value of each option.
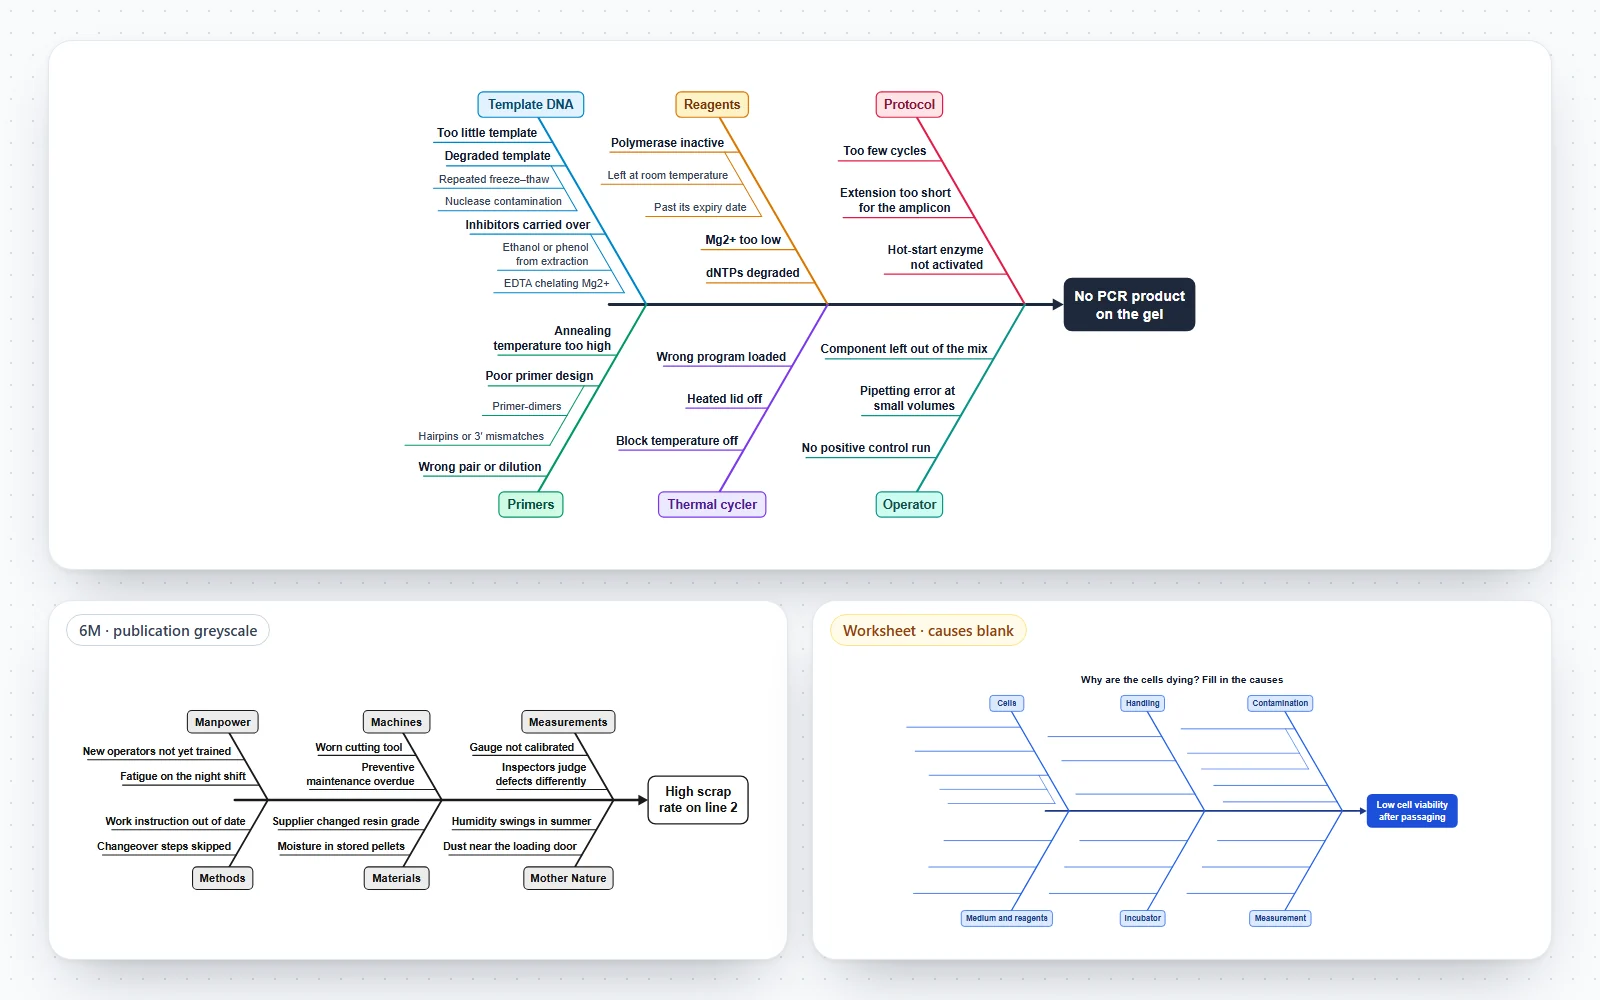
A fishbone diagram of why a PCR failed, with six colour-coded category bones and their causes and sub-causes, above a greyscale 6M manufacturing fishbone and a cell-viability worksheet with the causes left blank for students

How to use this fishbone diagram maker

The editor keeps the problem, the categories and the causes in one outline, and redraws the fishbone after every change. Everything can be undone with Ctrl+Z, and your work is saved in this browser as you go.

  • Pick a template from the row above the diagram: three lab problems (a failed PCR, low cell viability, high assay variability), the 6M, 8P and 4S category sets, a hospital patient-falls example, or a blank fishbone with six empty categories.
  • Type the problem into the head of the fish, then edit the list under Build. Enter adds the next label at the same level, Tab turns a cause into a sub-cause of the one above, Shift+Tab moves it back up, Alt+↑ and Alt+↓ reorder, and Backspace on an empty label deletes it.
  • Click any label in the drawing to jump to it in the list. Double-click to rename it straight away.
  • Prefer typing? Open the Text tab and write or paste an indented outline: the problem on the first line, categories below it, causes indented under their category. The diagram follows as you type.
  • Style the diagram: colour, single blue or publication greyscale; the problem on the right or the left; the angle of the bones; text size, spacing and where labels wrap.
  • Export: Copy image for slides and documents, SVG for vector editing, PNG at 2× or 4×, PDF through the print dialog, the outline as text, or a .json file you can open again later.

What is a fishbone (Ishikawa) diagram?

A fishbone diagram, also called an Ishikawa diagram or a cause and effect diagram, sorts the possible causes of one problem into categories so a team can see them all at once. It is named after Kaoru Ishikawa, who described using it with engineers at the Kawasaki Steel Works in 1943 and later made it one of the seven basic tools of quality in his Guide to Quality Control. Its shape gives it its other name: the problem is the head of a fish, and the causes are its bones.

  • Head: the effect, the problem being explained, written as a specific and measurable statement.
  • Spine: the horizontal line running into the head. Everything on the diagram feeds it.
  • Main bones: the categories of cause, such as Methods, Machines and Materials. They slant off the spine, alternating above and below.
  • Ribs: the individual causes, written on short lines that join their category’s bone.
  • Smaller bones: sub-causes, the answers to “why does that happen?”, branching off the cause they explain.
  • A fishbone lists possible causes, not proven ones. It organises a brainstorm and shows where to collect evidence; data decides which causes are real.

How to create a fishbone diagram, step by step

The method is the same on a whiteboard, on sticky notes or in a fishbone diagram generator like this one. The quality guides from ASQ, IHI and the US Centers for Medicare & Medicaid Services all follow roughly these steps.

  • Agree on the problem statement and write it in the head. Make it specific (“No PCR product in 6 of 8 reactions since 3 March”), not vague (“PCR issues”), and never a solution in disguise (“We need a new cycler”).
  • Choose the main categories. Use a standard set such as 6M, 8P or 4S, or name your own, usually four to eight. Each becomes a bone.
  • Brainstorm causes under each category by asking “Why does this happen?”. Write each cause as a short phrase on a rib. A cause can sit under more than one category if it genuinely belongs to both.
  • Ask “why?” again about each cause and add the answers as sub-causes. Keep going until you reach something you can check or change.
  • Review the whole fish: merge duplicates, move causes to the clearest category, and look for bones that are empty, which often point to a blind spot rather than a cause-free area.
  • Pick the most likely causes, by team vote or by evidence already in hand, and test them. The diagram tells you where to look; measurements, controls and records confirm the root cause.

6M, 8P and 4S: choosing fishbone categories

Categories are prompts, not rules: they make the team look in places it might skip, and they can be renamed to suit the problem. These are the classic sets and where each fits best.

  • 6M, for manufacturing and engineering: Manpower (people), Methods, Machines, Materials, Measurements and Mother Nature (the environment). Many teams now write People and Environment for the first and last. Shorter 5M and longer 7M or 8M versions also circulate, adding Management, Money or Maintenance.
  • 8P, for services and marketing: Product, Price, Place, Promotion, People, Process, Physical evidence and Productivity and quality. It extends the marketing mix, so it suits complaints, falling sales or poor uptake of a service. Some versions swap in Policies, Procedures or Plant.
  • 4S, for service industries: Surroundings, Suppliers, Systems and Skills. It is short, which suits a quick team session about delays, errors or customer service problems.
  • Healthcare: IHI suggests Materials, Methods, Equipment, Environment and People; the CMS root-cause guidance suggests equipment and supplies, environment, rules and procedures, and people. The patient-falls template splits people into patient and staff and adds communication.
  • Research and lab work: name the bones after the parts of the experiment, such as Sample, Reagents, Instrument, Protocol, Analysis and Operator. That keeps every cause something you can test with a control.
  • Process fishbone: when the problem arises across a sequence of steps, make each step a bone. Use a workflow or flowchart first if the steps themselves are unclear.

A fishbone diagram template for the lab

Troubleshooting an experiment is root cause analysis on a small scale, and a fishbone keeps it systematic: instead of changing the first thing that comes to mind, you list everything that could explain the result and then use controls to rule whole bones in or out. The three lab templates are written from standard troubleshooting advice.

  • Why did the PCR fail? Template DNA (too little, degraded, inhibitors such as carried-over ethanol, phenol or EDTA), primers (annealing temperature, design, the wrong pair), reagents (inactive polymerase, too little Mg2+, degraded dNTPs), the thermal cycler, the protocol (cycles, extension time, hot-start activation) and the operator.
  • Low cell viability: the cells themselves (passage number, confluence, thawing), medium and serum, handling (over-trypsinization, harsh pipetting), the incubator (CO2, temperature, humidity), contamination including mycoplasma, and how viability was measured.
  • High assay variability: pipetting, the plate and reader (edge effects, washer residue), reagents and samples, the protocol’s timing and temperature, and the analysis (curve fit, outlier handling, blank subtraction).
  • Controls prune the fish. If the positive control failed too, the cause is shared by every reaction (master mix, program, cycler), so the template bone drops down the list; if only some samples failed, the shared bones are less likely.
  • Record the fishbone with the experiment. A diagram in the lab notebook or the methods appendix shows reviewers and colleagues what was checked.

From possible causes to the root cause: pairing the fishbone with the 5 Whys

A fishbone diagram is wide: it collects every plausible cause. The 5 Whys is deep: it follows one cause down to its origin. Used together, the fishbone finds the candidates and the 5 Whys traces the strongest one to something you can fix.

  • Mark the two or three causes the team rates most likely, or that the data already points to.
  • For each, ask “why?” and write the answer, then ask “why?” about that answer. The sub-cause levels of the fishbone hold the first answers; carry on in your notes when you need more.
  • Stop when fixing the answer would stop the problem coming back. The CMS Five Whys tool puts it as a test: if this answer were corrected, is the problem likely to recur? If yes, it is a contributing factor, not the root cause.
  • Three to five rounds is typical, but it can take more. Avoid answers that blame a person (“the student made a mistake”); ask why the system let the mistake happen.
  • Confirm the root cause with evidence before acting, then check after the fix that the effect really went away.

Fishbone worksheets and answer keys for teaching

A fishbone is a good classroom exercise in quality management, nursing quality improvement, lab training and problem-solving lessons. Under Worksheet, the same diagram becomes a printable fishbone diagram template.

  • Blank causes keeps the problem and the category names and leaves an empty write-on line for every cause, so students fill in the ribs.
  • Blank categories and causes leaves only the problem, for students to choose their own categories as well.
  • Show answers fills the blanks back in, in red, for the teacher’s copy. The worksheet and the key use exactly the same layout, so they line up when compared.
  • Extra blank lines adds up to four empty ribs to every category, for causes students think of themselves.
  • Print or save as PDF from the PDF button, or download a PNG for a slide or learning platform.

Common mistakes when you make a fishbone diagram

  • A vague problem. “Quality issues” gives a vague fish; “12% of panels scratched on line 2 since May” gives one you can test.
  • Writing solutions instead of causes. “Buy a new pipette” is an action; the cause is “pipette out of calibration”.
  • Stopping at symptoms. If a cause still makes you ask “why?”, add a sub-cause under it.
  • Treating the diagram as the answer. Every bone is a hypothesis until data supports it.
  • Too many words on a rib. Short phrases read better and fit; put detail in notes.
  • Blaming people. “Careless technician” ends the conversation; “no checklist for master-mix setup” starts a fix.
  • Forcing categories. If a standard set leaves bones empty or crowded, rename the categories to suit the problem.

Fishbone diagram vs 5 Whys, Pareto chart, fault tree and flowchart

Root cause analysis has several tools, and they work best in combination.

  • Fishbone diagram: lists many possible causes in categories. Best at the start, in a team, when the cause is unknown.
  • 5 Whys: follows one chain of cause and effect downward. Best once a likely cause is chosen; quick, but it can miss causes that need more than one chain.
  • Pareto chart: ranks causes by how often they happen or how much they cost, from data. Best for deciding which causes on the fishbone to tackle first.
  • Fault tree analysis: works down from a failure through AND and OR logic gates, often with probabilities. Best for safety-critical systems.
  • Flowchart or process map: shows the steps of a process in order. Best for spotting where in the process the problem enters; each step can then become a bone.
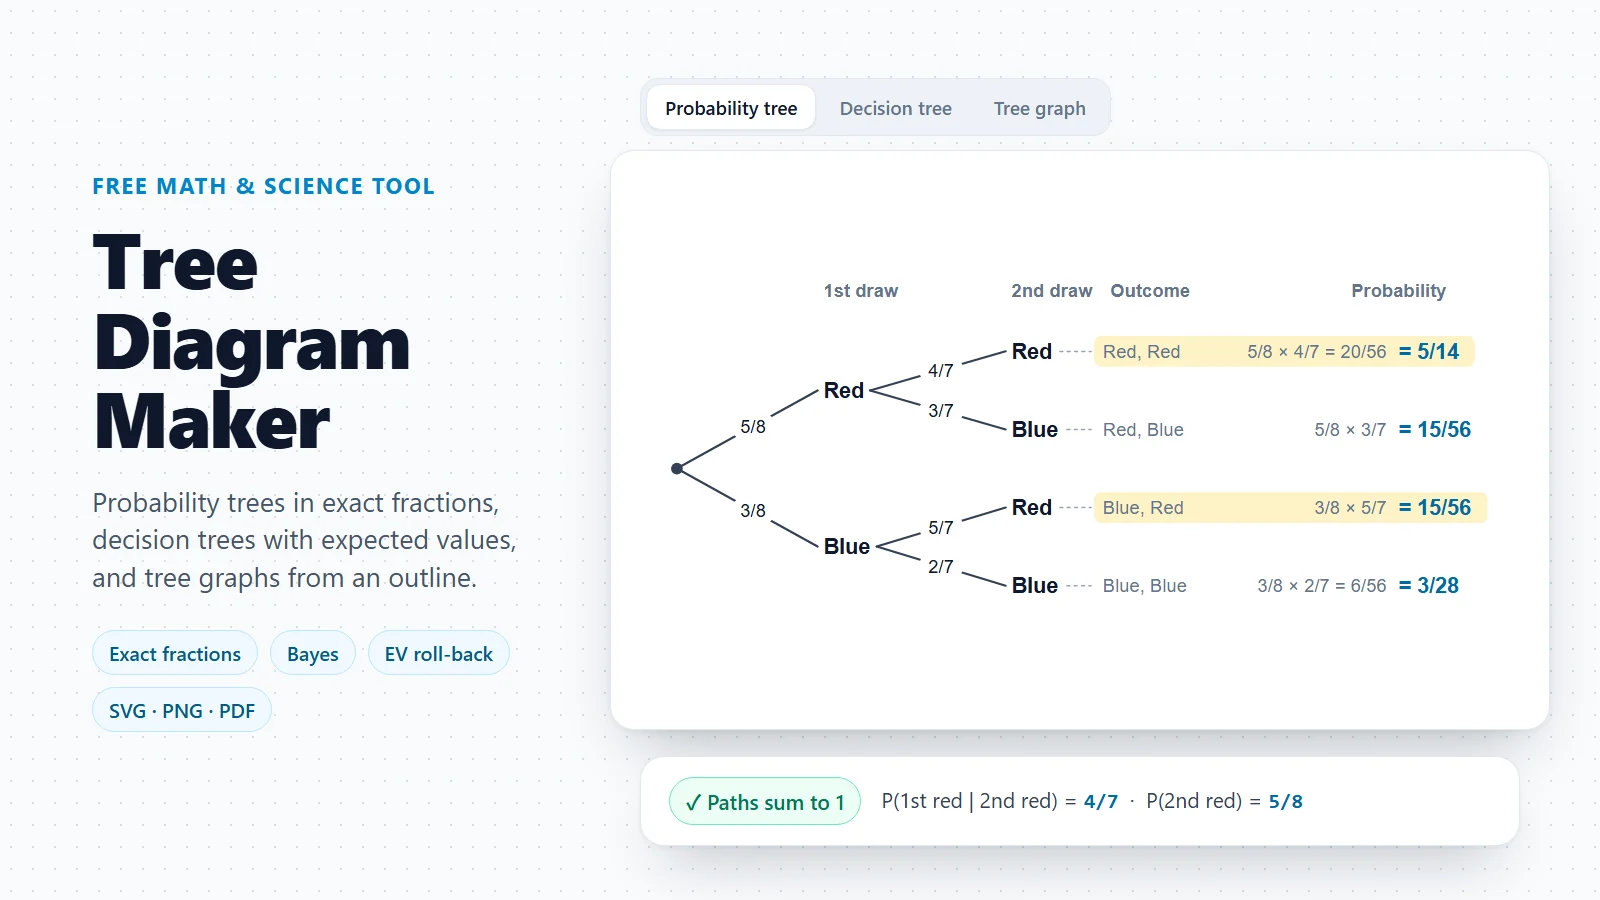
  • Tree diagram: when causes branch strictly with no categories, or when you want probabilities on each branch, a tree diagram fits better than a fishbone.

Why use fishbone diagram software instead of Word, PowerPoint or Excel?

You can build an Ishikawa diagram from lines and text boxes in Word, PowerPoint or Excel, but every new cause means nudging lines and boxes by hand. Dedicated Ishikawa diagram software, or an online fishbone diagram builder like this one, does the layout for you, and this program is free.

  • Automatic layout: adding, removing or rewording a cause re-spaces the whole fish so nothing overlaps.
  • Edit as a list: the outline is faster than drawing, and you can paste notes from a meeting or a spreadsheet column.
  • Clean exports: vector SVG and PDF stay sharp in reports, posters and papers; publication greyscale suits journals that print in black and white.
  • Private: the fishbone diagram creator runs entirely in your browser. Nothing is uploaded, and there is no account.

Frequently asked questions

What is a fishbone diagram used for?

To find the possible causes of a problem and sort them into categories, usually in a team brainstorm at the start of a root cause analysis. Quality improvement in manufacturing, healthcare and services uses it widely, and it works just as well for troubleshooting a failed experiment.

Is this fishbone diagram maker free?

Yes. Every template, the editor, the worksheet mode and all exports (SVG, PNG and PDF) are free, with no sign-up and no watermark. It runs in your browser, so nothing is uploaded.

Why is it called an Ishikawa diagram?

After Kaoru Ishikawa, the Japanese quality pioneer who described using it with engineers at the Kawasaki Steel Works in 1943 and popularised it in his Guide to Quality Control. It is also called a fishbone, herringbone or cause and effect diagram.

What are the 6Ms of a fishbone diagram?

Manpower (people), Methods, Machines, Materials, Measurements and Mother Nature (the environment). They come from manufacturing; load the 6M template to start with all six bones drawn.

What are the 8Ps and the 4Ss?

The 8Ps, for services and marketing, are Product, Price, Place, Promotion, People, Process, Physical evidence and Productivity and quality. The 4Ss, for service industries, are Surroundings, Suppliers, Systems and Skills. Both are templates in the tool.

How many categories and causes should a fishbone diagram have?

Usually four to eight categories with a handful of causes each. This tool takes up to 12 categories, 16 branches per bone and four levels below the problem (category, cause, sub-cause, sub-sub-cause). If a fish gets much bigger, split the problem into smaller ones.

Can I create a fishbone diagram from a list?

Yes. In the Text tab, put the problem on the first line, the categories on the lines below, and indent each cause under its category with spaces or a tab. Bullets and numbering are ignored, and the diagram updates as you type. The same tab copies your fishbone back out as an outline.

Can the head of the fish be on the left?

Yes. Under Style, set Problem on the left. The whole diagram is mirrored, with the bones slanting the other way, while the text still reads left to right.

What is the difference between a fishbone diagram and the 5 Whys?

A fishbone diagram goes wide, collecting many possible causes in categories. The 5 Whys goes deep, following one cause down by asking “why?” until you reach something that, once fixed, stops the problem recurring. Teams often draw the fishbone first and then run the 5 Whys on its most likely causes.

Does a fishbone diagram show the root cause?

Not on its own. It shows possible causes and how they relate. You find the root cause by testing the likeliest ones with data, controls or records, and by asking “why?” until fixing the answer would prevent a repeat.

Can I make a blank fishbone diagram template or worksheet?

Yes. Load the Blank fishbone for six empty categories, or use the Worksheet tab on any diagram to blank the causes (or the causes and the categories), add extra write-on lines, and switch on Show answers for the key.

How do I put a fishbone diagram in Word, PowerPoint or Excel?

Click Copy image and paste it into the document, slide or sheet, or download a PNG. For a report or poster that must stay sharp, download the SVG (Word and PowerPoint insert SVG directly) or save a PDF from the print dialog.

Is my fishbone saved, and is my data uploaded?

Your diagram is saved automatically in this browser and comes back when you return. Nothing is uploaded. To move it to another computer, use More, then Save fishbone file, and open the .json file there.

Can I use a fishbone diagram in a research paper or lab report?

Yes. Fishbone diagrams appear in quality-improvement papers, failure analyses and troubleshooting appendices. Use the publication greyscale theme, export SVG or PDF, and describe in the text which causes were tested and how.

Found the root cause? Fix the process next.

Once the fishbone has done its job, draw the corrected procedure as a clear step-by-step figure for the lab wiki, a SOP or the methods section.

Open the workflow diagram generator