Create clean PRISMA flow diagrams for systematic reviews, meta-analyses, scoping reviews, and evidence syntheses. Describe search counts, screening steps, exclusion reasons, and included studies, then generate a polished review-flow visual.
PRISMA 2020-ready layoutRecords to included studiesJournal-ready review charts
AI PRISMA Flow Diagram Generator
Describe your review counts, screening steps, exclusions, and included studies.
Costs 5 credits431 / 2000 characters
Generate a publication-ready PNG from your review counts.
Preview
PRISMA Flow Diagram Example Previews
Target aspect ratio: 4:3
Sample previews. Describe review counts to generate your own PRISMA diagram.
PRISMA Flow Diagram Examples
Use these examples as visual directions for systematic reviews, meta-analyses, scoping reviews, evidence syntheses, and manuscript-ready PRISMA charts.
Prompt
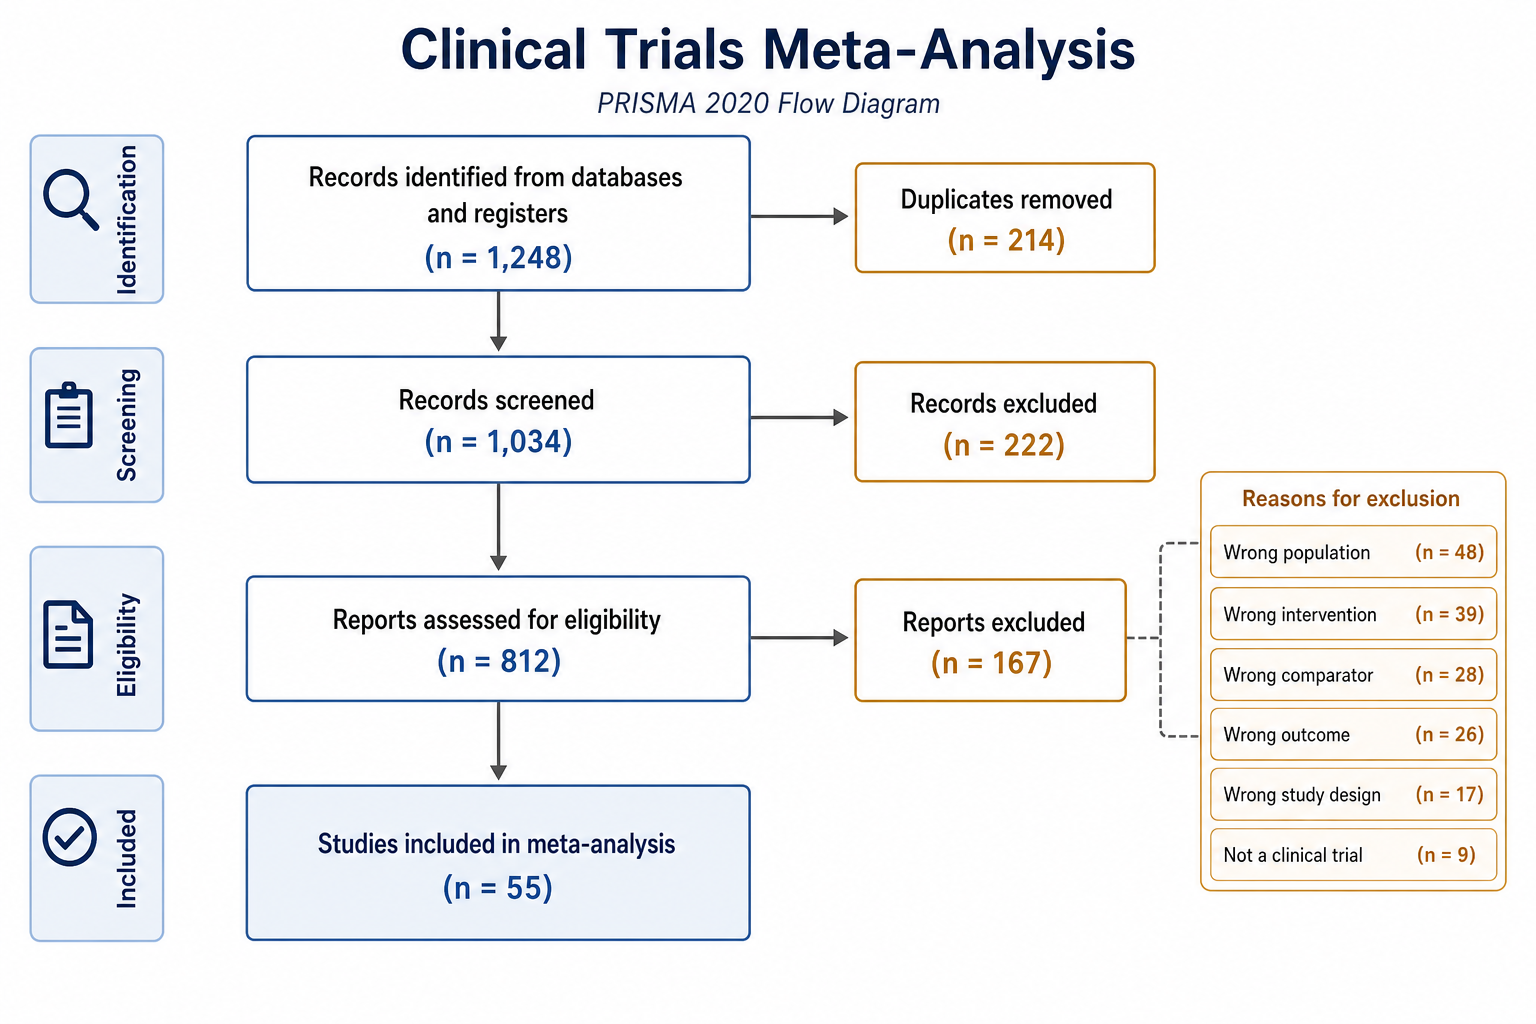
Based on your typed systematic review counts, create a PRISMA 2020-style flow diagram for a clinical trials meta-analysis. Show records identified from databases and registers, duplicate records removed, records screened, reports sought for retrieval, reports assessed for eligibility, reports excluded with reasons, and randomized controlled trials included in qualitative and quantitative synthesis. Use clean blue and amber connected boxes, readable counts, directional arrows, and a manuscript-ready white background.
Clinical Trials Meta-Analysis
Prompt
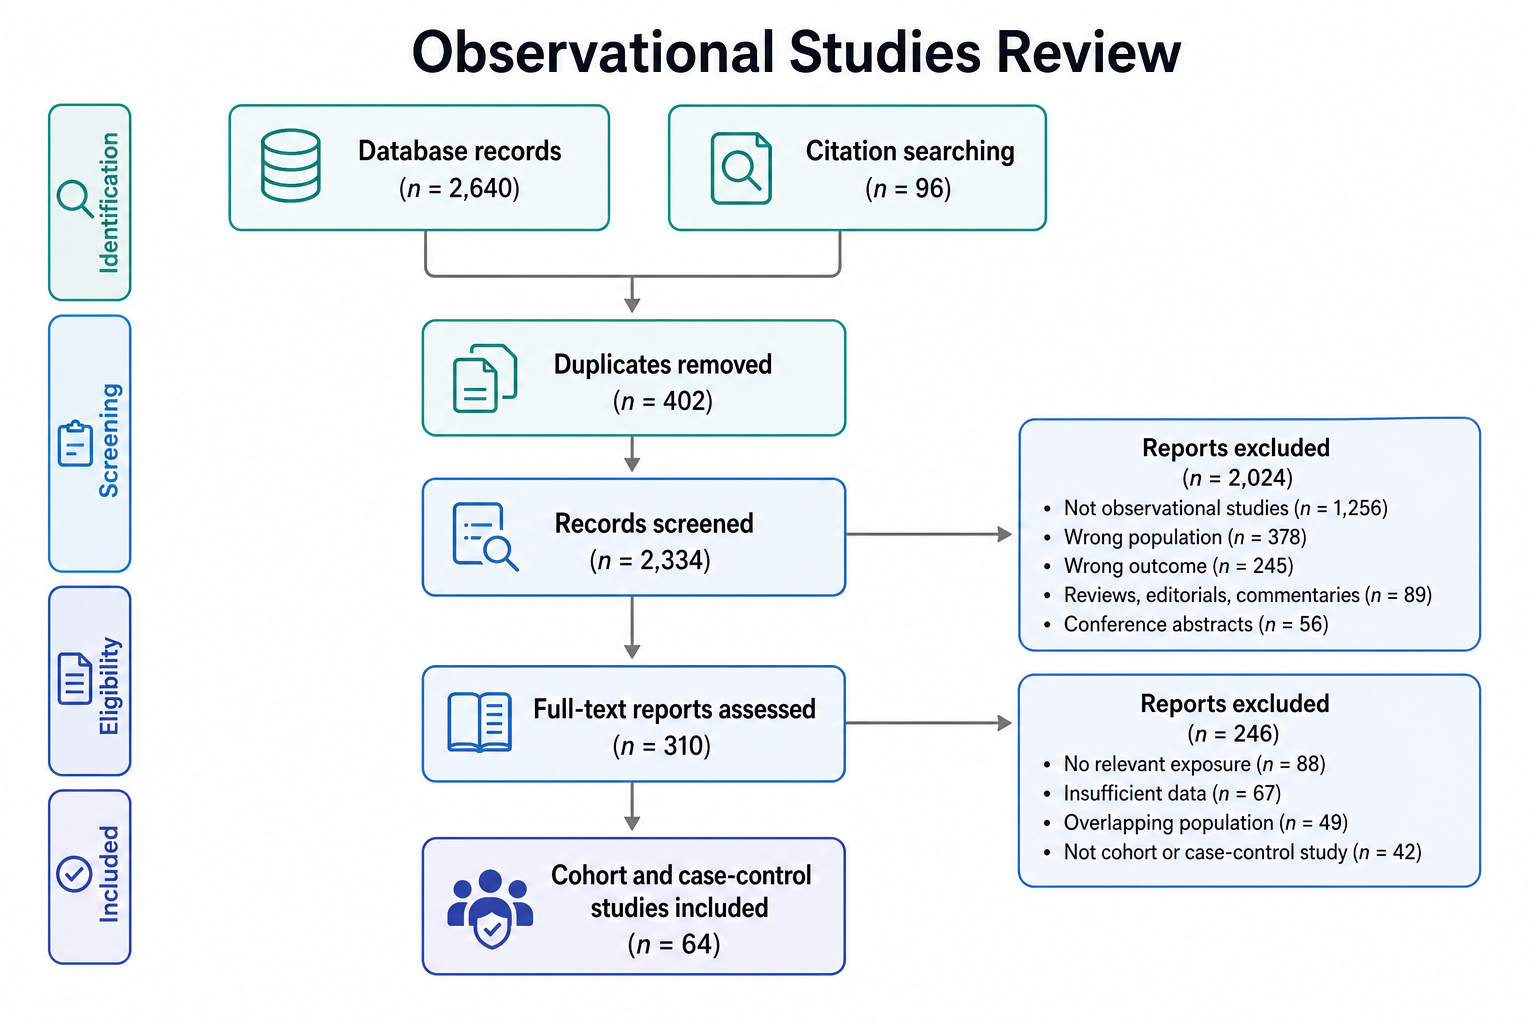
Based on your typed review counts, create a PRISMA flow diagram for an observational studies systematic review. Include database search records, grey literature sources if provided, duplicates removed, title and abstract screening, reports assessed for eligibility, exclusions for wrong population, wrong exposure, wrong outcome, and final cohort or case-control studies included. Use clear stage headings, compact connected boxes, and subtle scientific blue accents on a white background.
Observational Studies Review
Prompt
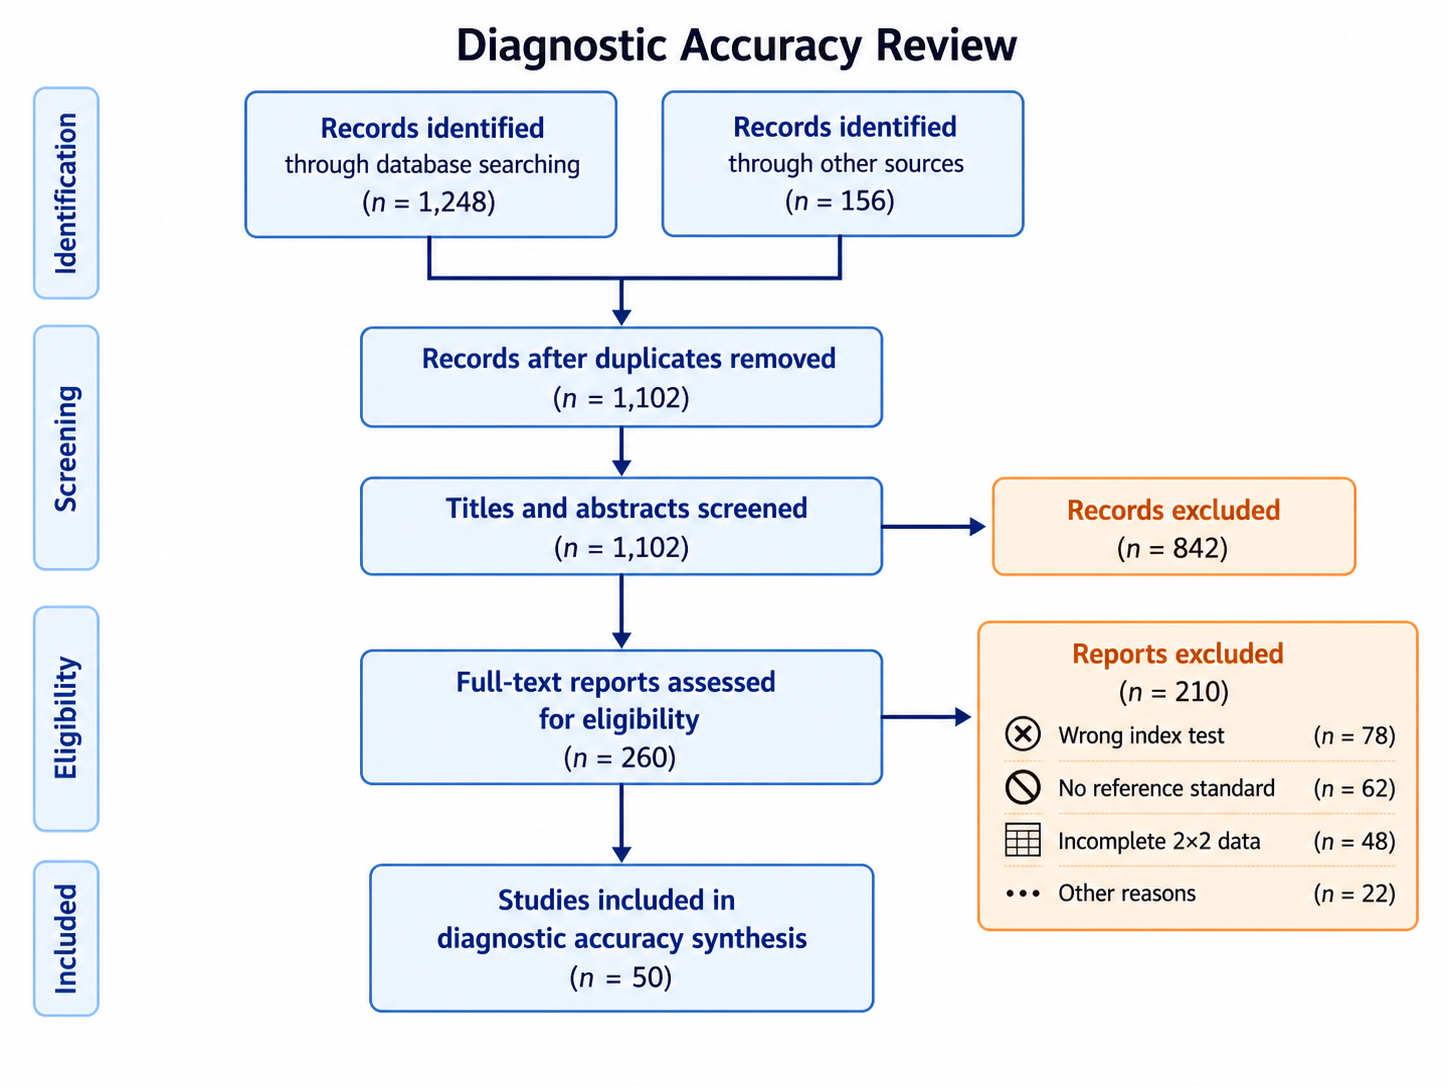
Based on your typed diagnostic review counts, create a PRISMA-style diagram for a diagnostic test accuracy review. Show records identified, duplicates removed, titles and abstracts screened, full-text reports assessed, exclusions for index test, reference standard, population, and incomplete data, then final diagnostic accuracy studies included. Use crisp boxes, arrow connectors, legible count labels, and a clean review-methods figure style.
Diagnostic Accuracy Review
Prompt
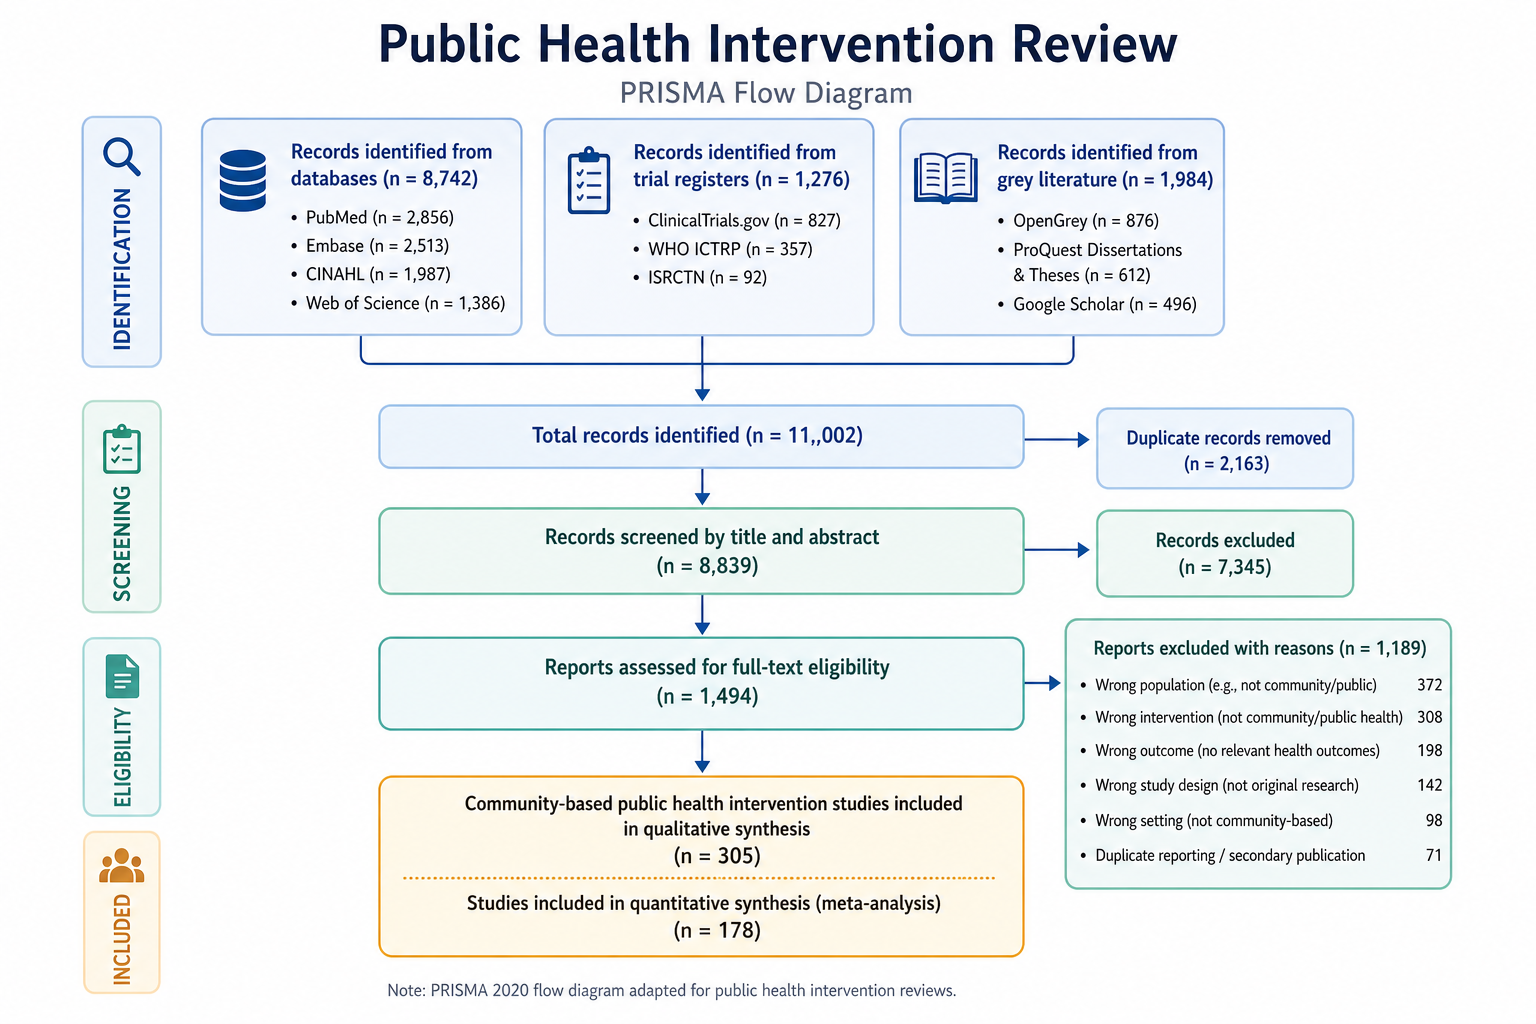
Based on your typed public health review counts, create a PRISMA flow diagram for an intervention review. Include databases, trial registries, manual search records, duplicate removal, screening, retrieval, eligibility assessment, exclusions for setting, intervention design, comparator, outcomes, and final studies included. Use a polished public health methods layout with blue-green boxes, small exclusion reason notes, and clear arrows.
Public Health Intervention
Prompt
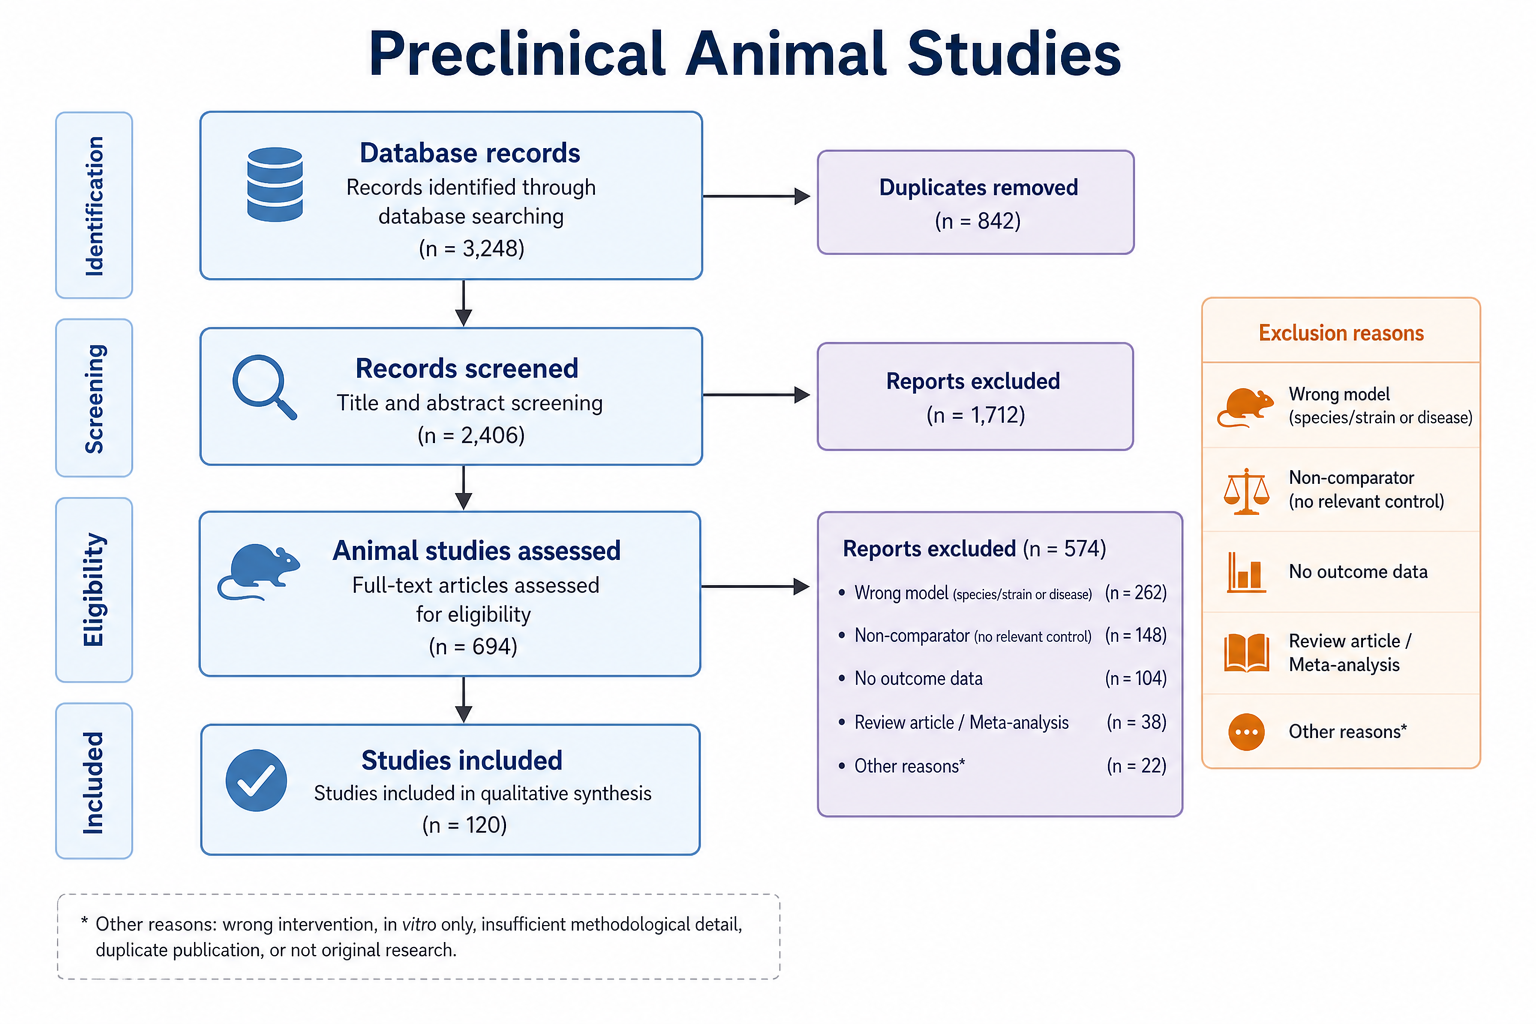
Based on your typed preclinical review counts, create a PRISMA-style flow diagram for animal studies. Show database records, duplicates removed, records screened, full texts assessed, exclusions for wrong animal system, wrong intervention, no control group, unavailable outcome, and studies included for narrative synthesis or meta-analysis. Use clean connected boxes, readable labels, and a white background suitable for a research manuscript.
Preclinical Animal Studies
Prompt
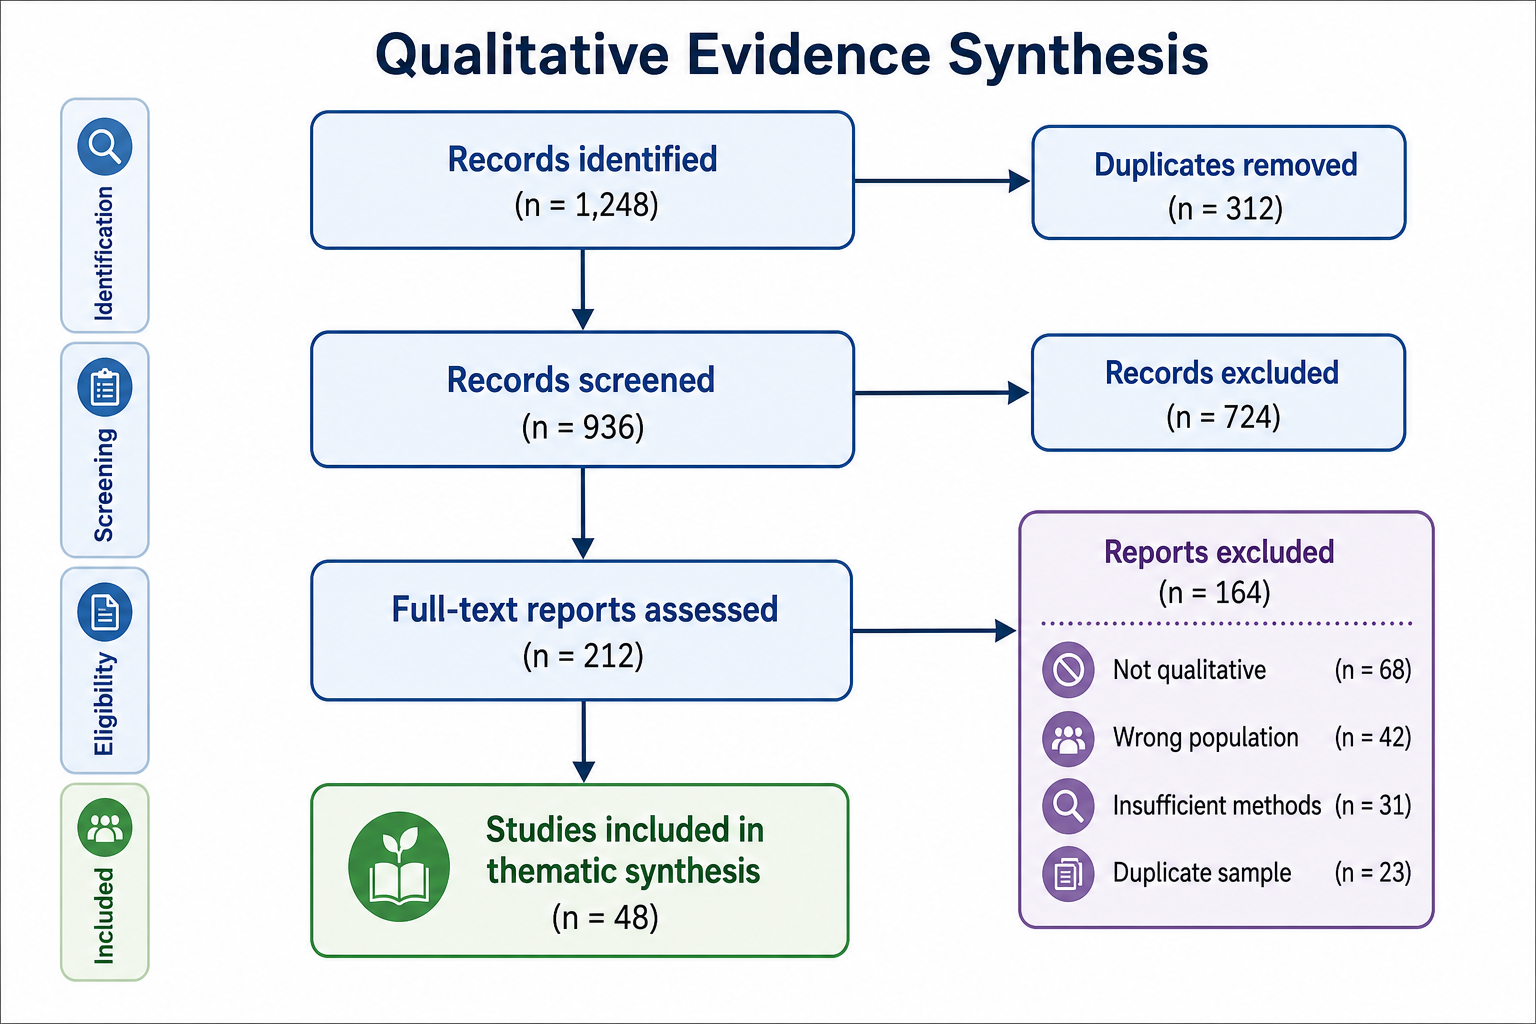
Based on your typed qualitative review counts, create a PRISMA flow diagram for a qualitative evidence synthesis. Include records from databases, citation searching, duplicates removed, records screened, full texts assessed, exclusions for wrong phenomenon of interest, study design, population, or context, and final studies included in thematic synthesis. Use soft blue and lavender boxes, readable count hierarchy, and a clean white academic layout.
Qualitative Evidence Synthesis
How to make a PRISMA flow diagram
1
Enter review counts
Paste records identified, duplicates removed, screened records, reports retrieved, eligibility exclusions, and included studies.
2
Describe the review type
Say whether the diagram is for a meta-analysis, scoping review, diagnostic accuracy review, intervention review, or qualitative synthesis.
3
Generate and review
Check that counts reconcile, exclusion reasons are clear, arrows flow correctly, and labels match your manuscript before export.
What does this PRISMA flow diagram generator do?
This PRISMA flow diagram generator turns review counts and exclusion notes into a clean flow chart for systematic reviews, meta-analyses, scoping reviews, and evidence syntheses. Describe records identified, duplicates removed, screening results, full-text reports assessed, exclusion reasons, and final included studies, then generate a review-flow visual with connected boxes, arrows, and readable labels.
Why use a PRISMA flow diagram generator
Create a PRISMA flow diagram faster than rebuilding boxes and arrows by hand.
Keep records, reports, studies, exclusions, and included-study counts organized.
Draft a consistent visual for systematic reviews, meta-analyses, scoping reviews, and protocols.
Update the diagram quickly when screening counts or exclusion reasons change.
How to make a PRISMA flow diagram
Start with the numbers from your search and screening log. List records from databases and registers, duplicates removed, records screened, reports sought, full-text reports assessed, reports excluded with reasons, and studies included. Add your review type and preferred style, then generate the PRISMA flow diagram and check the count flow before using it in a paper, poster, thesis, or report.
Parts of a PRISMA flow diagram
Identification boxes show records found through databases, registers, citation searching, or other sources.
Screening boxes show duplicates removed, records screened, and records excluded.
Eligibility boxes show reports sought, reports assessed, and reports excluded with reasons.
Included boxes show studies included in qualitative synthesis, quantitative synthesis, or final review analysis.
Directional arrows connect each stage so readers can follow how records move through the review.
PRISMA Flow Diagram FAQ
A PRISMA flow diagram is a review-methods chart that shows how records move from search and identification through screening, eligibility assessment, exclusions, and final study inclusion.