Turn a study plan into a clear experimental design diagram: the independent variable and its levels, the dependent variable, the controlled variables, the control and treatment groups, random assignment, replicates, and when each measurement is taken. Draw a simple controlled experiment for a science class, or a randomized, factorial or crossover design for a paper or protocol.
Variables and controls taggedParallel, factorial, crossoverClass worksheet or paper figure
Design terms checked against OpenStax and NIST
Worksheet + answer key pairs
Print-ready PNG
AI Experimental Design Diagram Maker
Describe the question, the groups, what changes, what is measured, and what stays the same.
529 / 2000 characters
Generate a publication-ready PNG from your description.
Preview
Experimental Design Diagram Example Previews
Target aspect ratio: 16:9
Sample previews. Describe your experiment to generate your own design diagram.
Experimental Design Diagram Examples
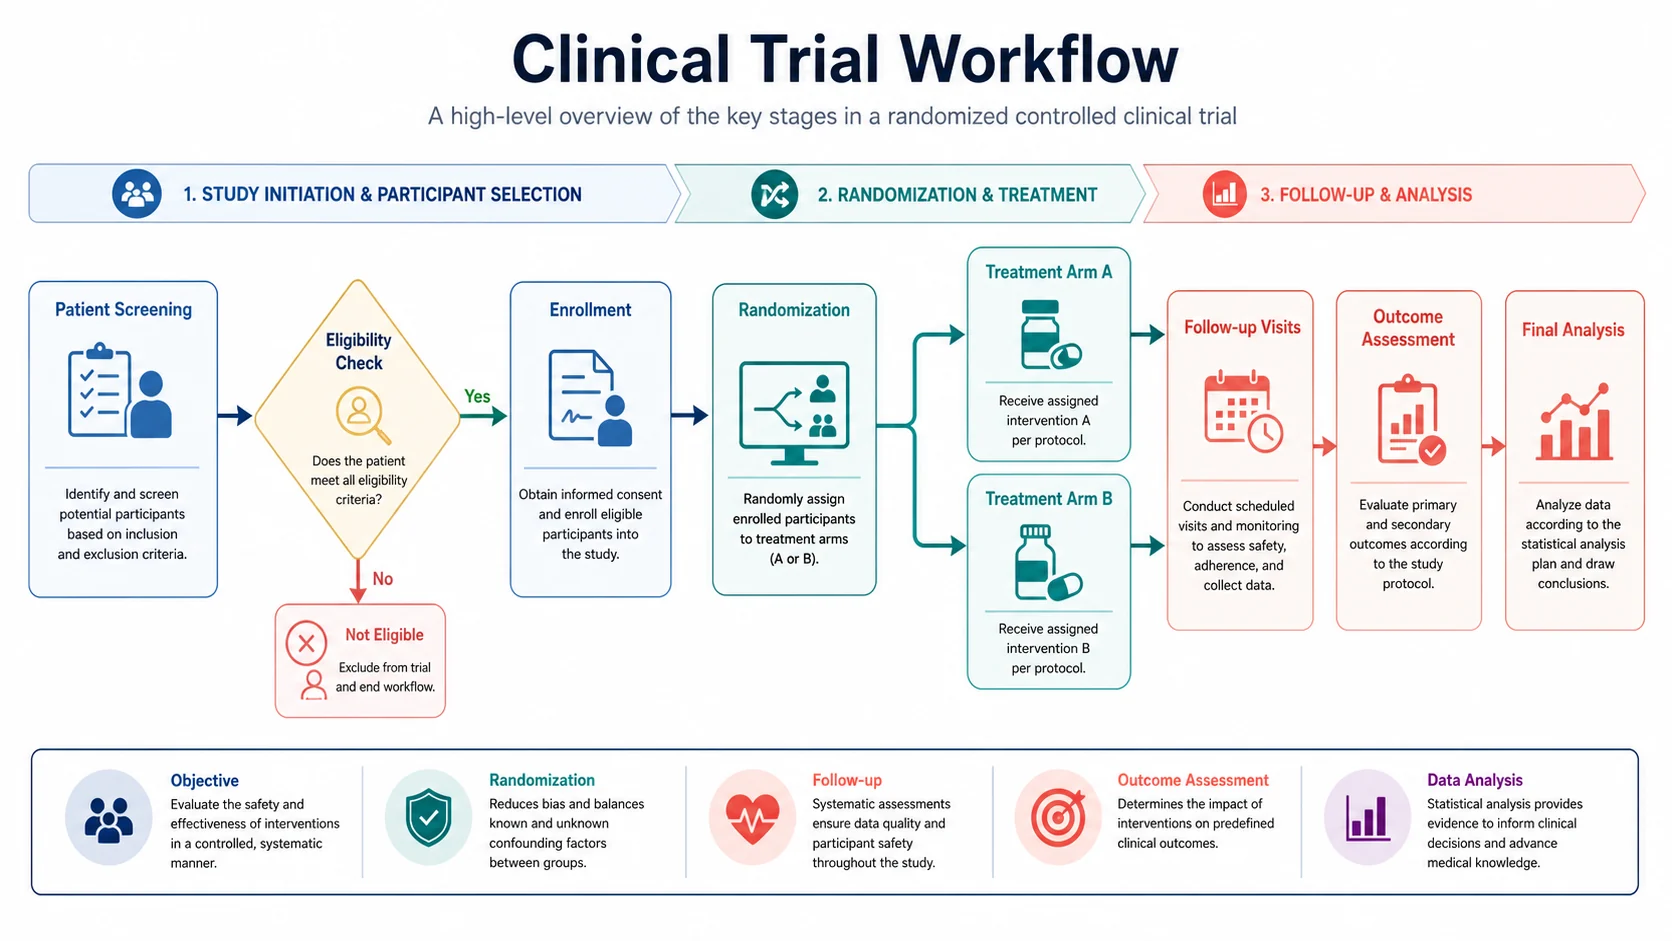
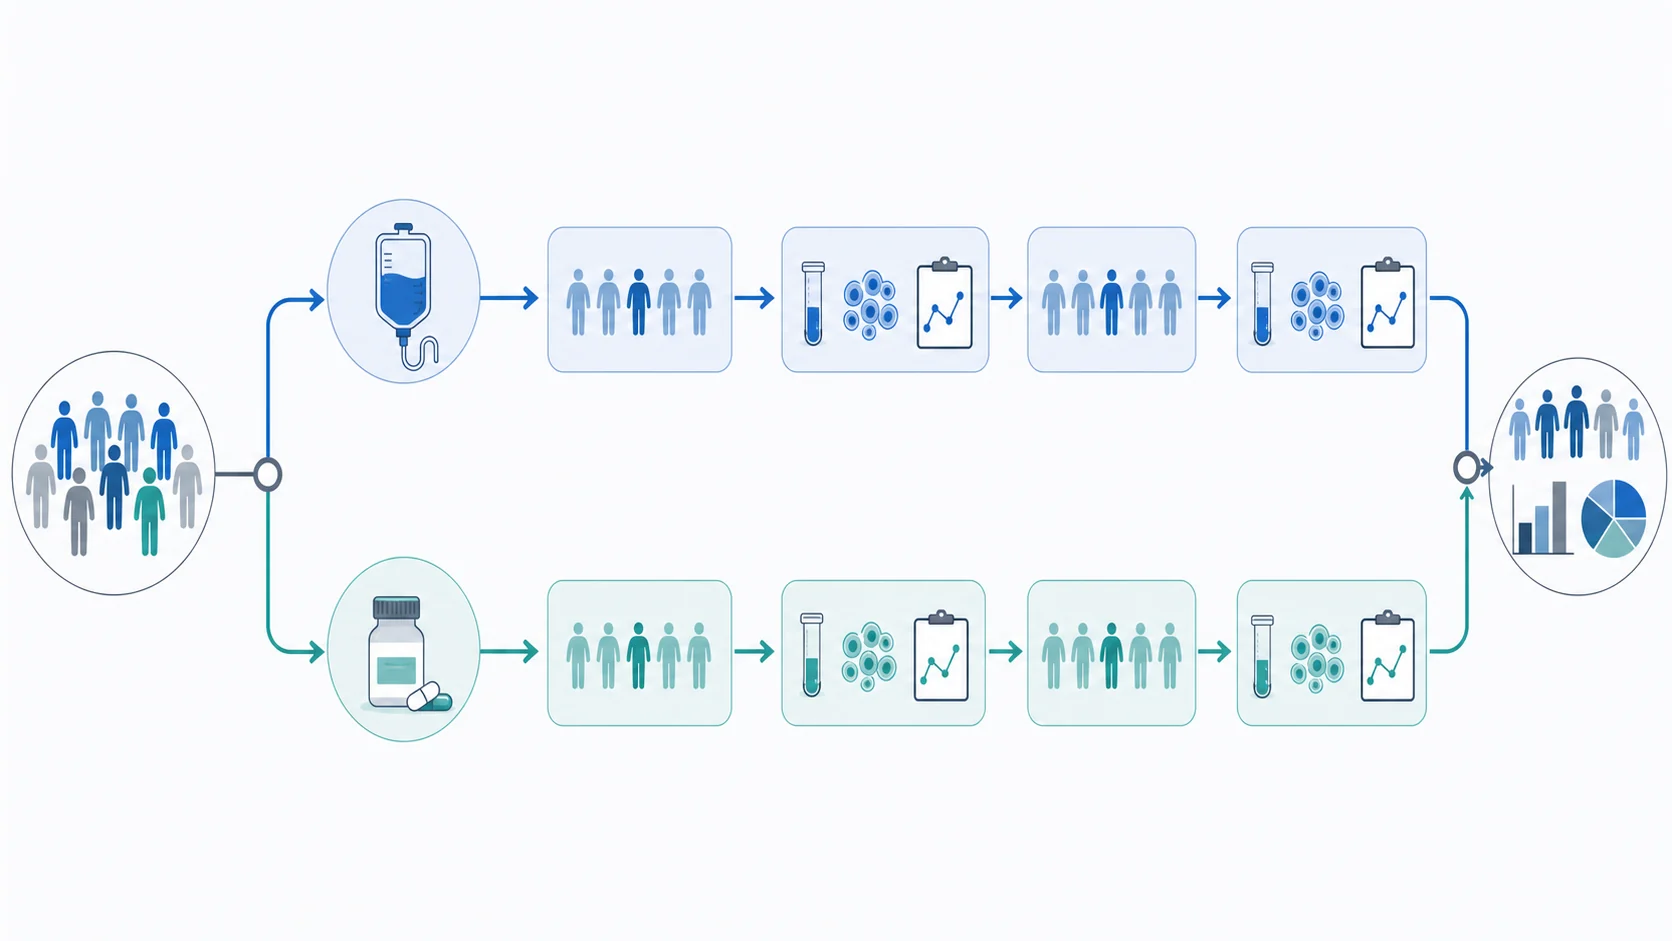
A two-arm parallel-group study drawn as an icon schematic, and a randomized controlled trial laid out from screening and randomization to the final analysis.
Prompt
Create an icon-only experimental design diagram of a two-arm parallel-group study on a white background, with no text anywhere. On the left, a circle of mixed participant figures in blues and greys; a line leads to a small open randomization node that splits into two lanes. Upper lane in blue: an infusion bag icon, then a box of five participant figures, then a box with a blood sample tube, cells and a clipboard chart, then the five figures again and a second identical measurement box. Lower lane in teal: a medicine bottle with tablets, then the same sequence of participants and two measurement boxes. The two lanes rejoin at a node on the right that leads to a circle of participants above a bar chart and a pie chart, standing for the comparison of results.
Icons only (no text)Randomized controlled trialResearch paperIcon schematic
Use this example
Prompt
Create a randomized controlled trial design diagram on a white background titled "Clinical Trial Workflow", with the subtitle "A high-level overview of the key stages in a randomized controlled clinical trial". Across the top, three phase banners: "1. Study initiation & participant selection", "2. Randomization & treatment" and "3. Follow-up & analysis". Below them, from left to right: "Patient Screening"; a diamond "Eligibility Check" asking whether the patient meets all eligibility criteria, with "No" leading down to "Not Eligible: exclude from trial" and "Yes" leading to "Enrollment" (obtain informed consent); then "Randomization", which branches into "Treatment Arm A" and "Treatment Arm B"; both arms lead to "Follow-up Visits", "Outcome Assessment" and "Final Analysis". Along the bottom, a row of five short notes headed Objective, Randomization, Follow-up, Outcome Assessment and Data Analysis. Use simple icons and a blue, teal and red colour scheme.
Randomized controlled trialClinical or animal protocol
Use this example
How to make an experimental design diagram
1
Describe the experiment
Write the question, what you will change and its levels, what you will measure and its unit, what you will keep the same, the groups and their sizes, and the timing. Then pick the design type, the audience, and labeled roles or a variables worksheet.
2
Generate the design
The generator lays out the groups as parallel lanes or a factorial grid, shows random assignment before any treatment, tags the independent, dependent and controlled variables, and adds a timeline when you give one.
3
Check it against your plan and export
Count the groups and the n in each, confirm the control differs only in the treatment, and check the measurement times. For a worksheet, make the answer key from the same result, then download the PNG.
Experimental design key facts
Independent variable
What the researcher deliberately changes
Dependent variable
What is measured, the response
Controlled variables
Kept the same for every group
Control group
Treated the same except for the treatment
Treatments
The levels of the independent variable
Experimental unit
What is randomly assigned to a treatment
Full factorial, k two-level factors
2^k combinations (2 × 2 = 4, 2 × 2 × 2 = 8)
Within-subjects
Every participant gets every condition
Crossover
Sequences AB and BA with a washout between periods
Randomized block
Block what you can, randomize what you cannot
What is an experimental design diagram?
An experimental design diagram is a picture of how an experiment is built. It shows what the researcher changes, what is measured, what is held constant, which groups there are, how subjects end up in each group, how many there are, and when things happen. Teachers call it an experimental diagram or a diagram of an experiment; researchers call it a study design figure or a study schema. The idea is the same: anyone who reads it should see at once what is being compared with what.
It is drawn before the results exist. That is what separates it from a graphical abstract, which summarises a finding, and from a workflow diagram, which lists the steps of a procedure. A good experiment design diagram lets a reader judge whether the experiment is a fair test before looking at a single number.
What every diagram of an experiment should show
The question or hypothesis, in one line at the top.
The independent variable, with each of its levels (the treatments) written on the group that gets it.
The dependent variable, with its unit and when it is measured.
The controlled variables, listed once, because they apply to every group.
The control group, and what it receives instead of the treatment.
How subjects are assigned to groups, and how many are in each.
The timeline, if the timing matters: when treatment starts and when each measurement is taken.
Independent, dependent, and controlled variables, with an example
Take the question "Does the amount of fertilizer affect how tall bean plants grow?". The researcher changes the amount of fertilizer, so that is the independent variable, and its levels, say 0 g, 1 g, 2 g and 4 g per pot, are the treatments. Plant height in centimetres after 21 days is what gets measured, so that is the dependent variable. Pot size, soil, water, light and temperature are kept the same for every plant: those are the controlled variables. Statistics textbooks use the terms explanatory variable and response variable for the same two roles. On the diagram the independent variable belongs where the groups split, and the dependent variable where the measurement is taken.
Control groups: untreated, placebo, vehicle, sham, positive
A control group receives everything the experimental groups receive except the treatment being tested, so any difference can be put down to that treatment. Which kind of control fits depends on the experiment, and the diagram should name it.
Untreated (negative) control: no treatment at all, such as the 0 g fertilizer pots.
Placebo: an inactive look-alike treatment, so participants cannot tell which group they are in.
Vehicle control: the solvent or carrier the drug is dissolved in, without the drug.
Sham control: the procedure without its active step, such as surgery without the lesion.
Positive control: a treatment known to work, which shows the experiment can detect an effect at all.
Random assignment and blinding
Random assignment means chance, not the researcher, decides which unit gets which treatment, so differences between units are spread evenly across the groups instead of piling up in one. On the diagram it is a single branching point that comes before any group is treated. Blinding means the participants, the people giving the treatment or the people measuring the outcome do not know who is in which group; in a double-blind experiment neither the subjects nor the researchers working with them know. If a study is blinded, the diagram can note it beside the random-assignment point.
Replicates and the experimental unit
The experimental unit is the thing that is independently assigned to a treatment: a plant, a pot, a person, a mouse, or a whole cage if the treatment goes in the drinking water. Replication means more than one unit per treatment. Measuring one unit several times gives technical replicates, which make the measurement more precise but do not add units. Treating those repeats as if they were independent units is called pseudoreplication, a problem Hurlbert described in field ecology and that still turns up in lab studies. A design diagram that draws the units clearly, with n per group, makes the problem easy to spot.
Between-subjects vs within-subjects designs
In a between-subjects design each participant is tested in only one condition, so the groups are different people and the diagram shows separate lanes. In a within-subjects design each participant is tested under all conditions, so the diagram shows one group passing through every condition. Within-subjects designs need fewer participants and remove differences between people from the comparison, but earlier conditions can affect later ones: practice, fatigue, or a treatment that has not yet worn off. These are carryover effects, and the usual answer is counterbalancing, which tests different participants in different orders.
Crossover designs and the washout period
A crossover design is a within-subjects design used in trials. After random assignment, one group receives treatment A then treatment B, and the other receives B then A. Between the two treatment periods comes a washout period, long enough for the first treatment to stop acting, so it cannot carry over into the second. The diagram therefore has two sequences, two treatment periods, a washout in the middle, and the same outcome measurement at the end of each period. It suits stable, long-term conditions where the treatment effect wears off; it does not suit treatments that cure.
Factorial designs: main effects and interactions
A factorial design tests two or more independent variables (factors) in one experiment. In a full factorial design every level of every factor appears with every level of every other factor, so two factors with two levels each give four groups, and k two-level factors give 2^k. The natural diagram is a grid with one factor across the top, the other down the side, and a group in each cell. It tells you two kinds of thing: the main effect of each factor on its own, and the interaction, which is whether the effect of one factor depends on the level of the other. With many factors the number of groups grows quickly, which is why fractional factorial designs that run a chosen subset of the combinations exist.
Randomized block designs
When something other than the treatment is known to affect the result, such as the field a plot is in, the batch of reagent, the day of the run or the litter a mouse comes from, the units can be grouped into blocks of similar units. Every treatment is then assigned at random within each block. The comparison of treatments happens inside blocks, so differences between blocks no longer blur it. The principle is often summed up as "block what you can, randomize what you cannot". A block diagram shows the blocks as rows and the randomized treatments inside each.
Pre-test/post-test, dose–response, and time-course designs
Pre-test/post-test: the same measurement before and after the treatment in every group, so each unit is compared with its own baseline. Without a control group, a change could come from time alone.
Dose–response: a zero-dose or vehicle control plus several increasing doses, laid out in order, to show how the response changes with the dose.
Time course: one treatment, sampled at several times. The diagram is a timeline with each sampling point marked and the groups measured at each one.
Experimental design diagram vs experiment flow chart
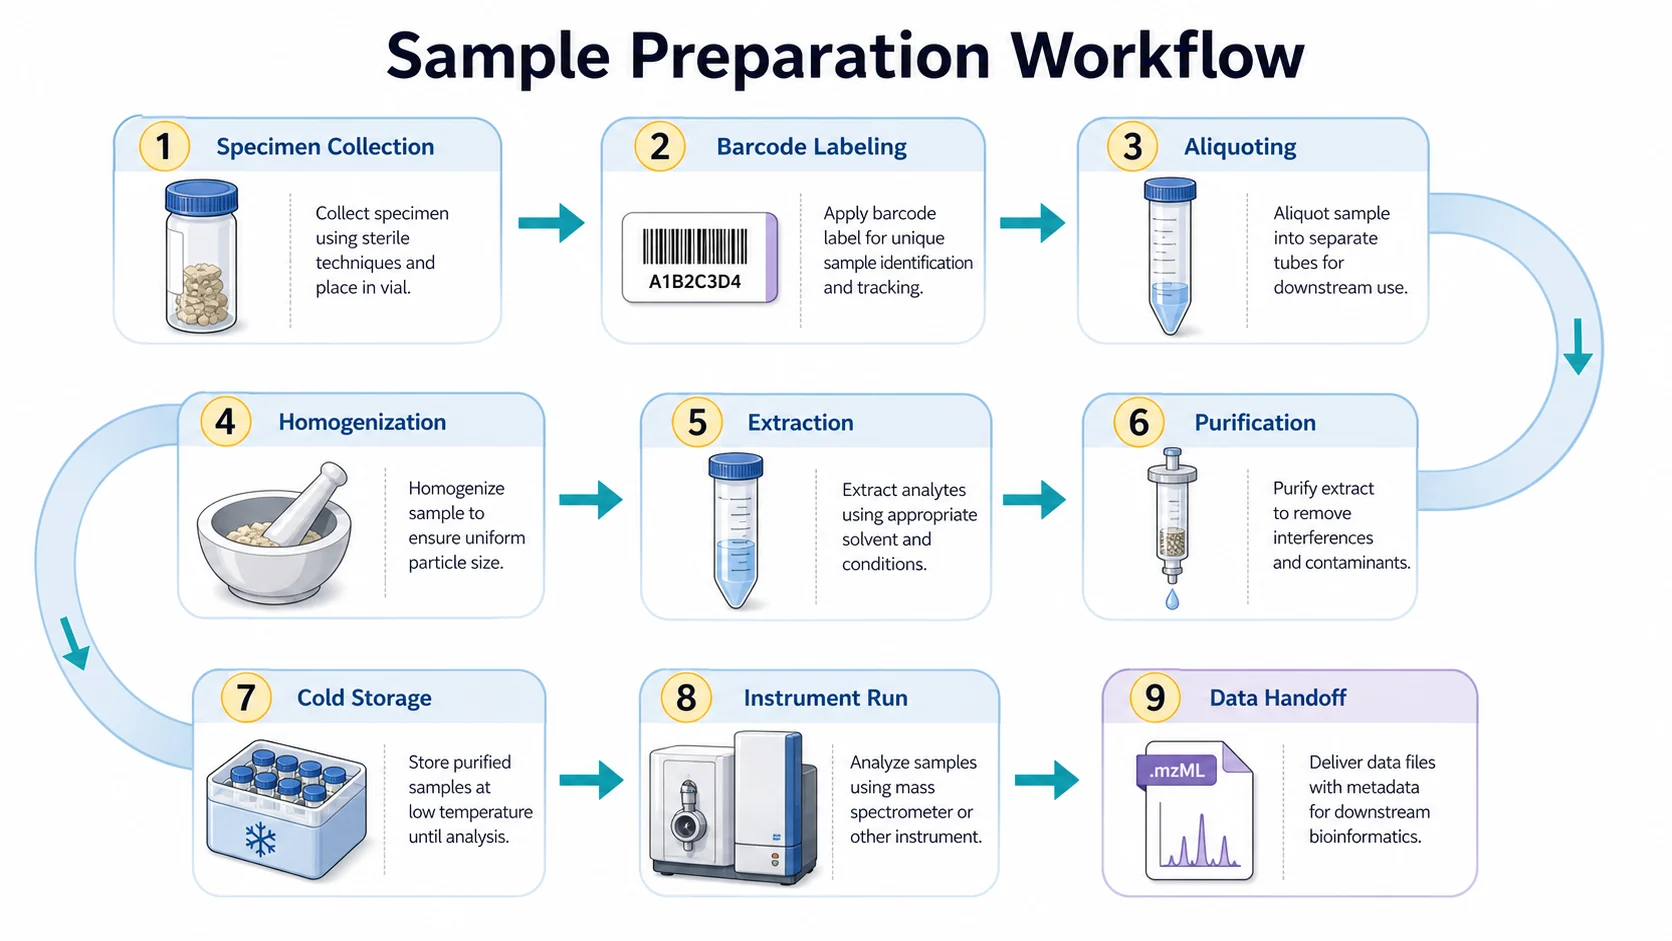
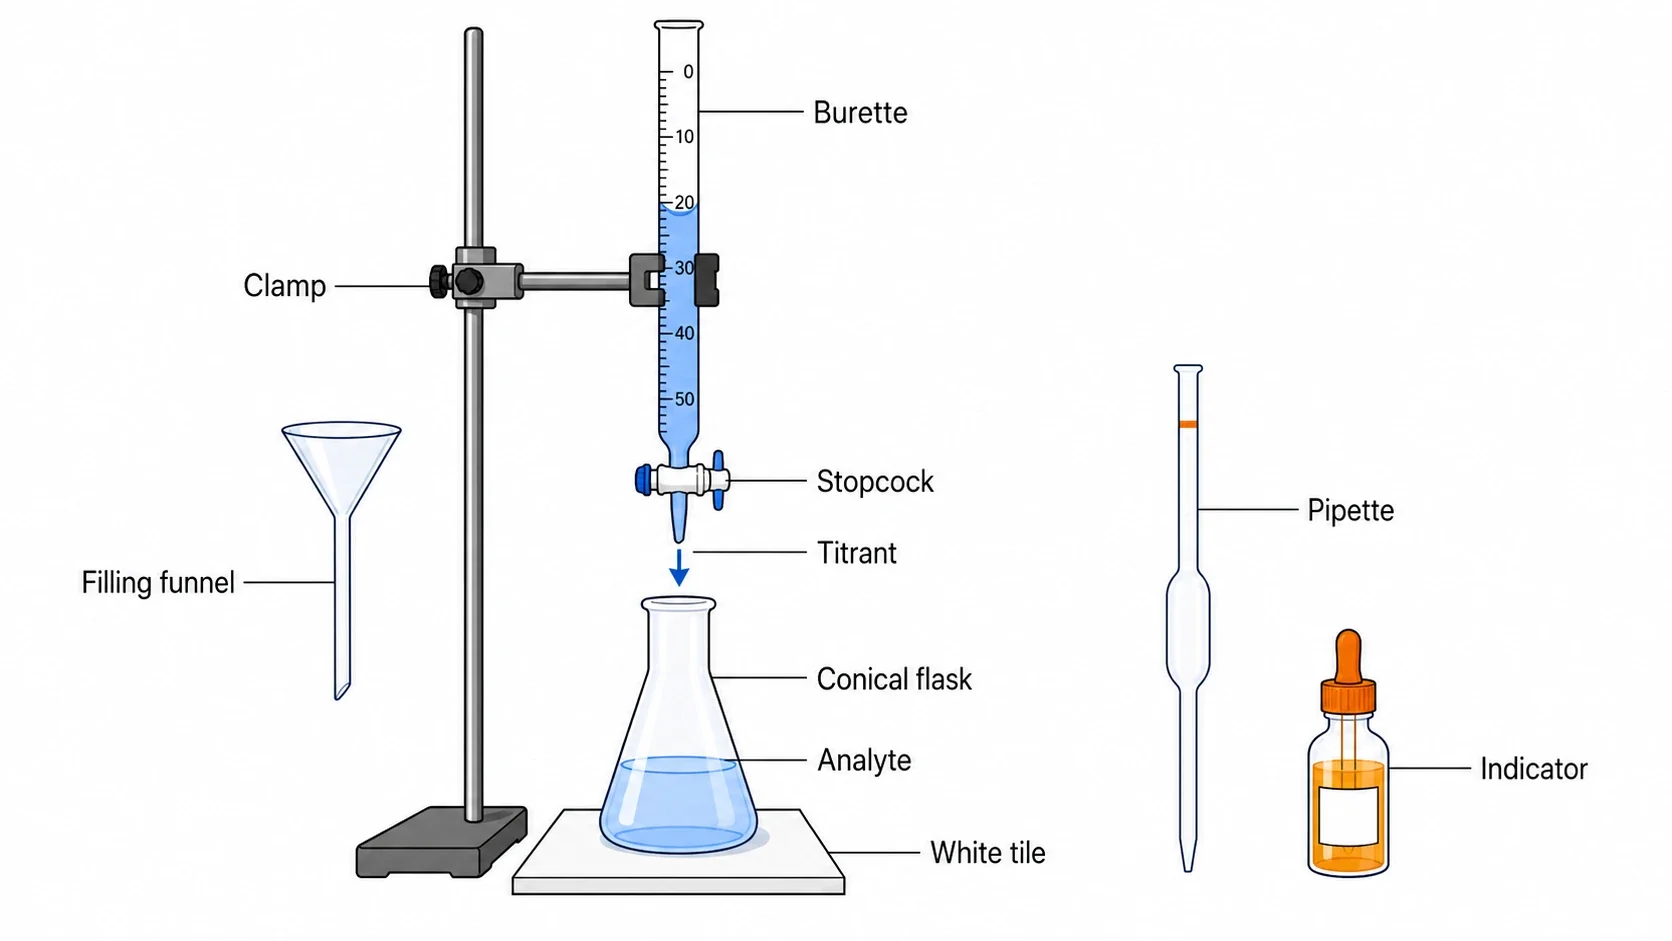
An experiment flow chart, also called an experimental workflow diagram, follows the procedure: collect samples, prepare them, treat them, measure, analyse. An experimental design diagram follows the comparison: which groups exist, how they differ, and what stays the same. In a methods figure the two are often combined, with the groups as parallel lanes and the procedure steps running along each lane against a shared timeline, and this page can draw that. If you only need the procedure, use the workflow diagram generator; for the bench apparatus of a single step, use the lab diagram maker.
School science version vs research paper version
For a science class or a science fair, the diagram is about the vocabulary: the independent, dependent and controlled variables, the control group and repeated trials, in plain words with simple pictures. Choose School science and, for practice, the variables worksheet. For a paper, thesis, grant or protocol, the reader already knows the vocabulary and wants specifics: the experimental unit, n per group, how randomization and blinding were done, doses and timing, and the readouts. Choose Research paper or Protocol and give those details in your description; the generator will not invent them.
How to describe your experiment for the best diagram
Start with the question: "Does X affect Y?"
List the levels of what you change, with units: 0, 10 and 50 µM; light or dark; placebo or drug.
Name what you measure and when: "tumour volume in mm³ on days 0, 7, 14 and 21".
List the controlled variables in one sentence.
Give the group sizes and say whether the groups are randomized and whether anyone is blinded.
Say what the experimental unit is if it is not one subject, such as cages, plots or culture flasks.
Most common mistakes on an experimental design diagram
These errors turn up both in generated diagrams and in students’ own. Each one changes what the experiment can show, so check them before the figure is used.
MistakeCorrect
MistakeThe measured outcome tagged as the independent variable
CorrectThe independent variable is what you change; the dependent variable is what you measure
MistakeThe independent variable listed among the controlled variables
CorrectControlled variables are everything else held the same for every group
MistakeNo control group, or a control that differs in more than the treatment
CorrectA control identical to the treated groups except for the treatment
Mistake"Control group" and "controlled variables" used as if they were the same
CorrectA control group is a set of subjects; controlled variables are conditions
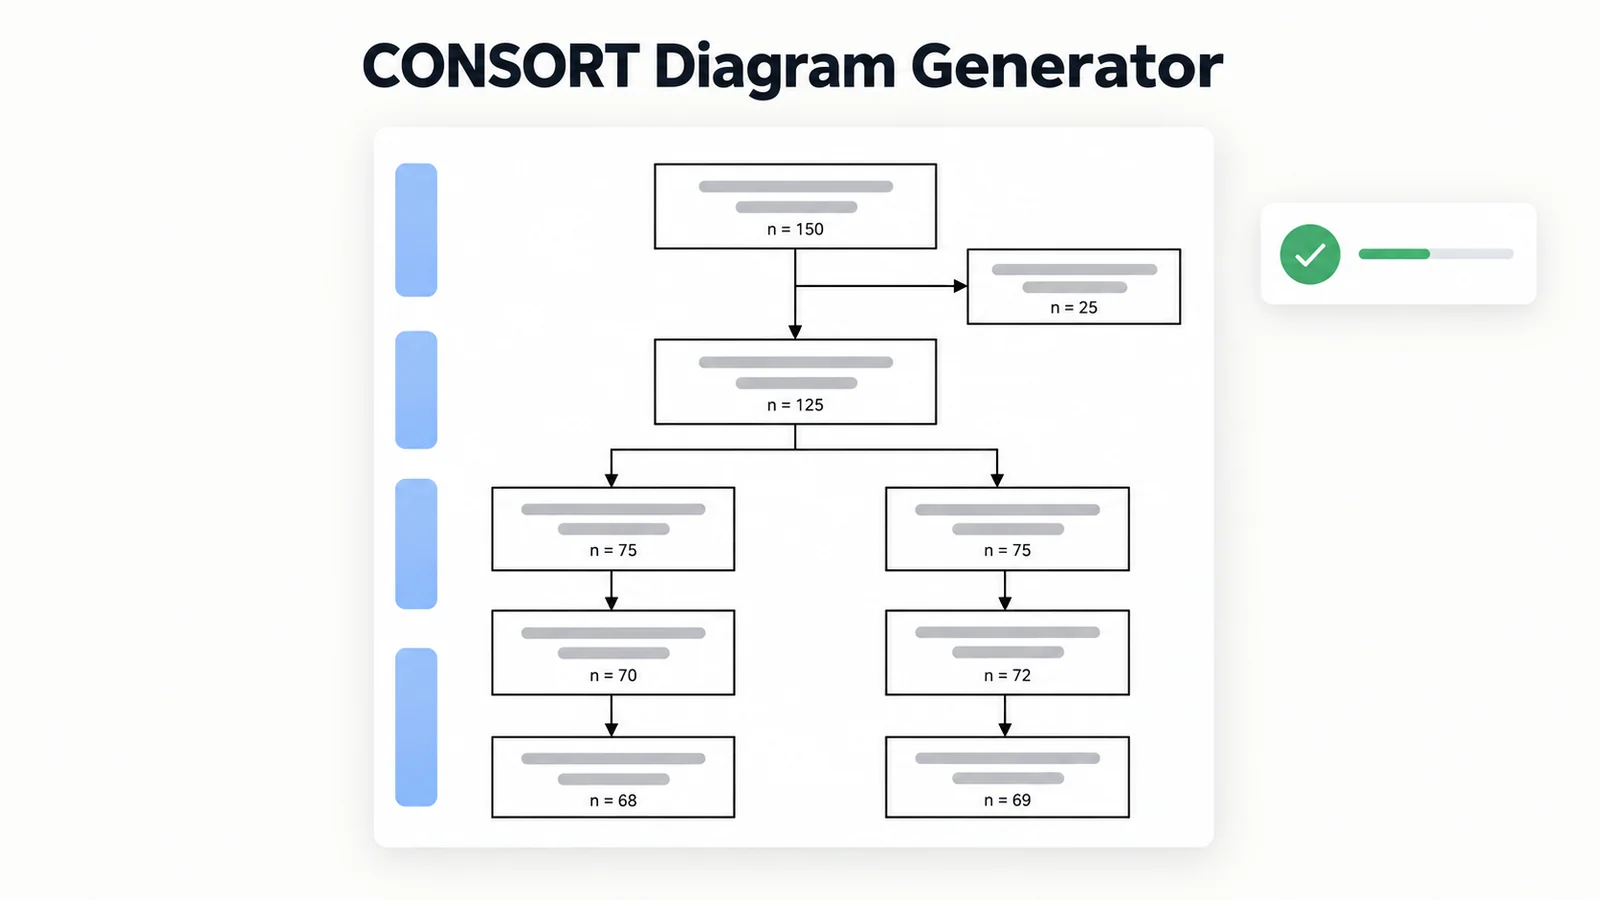
MistakeGroup sizes that do not add up to the sample
Correctn shown per group, and the groups sum to the total
MistakeRepeat readings of one sample drawn as separate groups
CorrectReplicate the experimental unit; technical repeats sit inside it
MistakeRandom assignment drawn after the treatment starts
CorrectUnits are randomized before any group is treated
MistakeA factorial design drawn as a chain of one-factor comparisons
CorrectA grid with one group for every combination of levels
MistakeA crossover with one sequence or no washout
CorrectSequences AB and BA, with a washout between the periods
MistakeResults, p-values or a bar chart on the design figure
CorrectDesign only; results go in their own charts
Experimental design diagram vs workflow diagram, scientific diagram, and graphical abstract
All four can describe the same study, but each answers a different question. Pick the one that matches what the reader needs.
Experimental design diagram (this page)
Workflow diagram
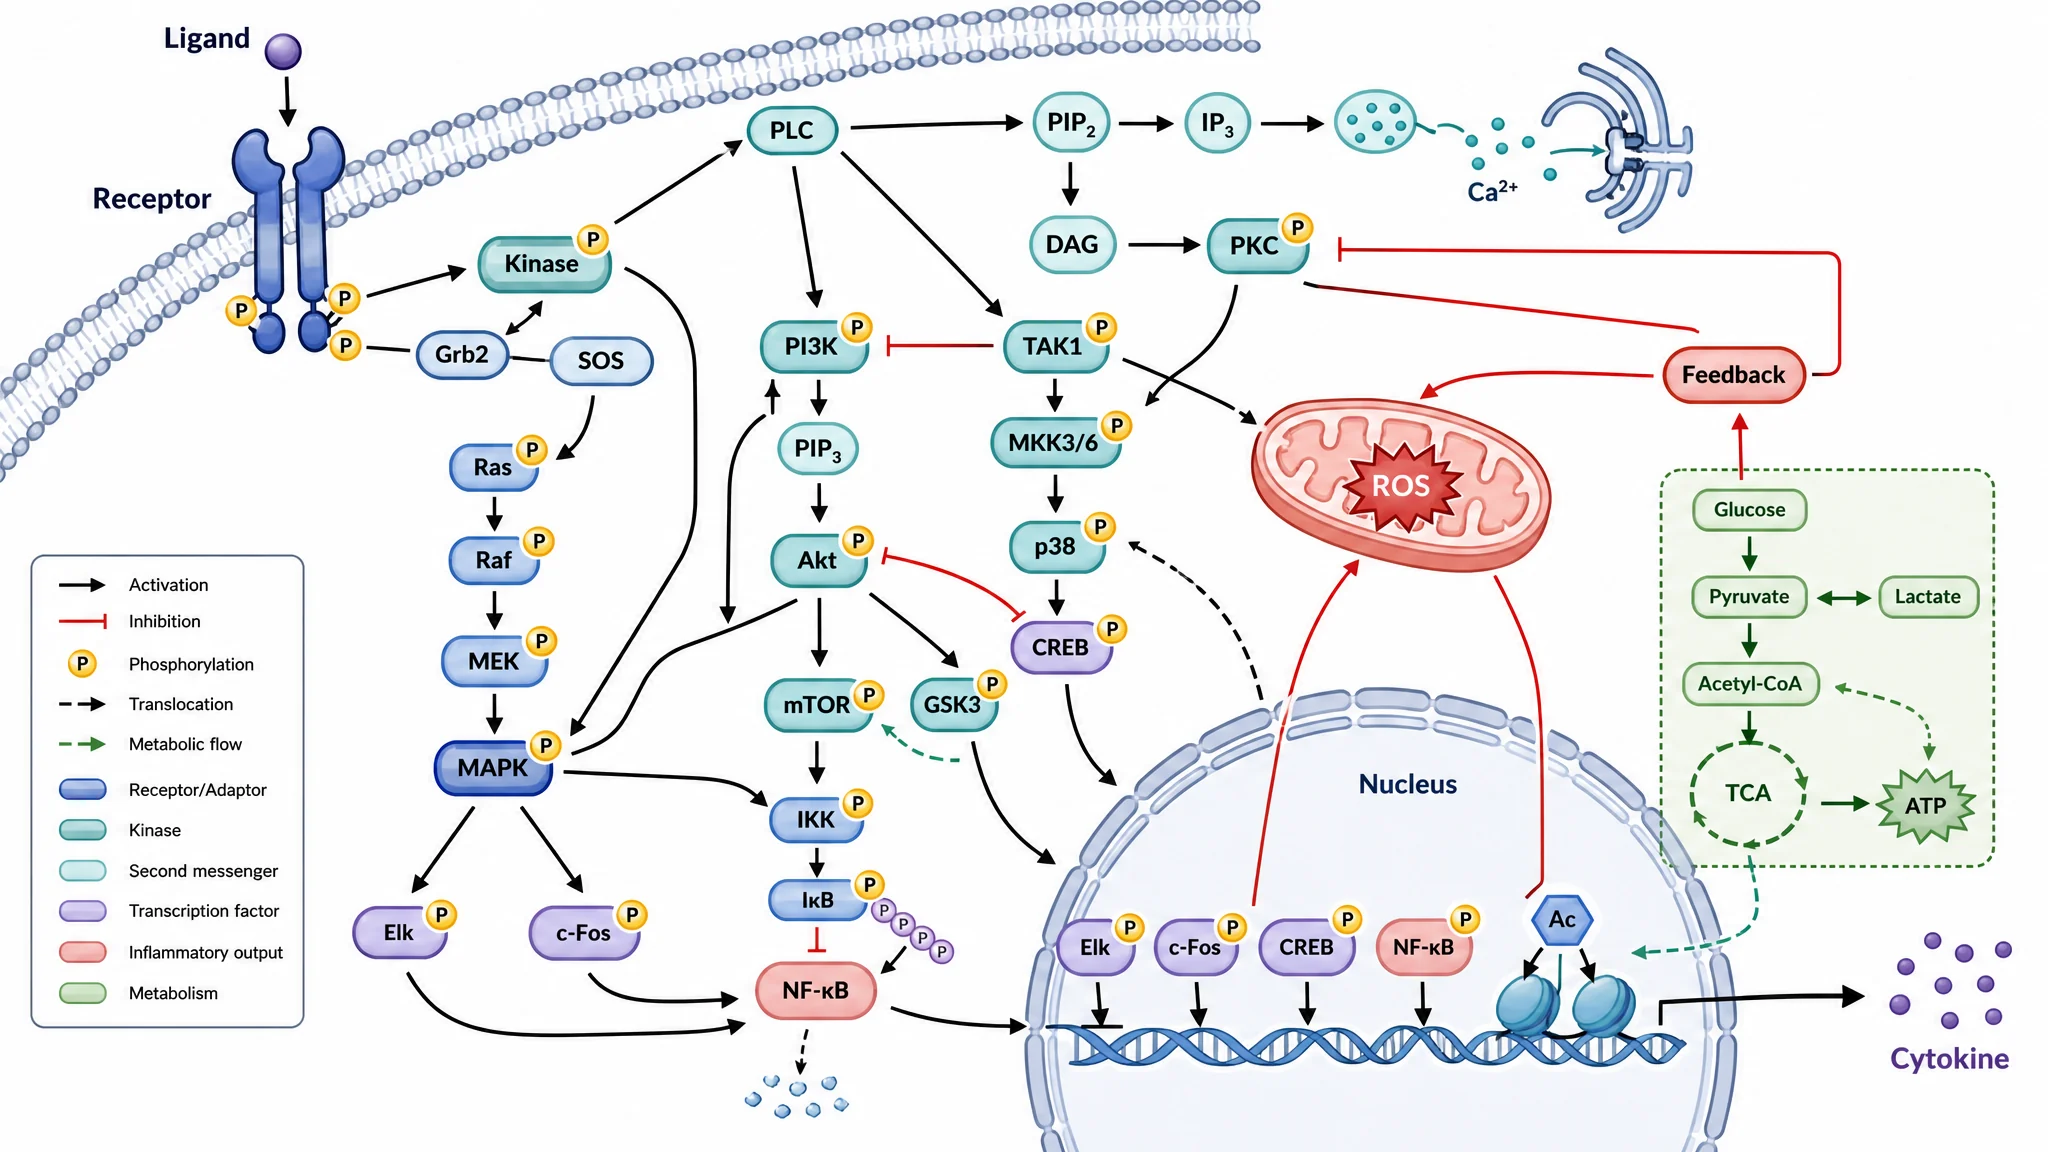
Scientific diagram
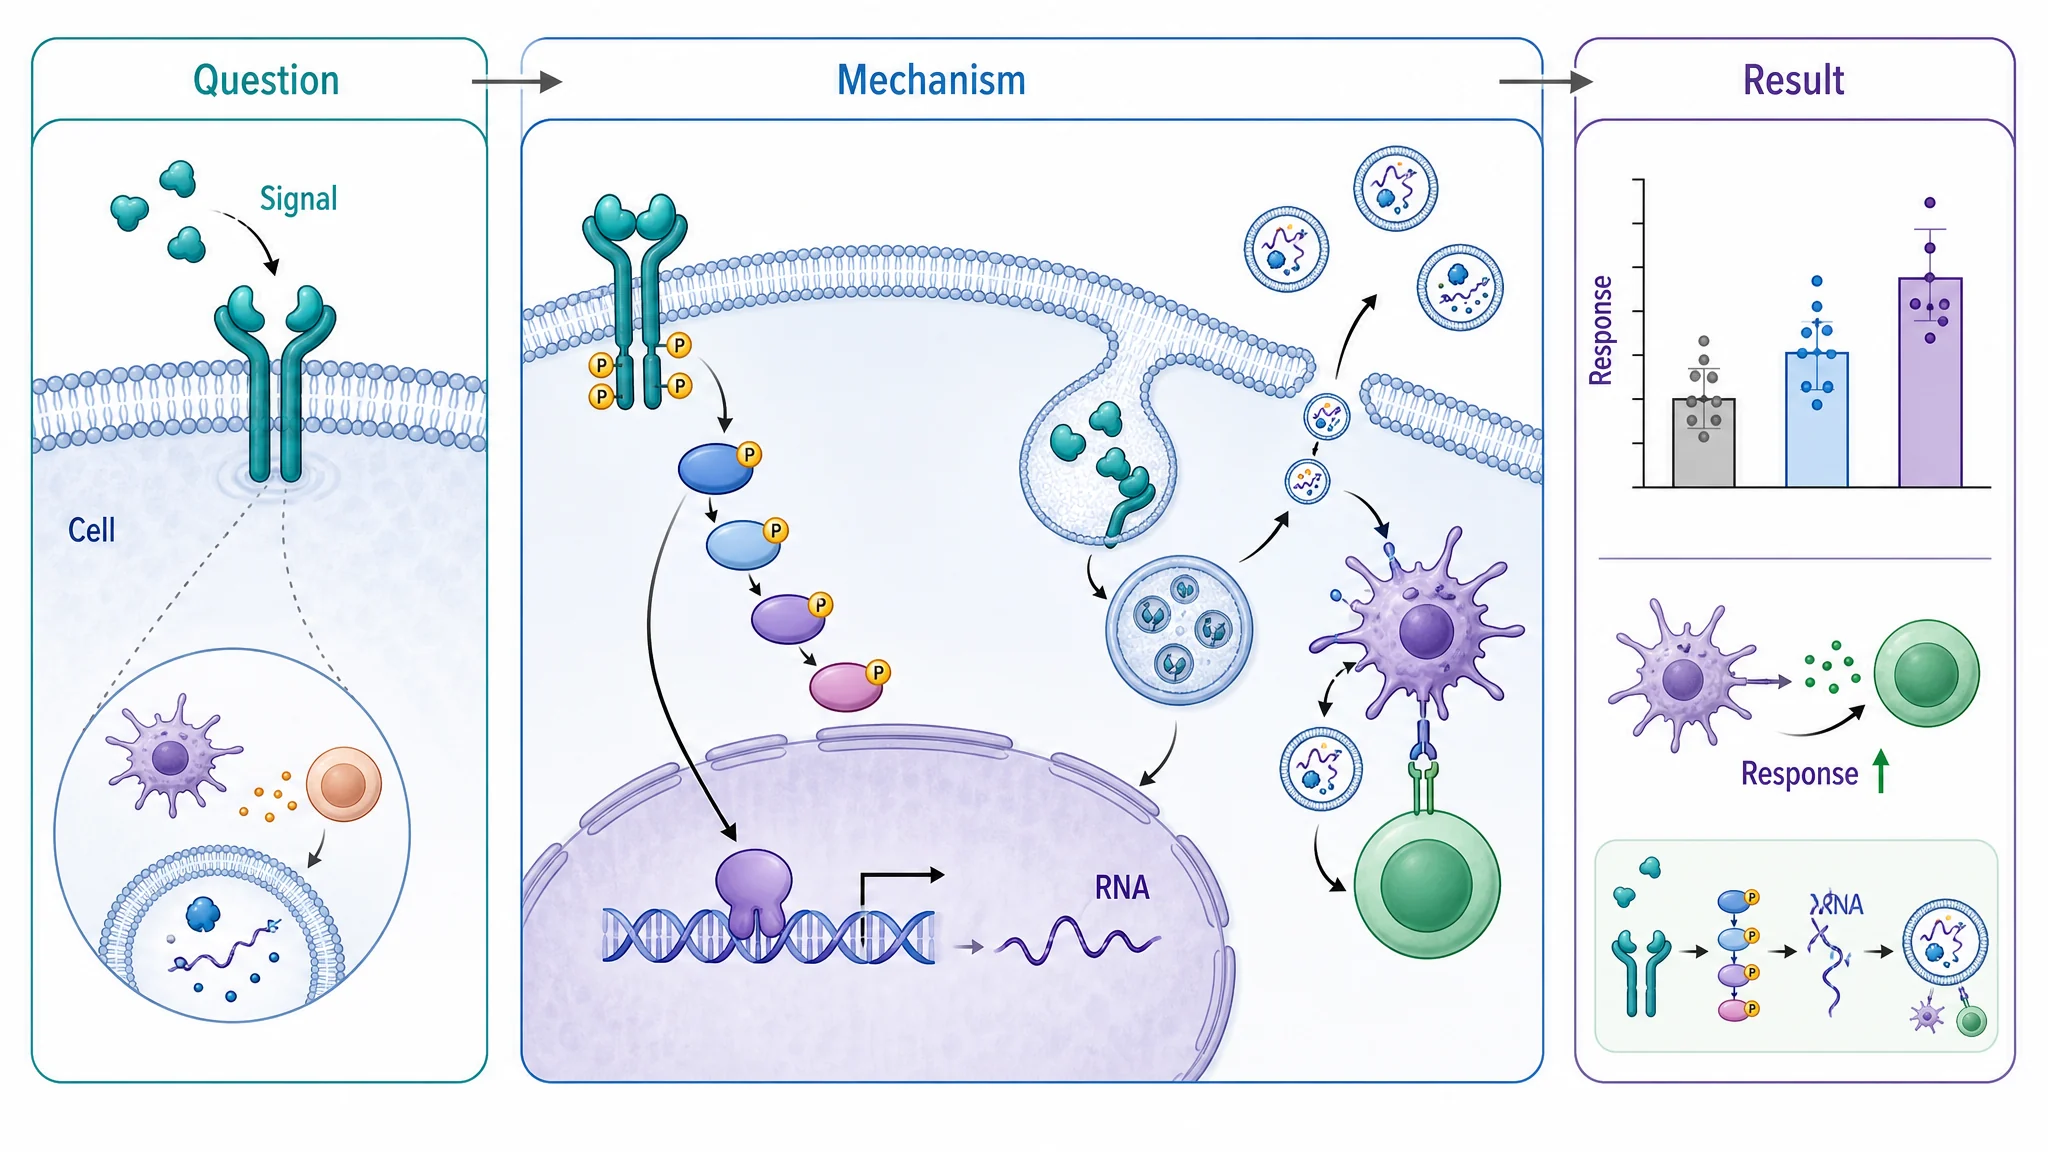
Graphical abstract
Answers
Is this a fair test? What is compared with what?
What happens, in what order?
How does the system or mechanism work?
What did the study find, at a glance?
Shows
Variables, groups, controls, random assignment, replicates, timeline
Steps of a protocol or pipeline, with inputs, outputs and decisions
Structures, mechanisms, cycles and apparatus
The question, approach and main result in one panel
Drawn
Before the results, when the study is planned
Before or after, to document the procedure
Whenever the concept needs explaining
After the results, for the paper
Typical home
Lab reports, science fairs, grant and paper methods figures, protocols
Methods sections, SOPs, supplementary figures
Textbooks, lectures, reviews and papers
The journal table of contents and social posts
Experimental Design Diagram FAQ
It is a figure that shows how an experiment is set up: what is changed, what is measured, what is kept the same, which groups there are, how subjects are assigned to them, how many units each group has, and when the measurements happen. It is drawn before any results exist, so a reader can judge whether the experiment is a fair test. People also call it an experimental diagram, a diagram of an experiment, or an experiment design diagram.
Generate workflow diagrams, lab setup diagrams, graphical abstracts, and variables worksheets with matching answer keys with the same SciFigure AI workflow.