Cellular Respiration AI

Cellular Respiration Diagram Generator

Draw glycolysis, the link reaction, the Krebs cycle, and the electron transport chain in one labeled figure, or compare cellular respiration with photosynthesis side by side.

All four stagesCompare with photosynthesisConcept map or diagram

AI Cellular Respiration Diagram Generator

Describe which stages to show and the format you need.

Costs 5 credits306 / 2000 characters

Generate a publication-ready PNG from your description.

Preview

Cellular Respiration Example Previews

Target aspect ratio: 16:9

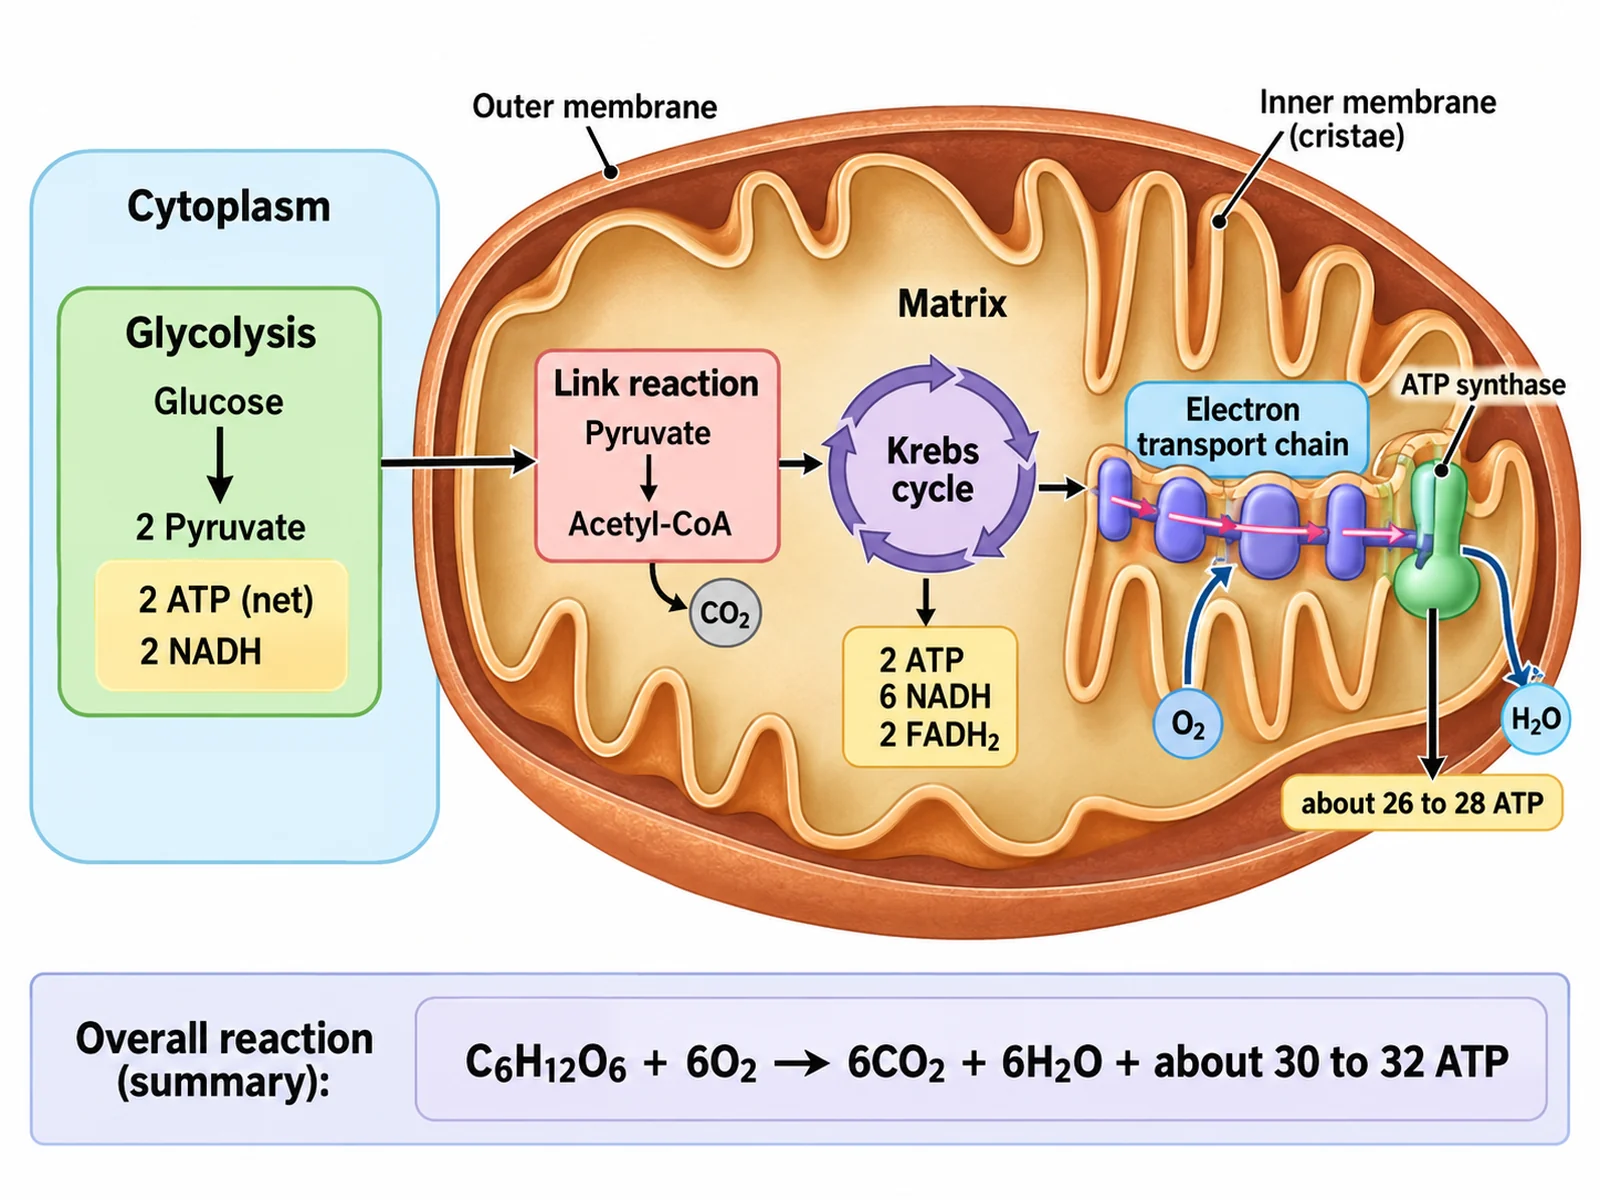
Labeled cellular respiration diagram showing glycolysis in the cytoplasm and the link reaction, Krebs cycle, and electron transport chain inside the mitochondrion
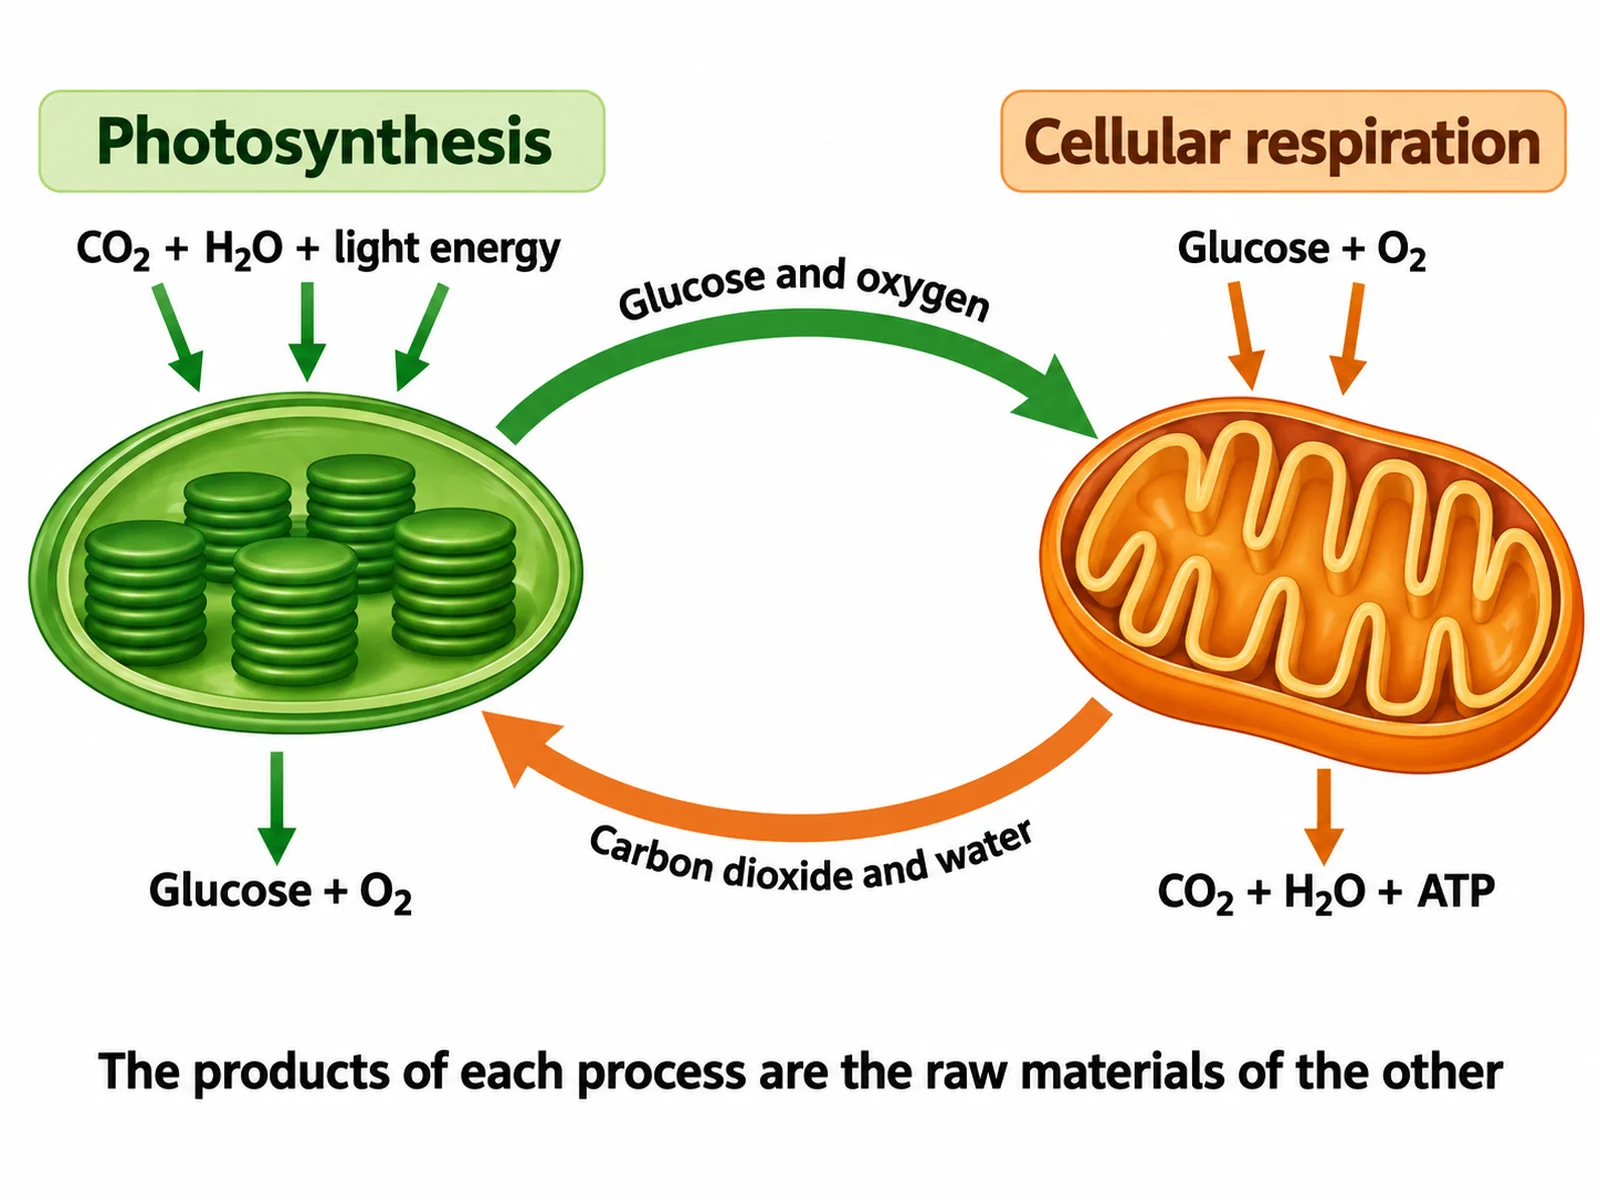
Side-by-side comparison of photosynthesis in the chloroplast and cellular respiration in the mitochondrion, drawn as a closed loop
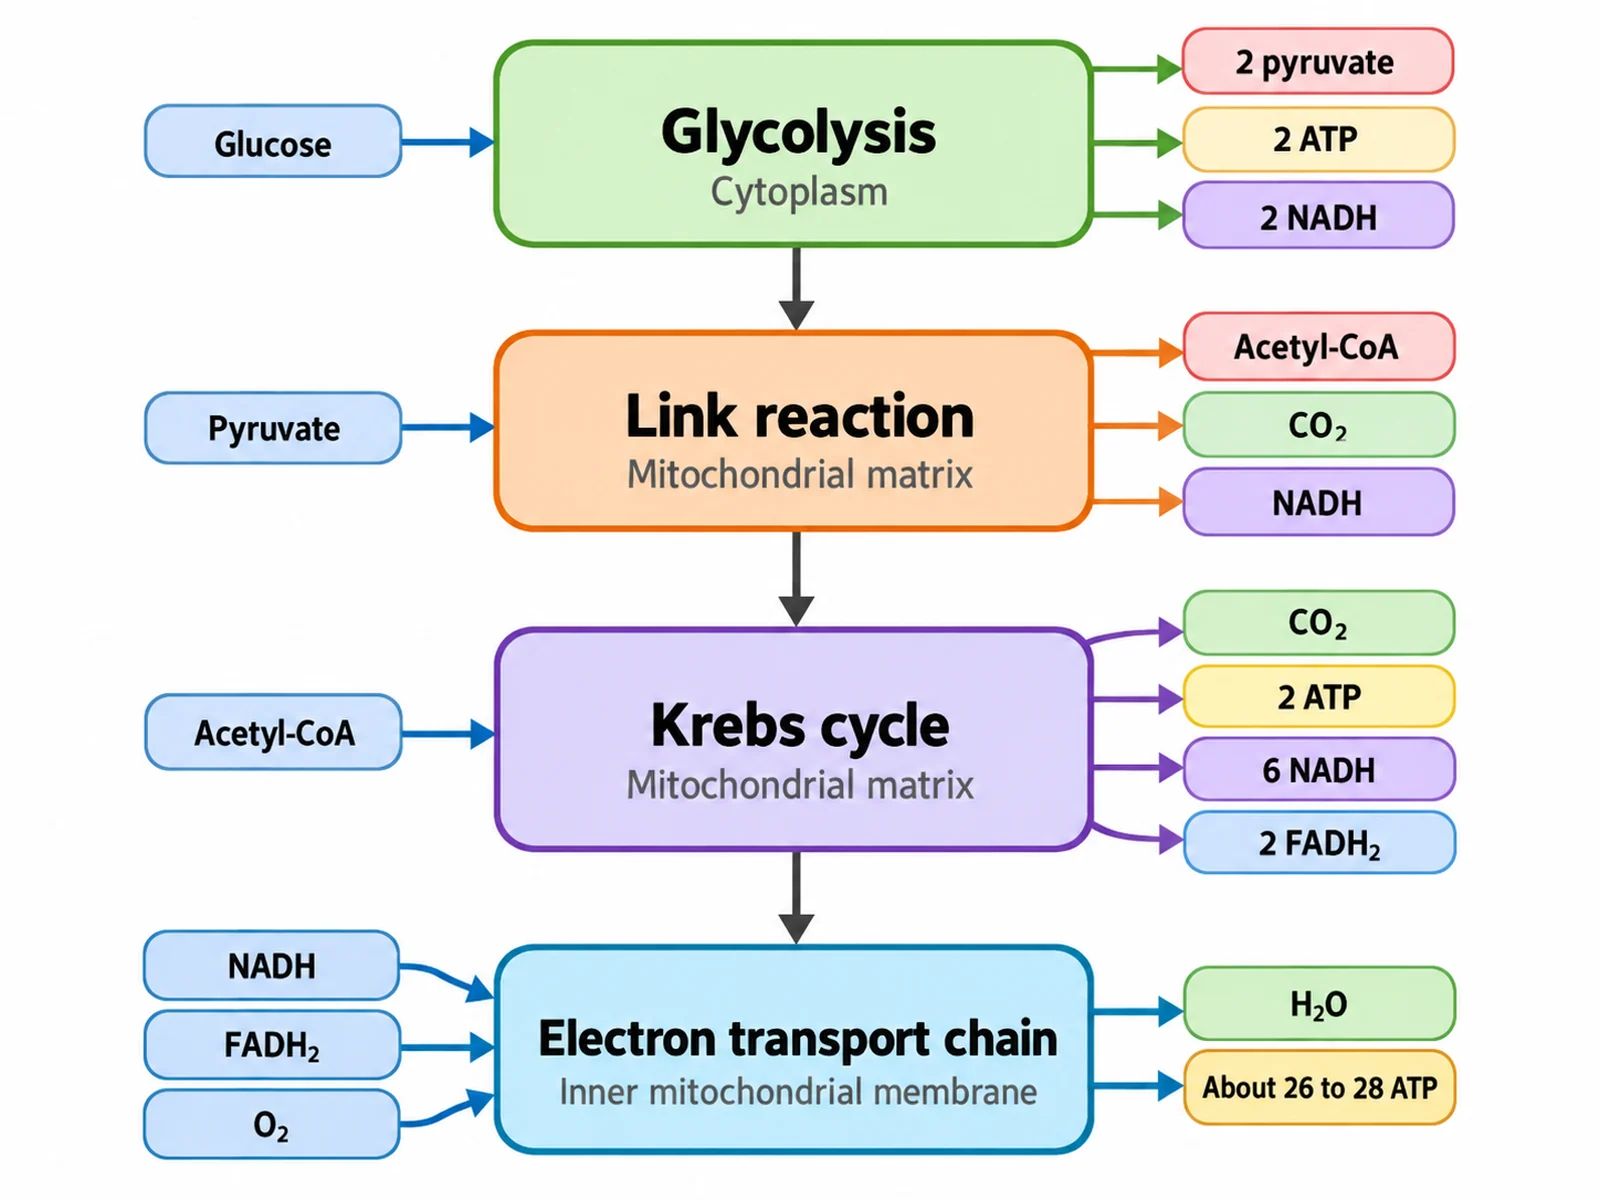
Cellular respiration flow chart with the four stages as boxes and their inputs, outputs, and locations

Sample previews. Describe your diagram to generate your own respiration figure.

Cellular Respiration Diagram Examples

Use these as visual directions for the full labeled pathway, photosynthesis comparisons, flow charts, concept maps, and blank worksheets.

Labeled cellular respiration diagram showing glycolysis in the cytoplasm and the link reaction, Krebs cycle, and electron transport chain inside the mitochondrion

Prompt

Create a fully labeled cellular respiration diagram on a white background. On the left, inside a pale region labeled "Cytoplasm", show "Glycolysis" converting one glucose into two pyruvate with "2 ATP (net)" and "2 NADH" noted beside it. To the right draw a large cut-away mitochondrion with a visible outer membrane and folded inner membrane. Inside the matrix show "Link reaction" turning pyruvate into acetyl-CoA releasing CO2, then a circular "Krebs cycle" releasing CO2 and producing "2 ATP", "6 NADH", "2 FADH2". Along the folded inner membrane show the "Electron transport chain" with ATP synthase, labeled "about 26 to 28 ATP", with O2 entering and H2O leaving. Add a summary strip at the bottom reading "C6H12O6 + 6O2 -> 6CO2 + 6H2O + about 30 to 32 ATP".
Cellular Respiration Overview

Side-by-side comparison of photosynthesis in the chloroplast and cellular respiration in the mitochondrion, drawn as a closed loop

Prompt

Create a side-by-side comparison of photosynthesis and cellular respiration on a white background, arranged as a closed loop. On the left draw a green chloroplast headed "Photosynthesis" with inputs "CO2 + H2O + light energy" and outputs "Glucose + O2". On the right draw an orange mitochondrion headed "Cellular respiration" with inputs "Glucose + O2" and outputs "CO2 + H2O + ATP". Connect them with two thick curved arrows forming a cycle: one from the chloroplast outputs to the mitochondrion inputs labeled "Glucose and oxygen", and one back labeled "Carbon dioxide and water". Add a short caption beneath reading "The products of each process are the raw materials of the other".

Respiration vs Photosynthesis

Cellular respiration flow chart with the four stages as boxes and their inputs, outputs, and locations

Prompt

Create a cellular respiration flow chart on a white background. Draw four rounded boxes in a vertical chain connected by downward arrows: "Glycolysis", "Link reaction", "Krebs cycle", "Electron transport chain". Inside each box print the stage name in bold and its location beneath in smaller grey text: "Cytoplasm", "Mitochondrial matrix", "Mitochondrial matrix", "Inner mitochondrial membrane". To the left of each box list its inputs and to the right its outputs, in small labeled pills: glucose in, 2 pyruvate + 2 ATP + 2 NADH out; pyruvate in, acetyl-CoA + CO2 + NADH out; acetyl-CoA in, CO2 + 2 ATP + 6 NADH + 2 FADH2 out; NADH and FADH2 and O2 in, H2O + about 26 to 28 ATP out.

Respiration Flow Chart

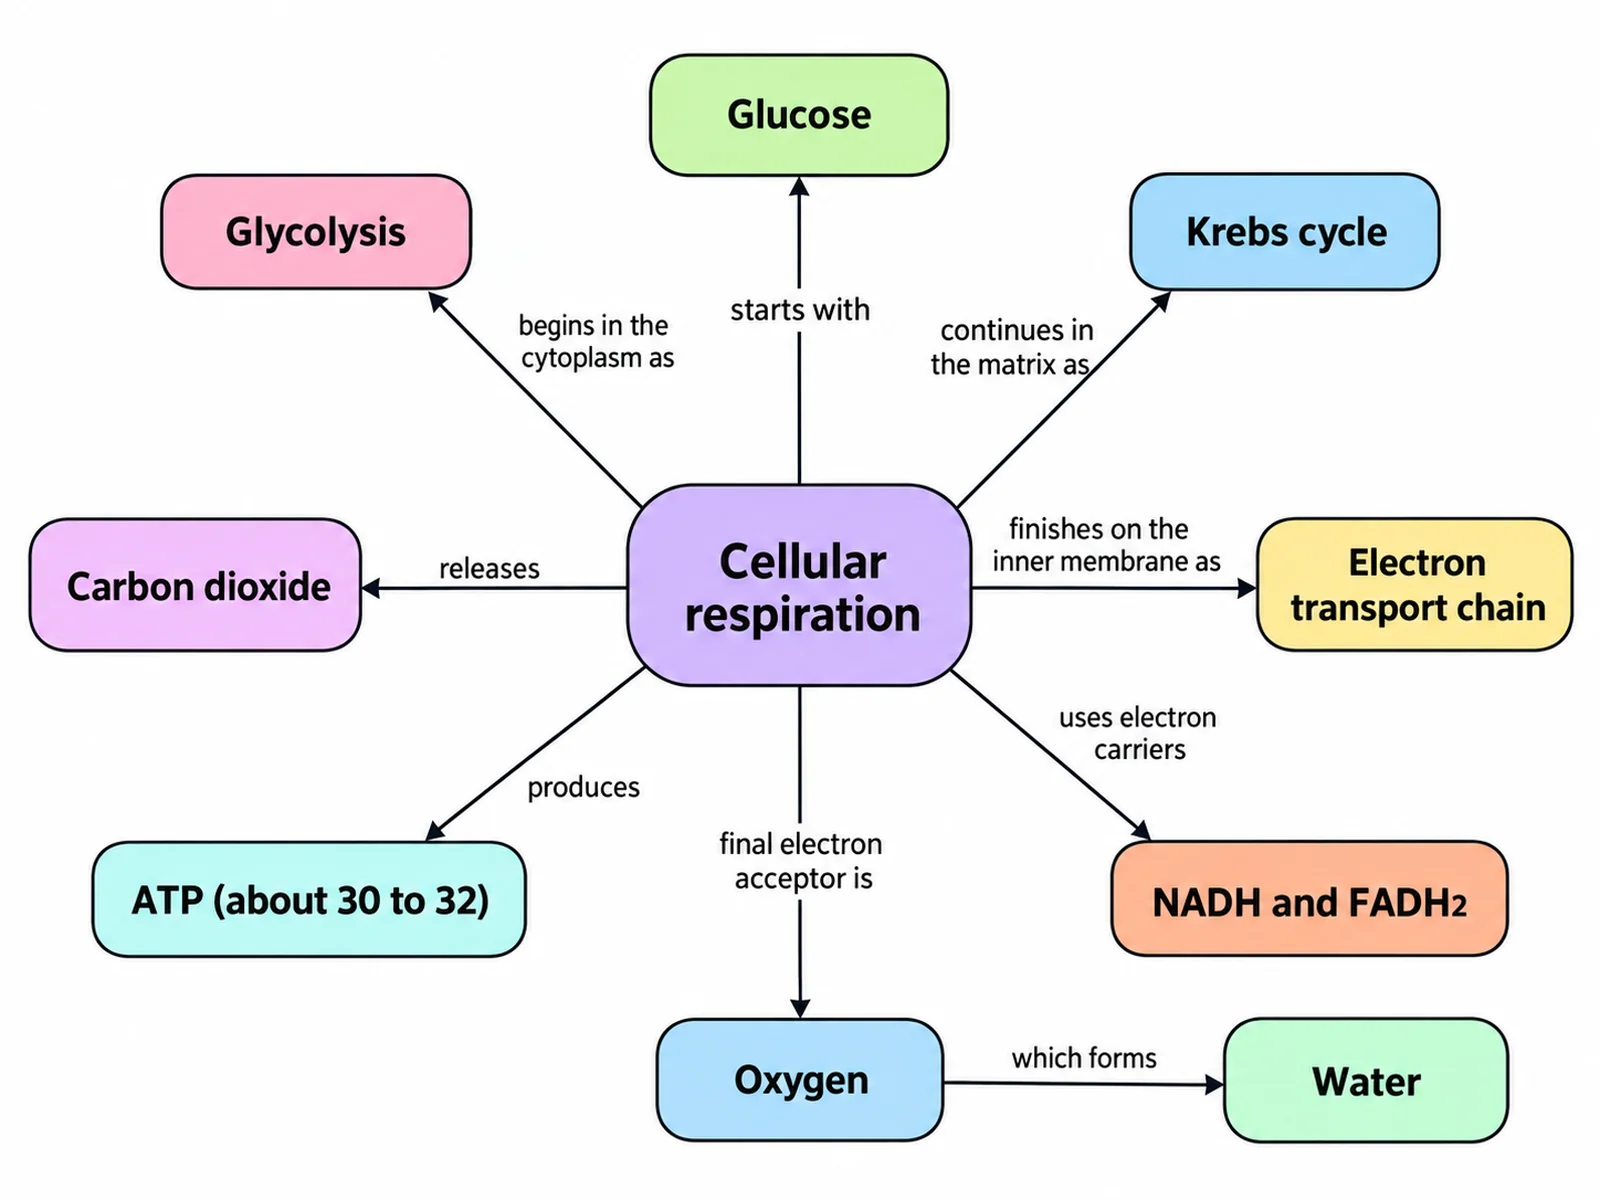
Concept map of cellular respiration linking glucose, the four stages, electron carriers, oxygen, and ATP with labeled connecting phrases

Prompt

Create a cellular respiration concept map on a white background. Put "Cellular respiration" in a central rounded node and branch outward to labeled nodes connected by lines carrying short linking phrases: to "Glucose" via "starts with", to "Glycolysis" via "begins in the cytoplasm as", to "Krebs cycle" via "continues in the matrix as", to "Electron transport chain" via "finishes on the inner membrane as", to "NADH and FADH2" via "uses electron carriers", to "Oxygen" via "final electron acceptor is", to "Water" via "which forms", to "Carbon dioxide" via "releases", and to "ATP (about 30 to 32)" via "produces". Use a distinct pastel fill per node and thin dark connector lines.

Cellular Respiration Concept Map

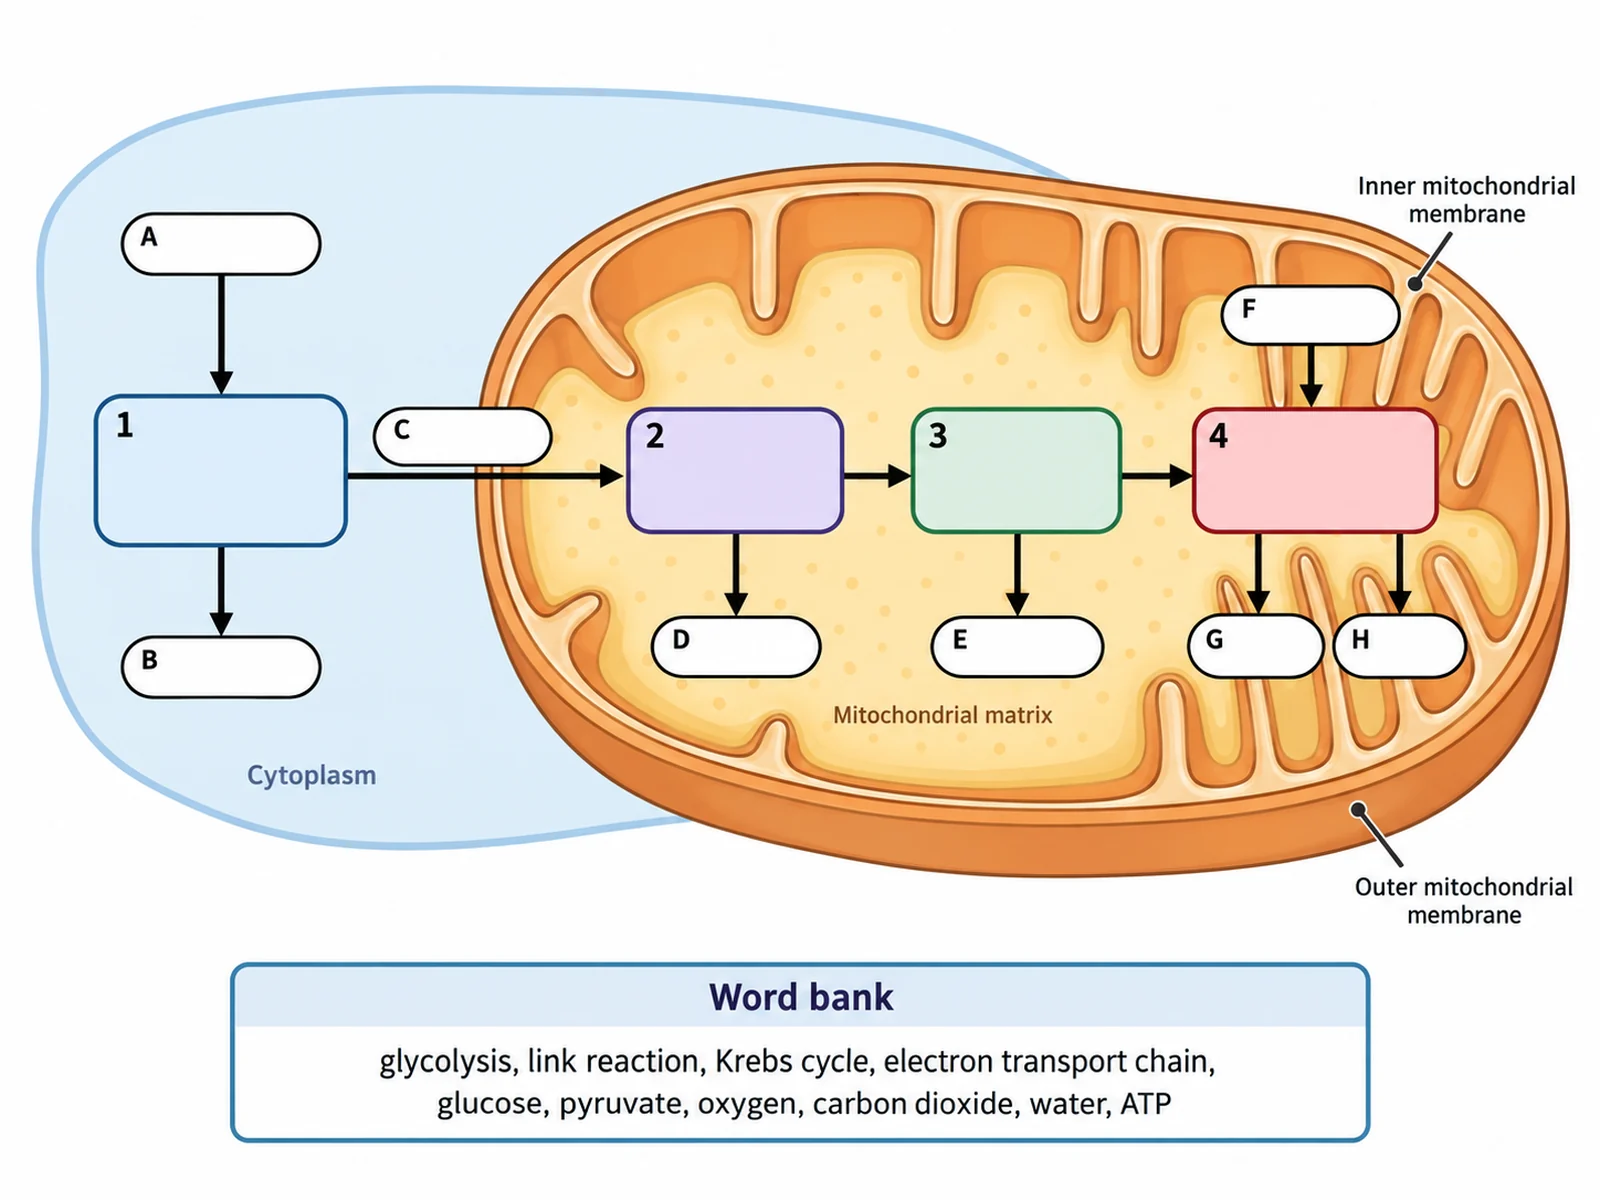
Blank cellular respiration diagram with empty stage boxes and numbered blank lines for students to complete

Prompt

Create a blank cellular respiration worksheet. Draw the cytoplasm region and cut-away mitochondrion in clean line art with soft flat fills and no process text. Leave four empty rounded boxes where glycolysis, the link reaction, the Krebs cycle, and the electron transport chain belong, numbered 1 to 4. Draw the input and output arrows with empty white pills on them, lettered A to H. Add a word bank box below reading "glycolysis, link reaction, Krebs cycle, electron transport chain, glucose, pyruvate, oxygen, carbon dioxide, water, ATP". Generous white space, no answer key.

Blank Respiration Worksheet

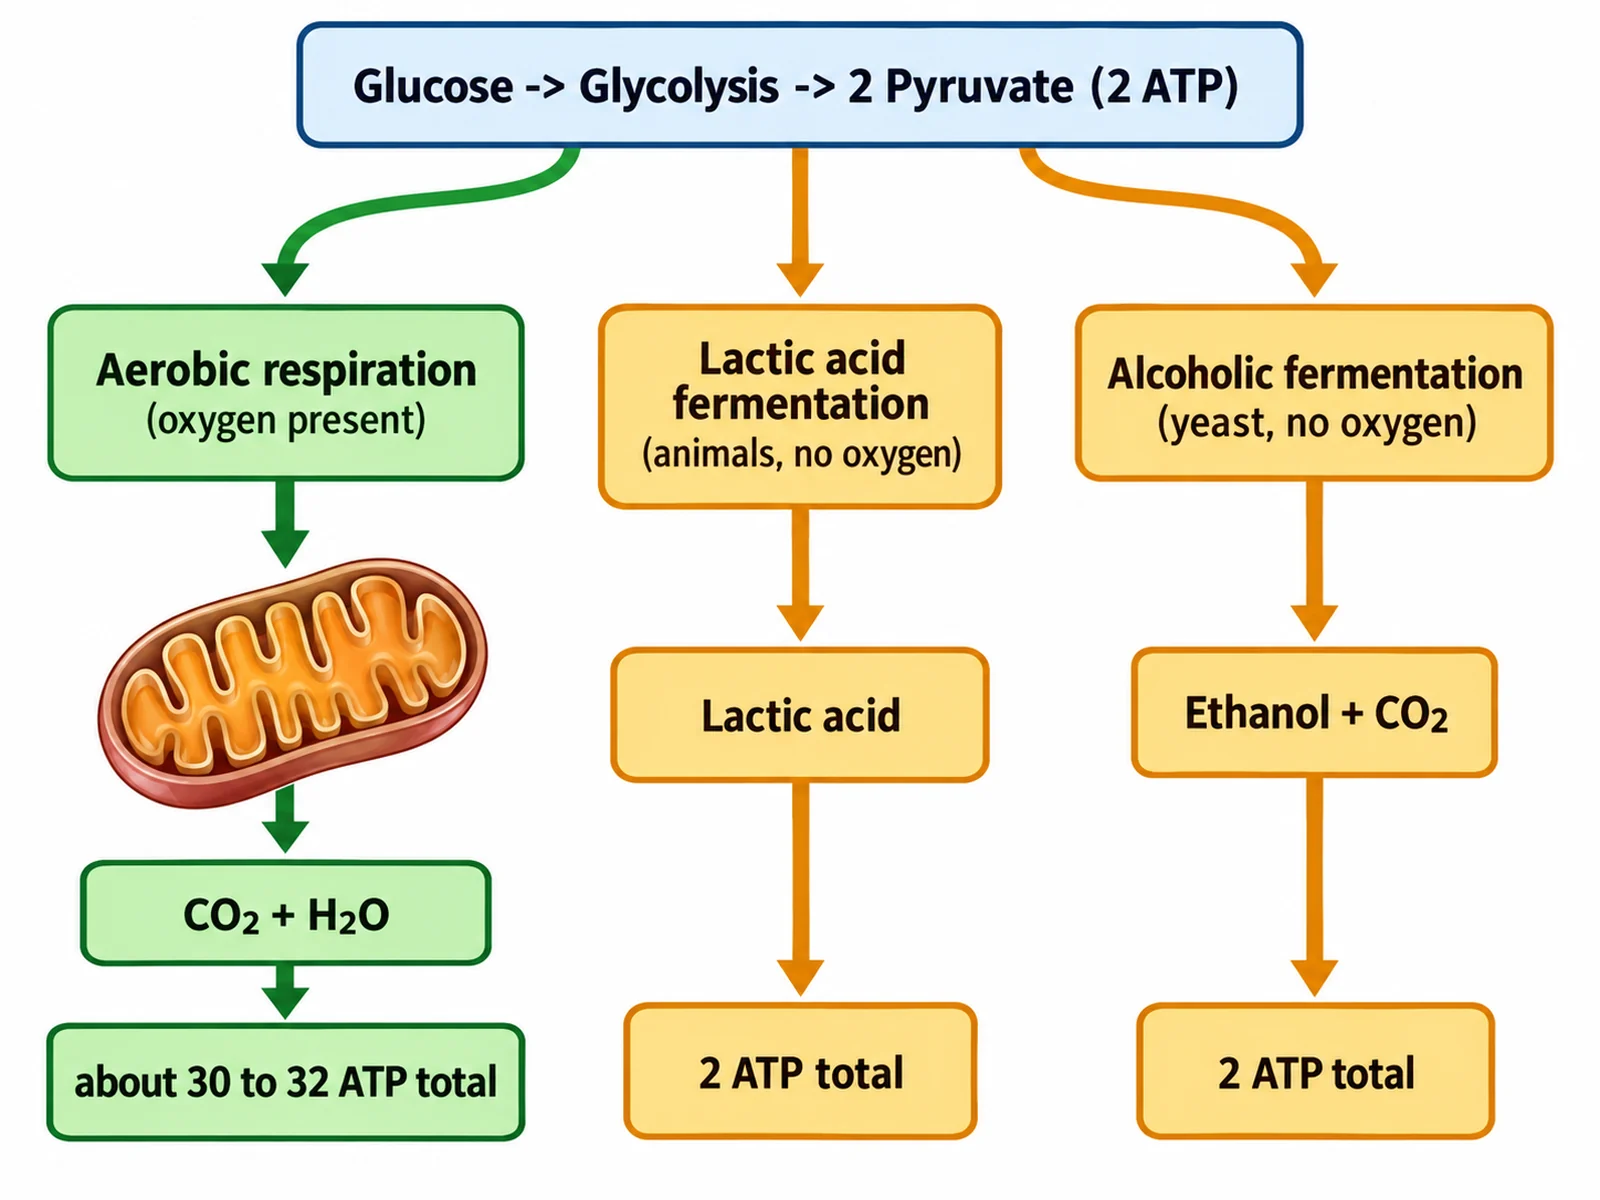
Comparison diagram of aerobic respiration, lactic acid fermentation, and alcoholic fermentation with their products and ATP yields

Prompt

Create a comparison diagram of aerobic and anaerobic respiration on a white background. Start with one shared box at the top reading "Glucose -> Glycolysis -> 2 Pyruvate (2 ATP)". Branch into three labeled paths: left, "Aerobic respiration (oxygen present)" leading to a mitochondrion with "CO2 + H2O" and "about 30 to 32 ATP total"; centre, "Lactic acid fermentation (animals, no oxygen)" leading to "Lactic acid" and "2 ATP total"; right, "Alcoholic fermentation (yeast, no oxygen)" leading to "Ethanol + CO2" and "2 ATP total". Colour the aerobic path green and the two anaerobic paths amber.

Aerobic vs Anaerobic

How to draw a cellular respiration diagram

1

Choose the format

An anatomical mitochondrion view for the full pathway, a flow chart for revision, a concept map for linking ideas, or a photosynthesis comparison loop.

2

Generate the diagram

The generator keeps glycolysis in the cytoplasm and the later stages in the correct mitochondrial compartments.

3

Check the locations and numbers, then export

Confirm glycolysis is outside the mitochondrion and the ATP figures are current, then download the PNG for a worksheet, slide, or revision sheet.

What is a cellular respiration diagram?

A cellular respiration diagram shows how a cell breaks glucose down into carbon dioxide and water while capturing the released energy as ATP. Because the process spans two compartments — the cytoplasm and the mitochondrion — the diagram usually draws both, so the location of each stage is as much a part of the answer as the stage itself.

The four stages and where each one happens

  • Glycolysis (cytoplasm): splits one glucose into two pyruvate, yielding a net 2 ATP and 2 NADH. No oxygen required.
  • Link reaction (mitochondrial matrix): converts each pyruvate into acetyl-CoA, releasing CO2 and reducing NAD+.
  • Krebs cycle (mitochondrial matrix): oxidises acetyl-CoA fully to CO2, producing 2 ATP, 6 NADH, and 2 FADH2 per glucose.
  • Electron transport chain (inner mitochondrial membrane): NADH and FADH2 donate electrons, driving proton pumping and ATP synthase; oxygen is the final electron acceptor and forms water. Yields about 26 to 28 ATP.

Respiration and photosynthesis compared

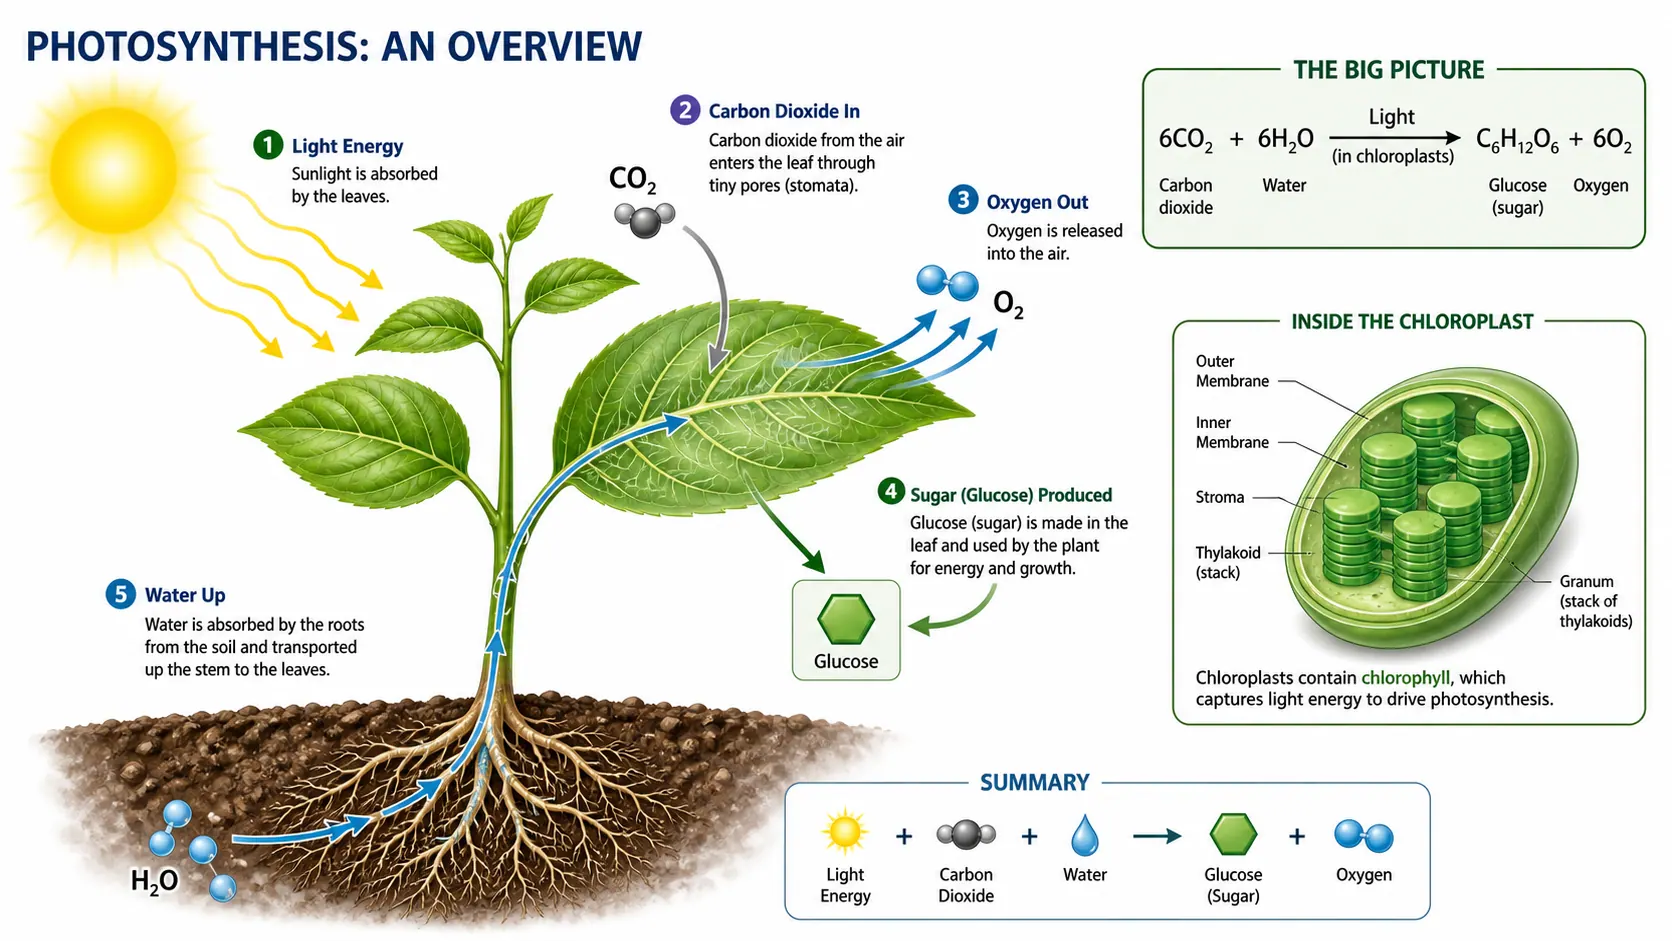
  • Location: respiration in the mitochondrion of all eukaryotes; photosynthesis in the chloroplast of plants and algae only.
  • Inputs: respiration takes glucose and oxygen; photosynthesis takes carbon dioxide, water, and light.
  • Outputs: respiration releases CO2, water, and ATP; photosynthesis produces glucose and oxygen.
  • Energy: respiration releases stored chemical energy; photosynthesis stores light energy as chemical energy.
  • Timing: respiration runs continuously in plants and animals; photosynthesis requires light.

Cellular Respiration Diagram FAQ

Glycolysis in the cytoplasm splits one glucose into two pyruvate molecules and yields a small amount of ATP and NADH. The link reaction converts pyruvate into acetyl-CoA in the mitochondrial matrix. The Krebs (citric acid) cycle, also in the matrix, releases CO2 and loads NADH and FADH2. The electron transport chain on the inner mitochondrial membrane uses those carriers to drive oxidative phosphorylation, producing most of the ATP and forming water with oxygen.

Need other biology figures?

Generate metabolic pathways, cell diagrams, photosynthesis figures, and worksheet-ready illustrations with the same SciFigure AI workflow.