Blended family, three generations
Family therapy
A divorce and two new partnerships, a teenage index person, a cut-off, a conflicted mother–daughter bond and two households.
Free genogram maker
Build the family the way you would on paper, one person at a time, and the genogram lays itself out: generations line up, children sit in birth order under their parents, and nothing overlaps. Mark marriages, separations, divorces and partners who live together; add ages, birth and death years, substance misuse and illness; draw close, distant, conflicted and cut-off relationships; and outline who lives in each household. Switch to anthropology’s kinship chart notation with one click, print a blank worksheet, and export SVG, PNG or PDF. Free, and nothing leaves your browser.
Everything runs in your browser: nothing is uploaded, and the genogram is kept on this device only. Use initials or pseudonyms for client work. Undo with Ctrl+Z.
Templates
Each family is invented. Open one to change any detail, or print it as a worksheet with the names, ages and years left blank.
Blended family, three generations
A divorce and two new partnerships, a teenage index person, a cut-off, a conflicted mother–daughter bond and two households.
Kinship care with a grandmother
Two children in their grandmother’s care, a parent with substance misuse, a separated couple, a foster child and the support around them.
Family health assessment
An older man with heart failure, his late wife, a daughter who is his main carer, a distant son and the grandchildren.
Cancer family history
Three generations with breast, ovarian and colorectal cancer, ages at diagnosis and death, and the person seeking counselling.
For students
Parents who married and later separated, identical twins, an adopted son and a pregnancy, to practise the core symbols.
Worksheet starter
Grandparents on both sides, parents, the index person and a sibling, with no names: fill it in by hand or in the editor.
The symbols this genogram maker draws, following the McGoldrick, Gerson and Petry format. Details vary between textbooks and agencies, so every exported genogram carries its own key.
| Symbol | Name | Meaning |
|---|---|---|
| Male | A male. In a kinship chart, a triangle. | |
| Female | A female. | |
| Sex not specified | Sex not specified or not known (a pet or other member is often drawn the same way). | |
| Index person | The client, patient or person the genogram is about. | |
| Deceased (age at death inside) | An X through the symbol; the age inside is the age at death. | |
| Birth year left, death year right | Years above the symbol: birth on the left, death on the right. | |
| Pregnancy | A current pregnancy. | |
| Stillbirth | A stillbirth: a small symbol with an X. | |
| Marriage (m. year) | A solid line joining the couple, with the year of marriage. | |
| Living together (LT year) | A dashed line: partners living together, not married (LT and the year). | |
| Couple, not living together | A dotted line: a couple who do not live together. | |
| Separated (s. year) | One slash across the couple line, with the year (s.). | |
| Divorced (d. year) | Two slashes across the couple line, with the year (d.). | |
| Adopted child (dashed line) | A dashed line of descent: an adopted child. | |
| Foster child (dotted line) | A dotted line of descent: a foster child. | |
| Alcohol or drug misuse | Left half shaded: alcohol or drug misuse. | |
| Suspected misuse | Left half hatched: misuse suspected, not confirmed. | |
| In recovery from misuse | Left half lightly shaded: in recovery. | |
| Serious physical or mental illness | Bottom half shaded: serious physical or mental illness. | |
| Illness in remission | Bottom half lightly shaded: illness in remission. | |
| Close | Two lines: a close, supportive relationship. | |
| Fused (very close) | Three lines: very close, enmeshed. | |
| Distant | A dotted line: little contact. | |
| Hostile / conflict | A zigzag: ongoing conflict or hostility. | |
| Close but hostile | Close, with recurring conflict. | |
| Fused and hostile | Enmeshed and conflicted. | |
| Cut off | Contact has ended. | |
| Focused on (arrow points at the person) | One-sided attention, worry or pressure. | |
| Abuse (arrow points at the person) | Abuse; note the type in the person’s note. | |
| Household (lives together) | A dashed outline around the people who live together. |
| Genogram | Pedigree chart | Family tree | Kinship chart | |
|---|---|---|---|---|
| Main purpose | Family relationships and patterns | Inheritance of a trait or disease | Ancestry and descent | Kin relations and kin terms |
| Used by | Therapists, social workers, nurses, physicians | Genetic counsellors, clinical geneticists | Genealogists, families | Anthropologists, sociologists |
| Male / female | Square / circle | Square / circle | Boxes with names | Triangle / circle |
| Death | X through the symbol | Diagonal slash | Death date | Diagonal line through the symbol |
| Couples | Marriage, living together, separation, divorce, with years | Relationship line; a double line if the partners are related | Marriage | = marriage, ≠ divorce, ≈ living together |
| Emotional relationships | Yes: close, fused, distant, hostile, cut off and more | No | No | No |
| Households | Yes, dashed outlines | No | No | Sometimes, for residence rules |
| Health | Shading for substance misuse and illness, with notes | Shading for affected, a dot for carriers | Rarely | No |
| Generations | Usually three | Three or more | As many as known | Around Ego |
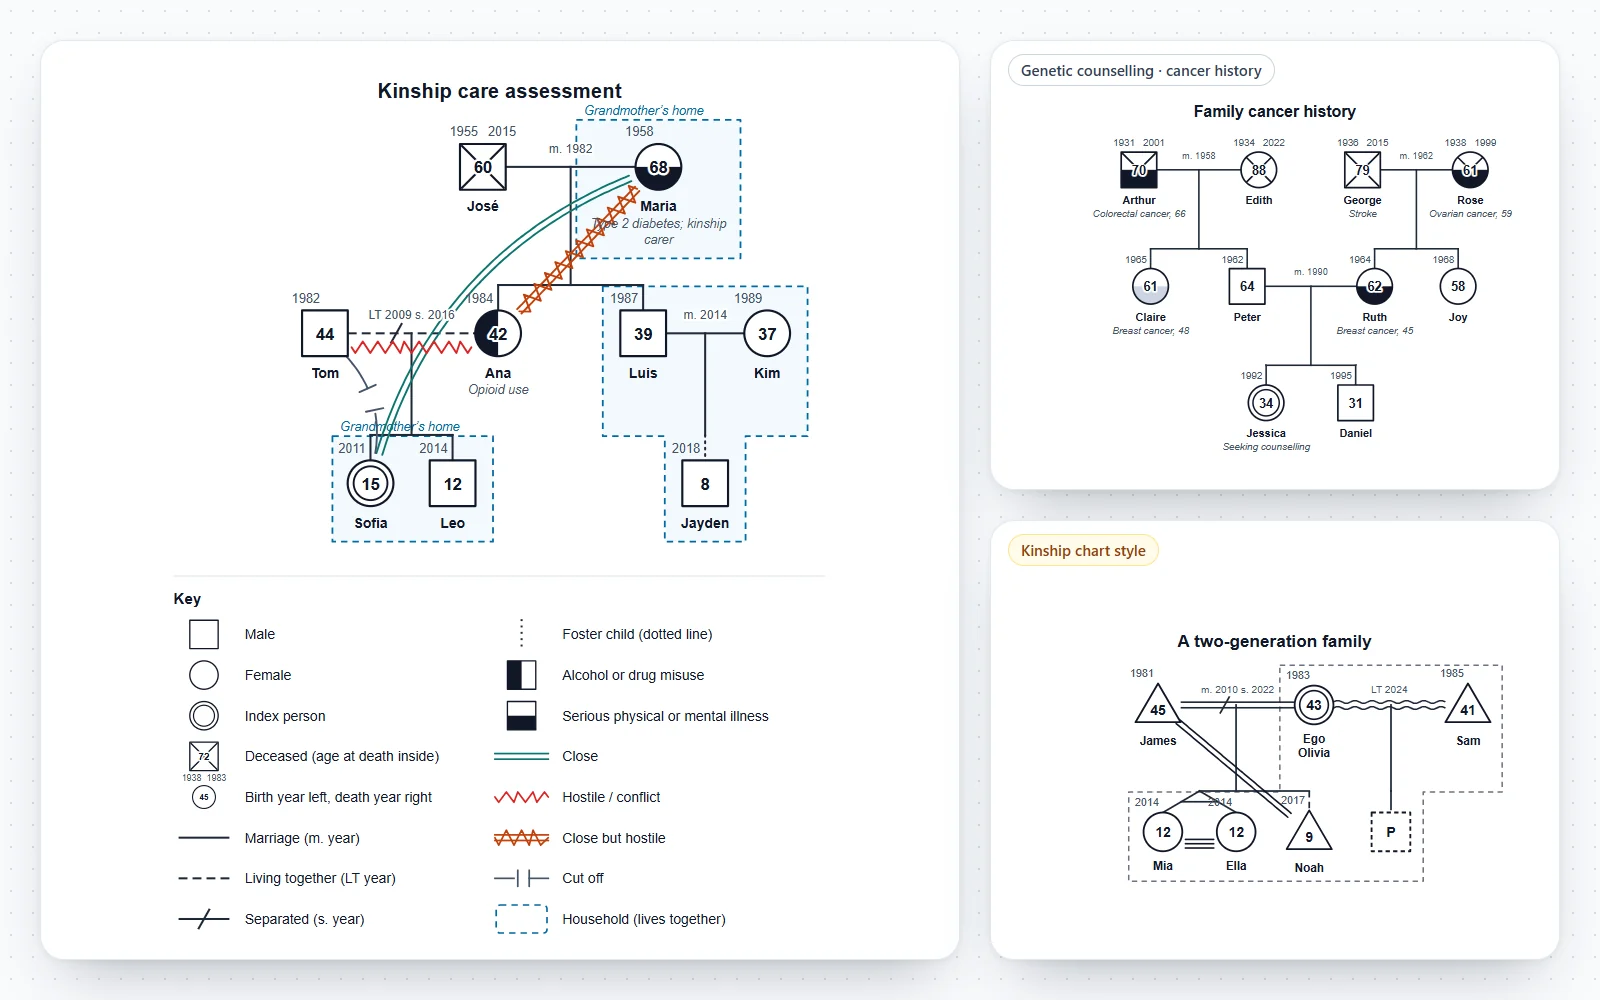
The genogram is the editor: click a person to select them, and use the round buttons around them or the Person panel to grow the family. Every change can be undone with Ctrl+Z, and your work is saved in this browser as you go.
A genogram is a family diagram that records not only who is related to whom, but how the family lives and relates: marriages and break-ups, who lives together, deaths and illnesses, and the emotional quality of relationships. It grew out of Murray Bowen’s family systems theory and was standardised by Monica McGoldrick and Randy Gerson in Genograms in Family Assessment (1985); the current edition, Genograms: Assessment and Treatment, is by McGoldrick, Gerson and Sueli Petry.
Whether you draw it with a client, for a class or for your own family, the same order keeps the genogram readable.
Relationship lines connect two people directly, on top of the family lines. They describe how the relationship feels, not how the people are related, and the key under the chart names every line used.
Anthropologists draw families with a different set of symbols, centred on one person called Ego. Switch Notation to Kinship chart and this tool redraws the same family in that convention.
Every genogram template can be printed as a worksheet. Open Style and choose a worksheet mode, or use “As a worksheet” on a template card below.
A genogram maps a family over at least three generations, with the relationships, households, deaths and health history that a family tree leaves out. Family therapists, social workers, nurses, physicians and counsellors use it to see patterns, such as conflict or illness repeating across generations, and to plan support.
Open the editor at the top of this page and pick a template, or press Reset to start from one person. Select a person to add partners, children, siblings and parents, fill in names, ages and years in the Person panel, add relationship lines and households, and export SVG, PNG or PDF. There is no sign-up or watermark.
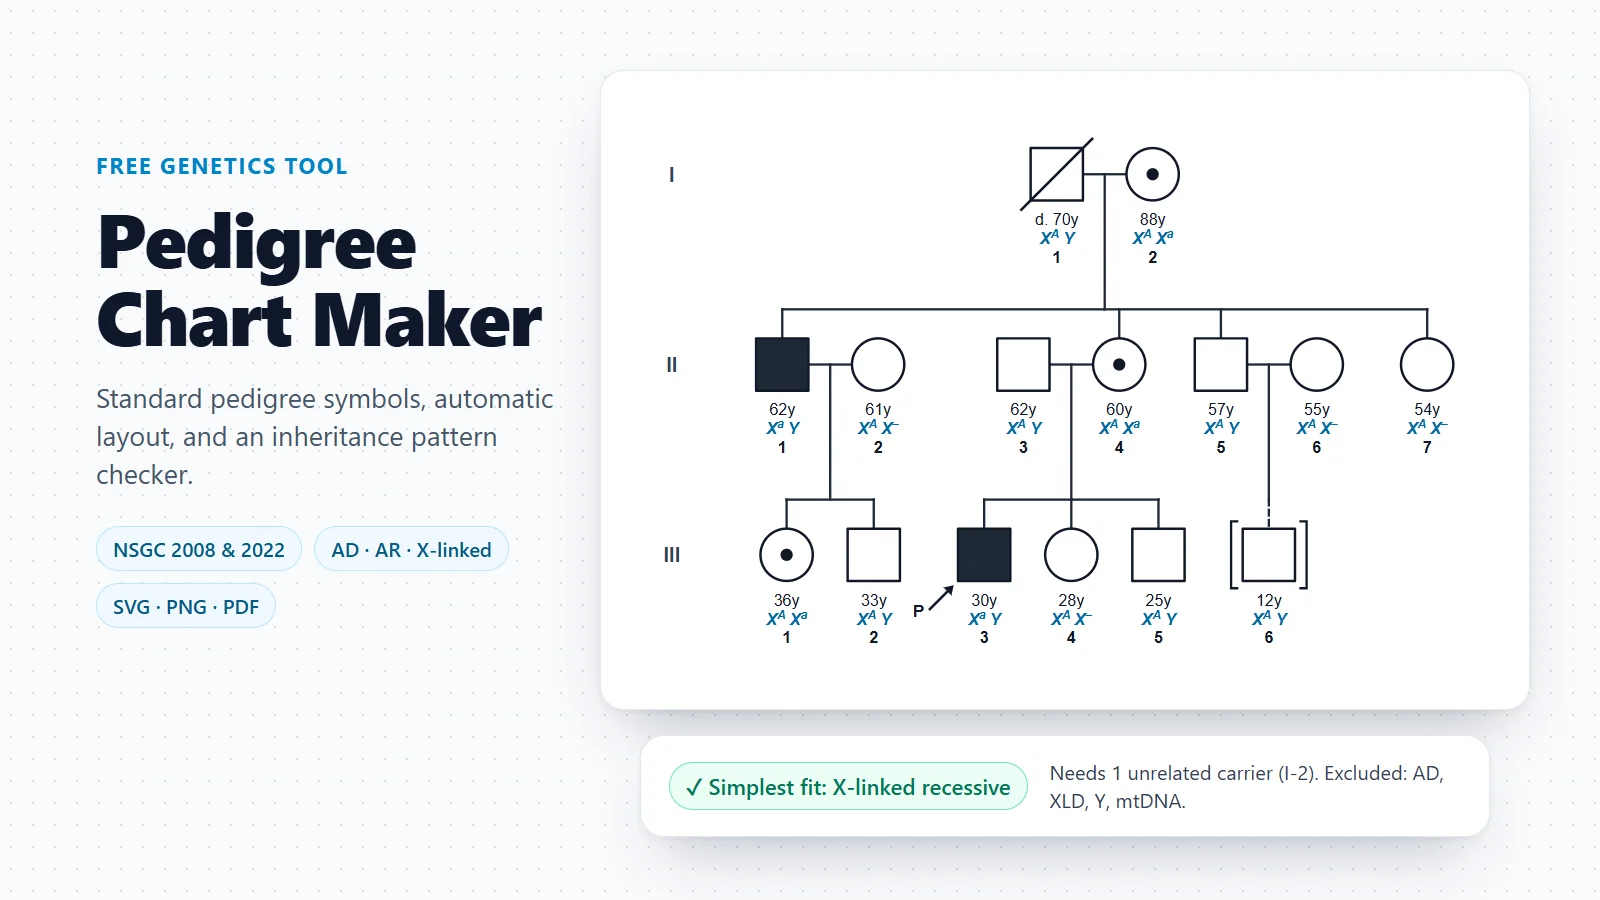
A pedigree chart, drawn to the NSGC standard, tracks the biological inheritance of a trait: who is affected, who is a carrier, and how it passes down. A genogram uses similar family symbols but adds relationships, households, marriages and divorces, and psychological and social information. Use the pedigree chart maker for inheritance and this genogram maker for family systems.
A family tree records ancestry: names, dates and who descends from whom, often over many generations. A genogram covers fewer generations in more depth: the quality of relationships, who lives together, illnesses, addictions, separations and losses.
A horizontal line joins a couple: solid for a marriage and dashed for partners living together, with one slash for a separation and two for a divorce. Vertical lines run down to their children. Lines drawn straight between two people show the emotional relationship: two parallel lines for close, three for fused, a dotted line for distant, a zigzag for conflict and a broken line for a cut-off. Keys differ in the details, such as the lines for adopted and foster children (dashed and dotted in this tool), so every genogram here prints its own key.
An X through a person’s symbol means they have died. The age inside the symbol is their age at death, and the death year is written above the symbol on the right, with the birth year on the left.
Draw each marriage as its own line. A divorce is two slashes across the line, written with the years, for example m. 2005, s. 2016, d. 2018. A remarriage is a second line from the same person to the new partner, with its own year. In this tool, select the person, add a partner, and set each relationship’s status and years in the Person panel.
Draw a dashed line around the members of each household. In this genogram maker, open Homes, add a household and tick its members. If someone who lives elsewhere sits inside the outline, the panel warns you; dragging siblings to reorder them usually fixes it.
In the McGoldrick key, alcohol or drug misuse shades the left half of the symbol and a serious physical or mental illness the bottom half; a person with both is three-quarters shaded. This tool draws suspected misuse as a hatched left half and recovery and remission with a light fill, and the key under the chart names each mark. Add the specific condition as a note under the name.
Yes. Under Style, set Notation to Kinship chart. The same family is redrawn in the anthropology convention: triangles for males, circles for females, = for marriage, ≠ for divorce, ≈ for living together, a slash for a death, and the index person labelled Ego.
Three is the usual minimum: the index person’s generation, their parents and their grandparents, plus any children. Go further back when a pattern seems to start earlier, such as a migration, an early death or a family business.
Yes. Under Style, choose Blank labels to leave names, ages and years as lines to fill in, or Structure only to leave just the family tree with a full key. Turn on Answer key to show what was left out, in red.
The genogram is drawn and saved only in your browser; nothing is uploaded. Still, use initials or pseudonyms for client work, export the file into your organisation’s record system, and clear the browser’s saved data on a shared computer.
It is saved in this browser automatically. Save a .json genogram file to open it again here on any computer, or export SVG to edit the drawing in Illustrator, Inkscape, PowerPoint or Word.
Pedigree Chart Maker
Inheritance pedigrees in the NSGC standard: affected and carrier status, consanguinity and a pattern checker.
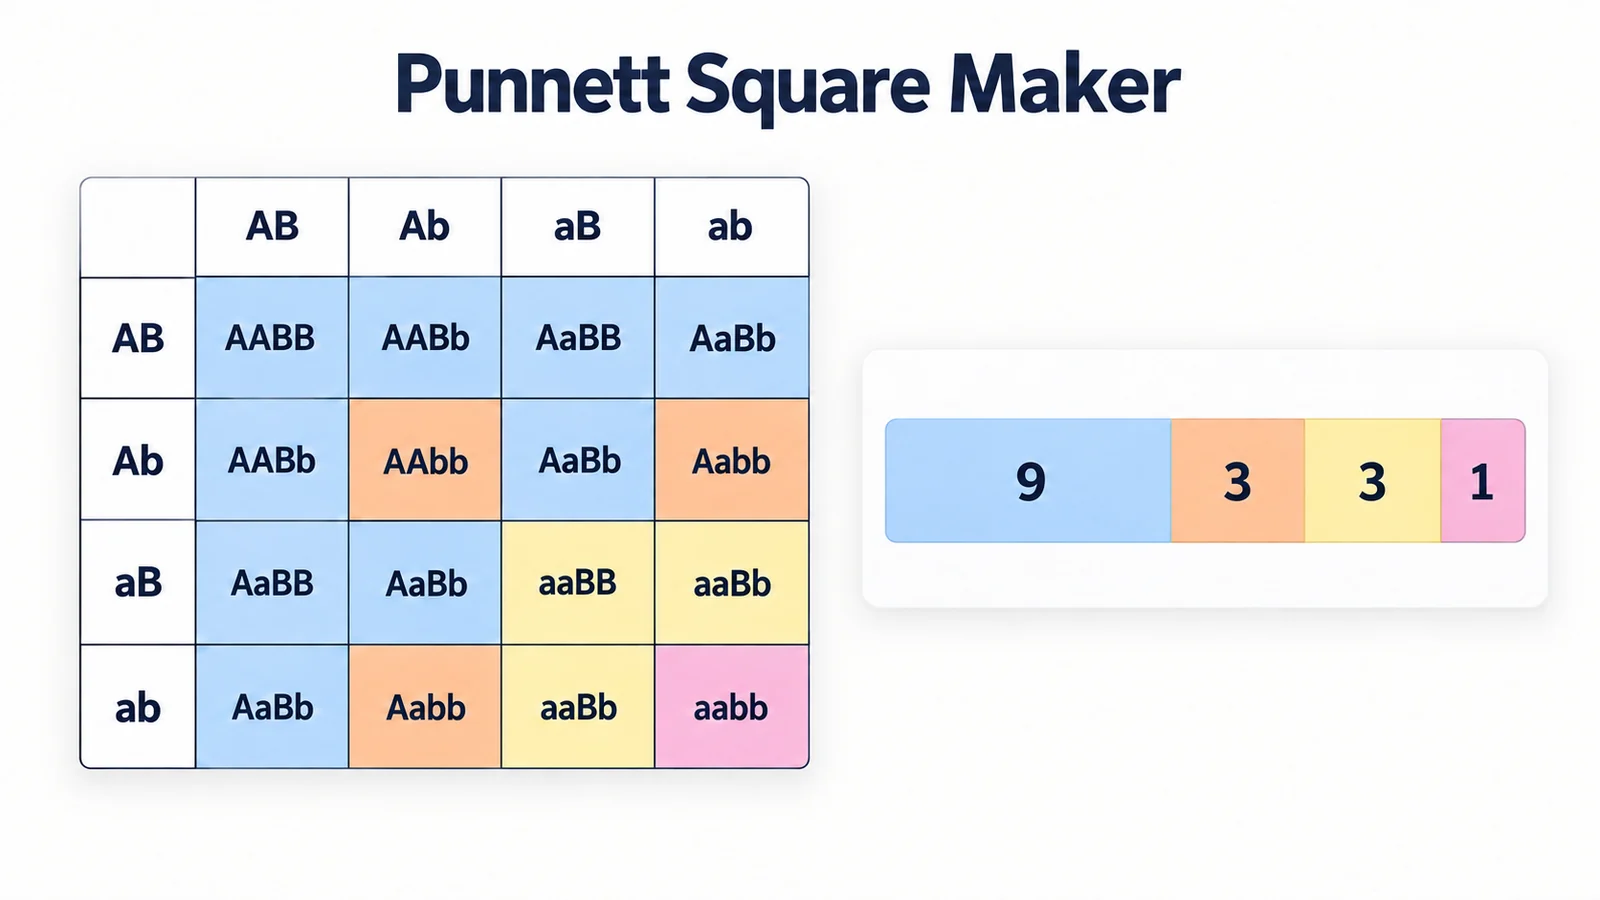
Punnett Square Maker
Work out the chance a couple’s child inherits a trait, from monohybrid to dihybrid crosses.
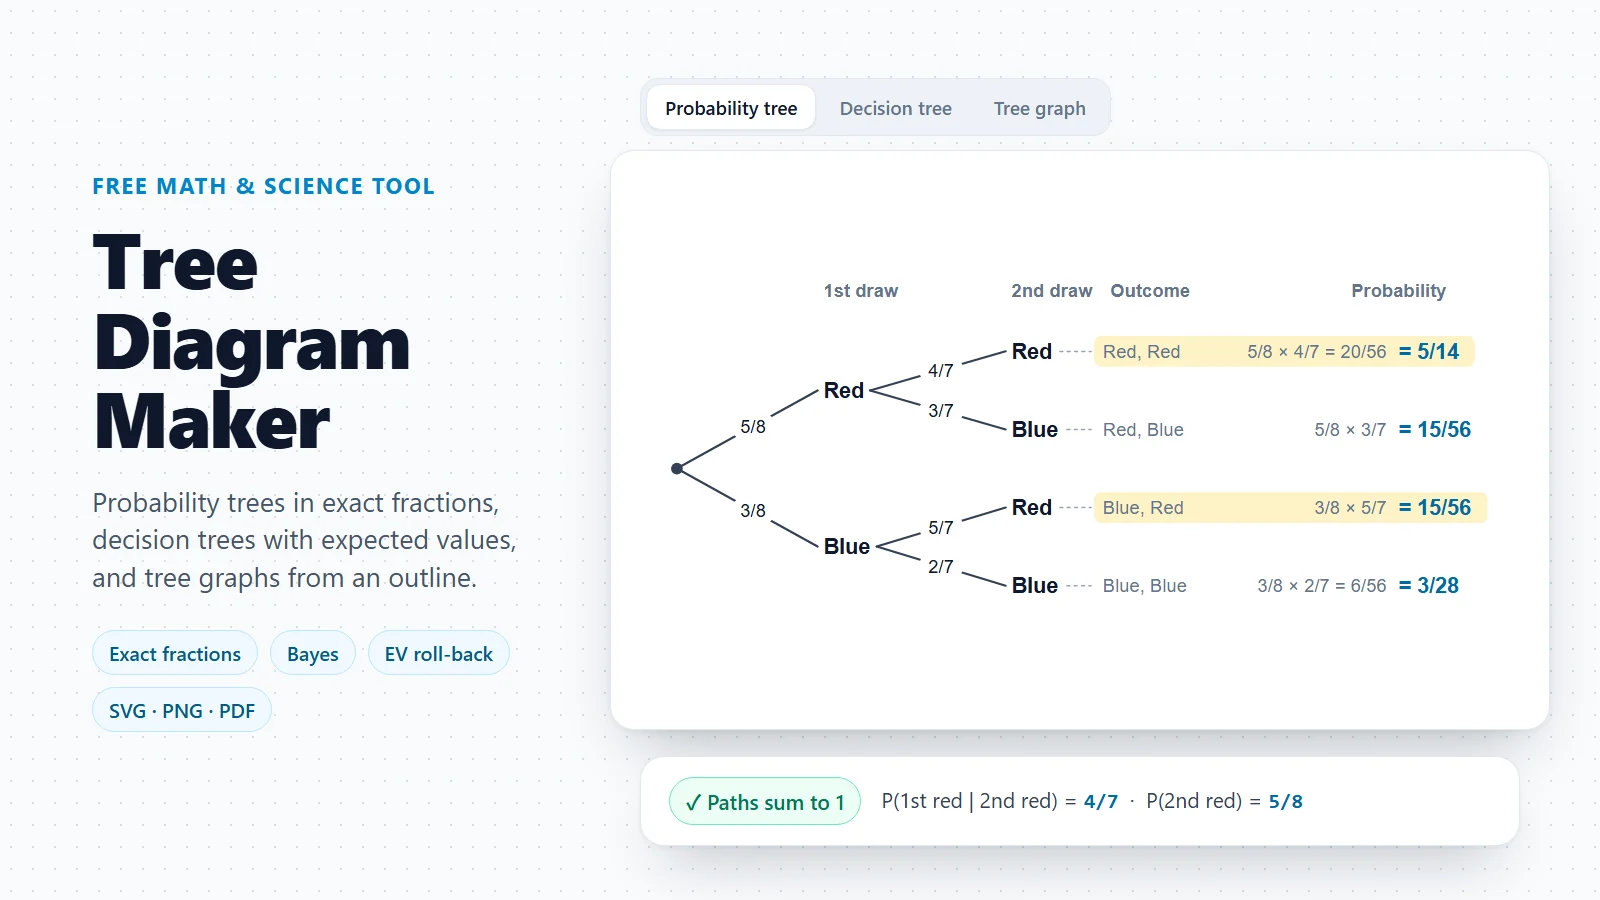
Tree Diagram Maker
Probability trees, decision trees and tree graphs from an indented outline.
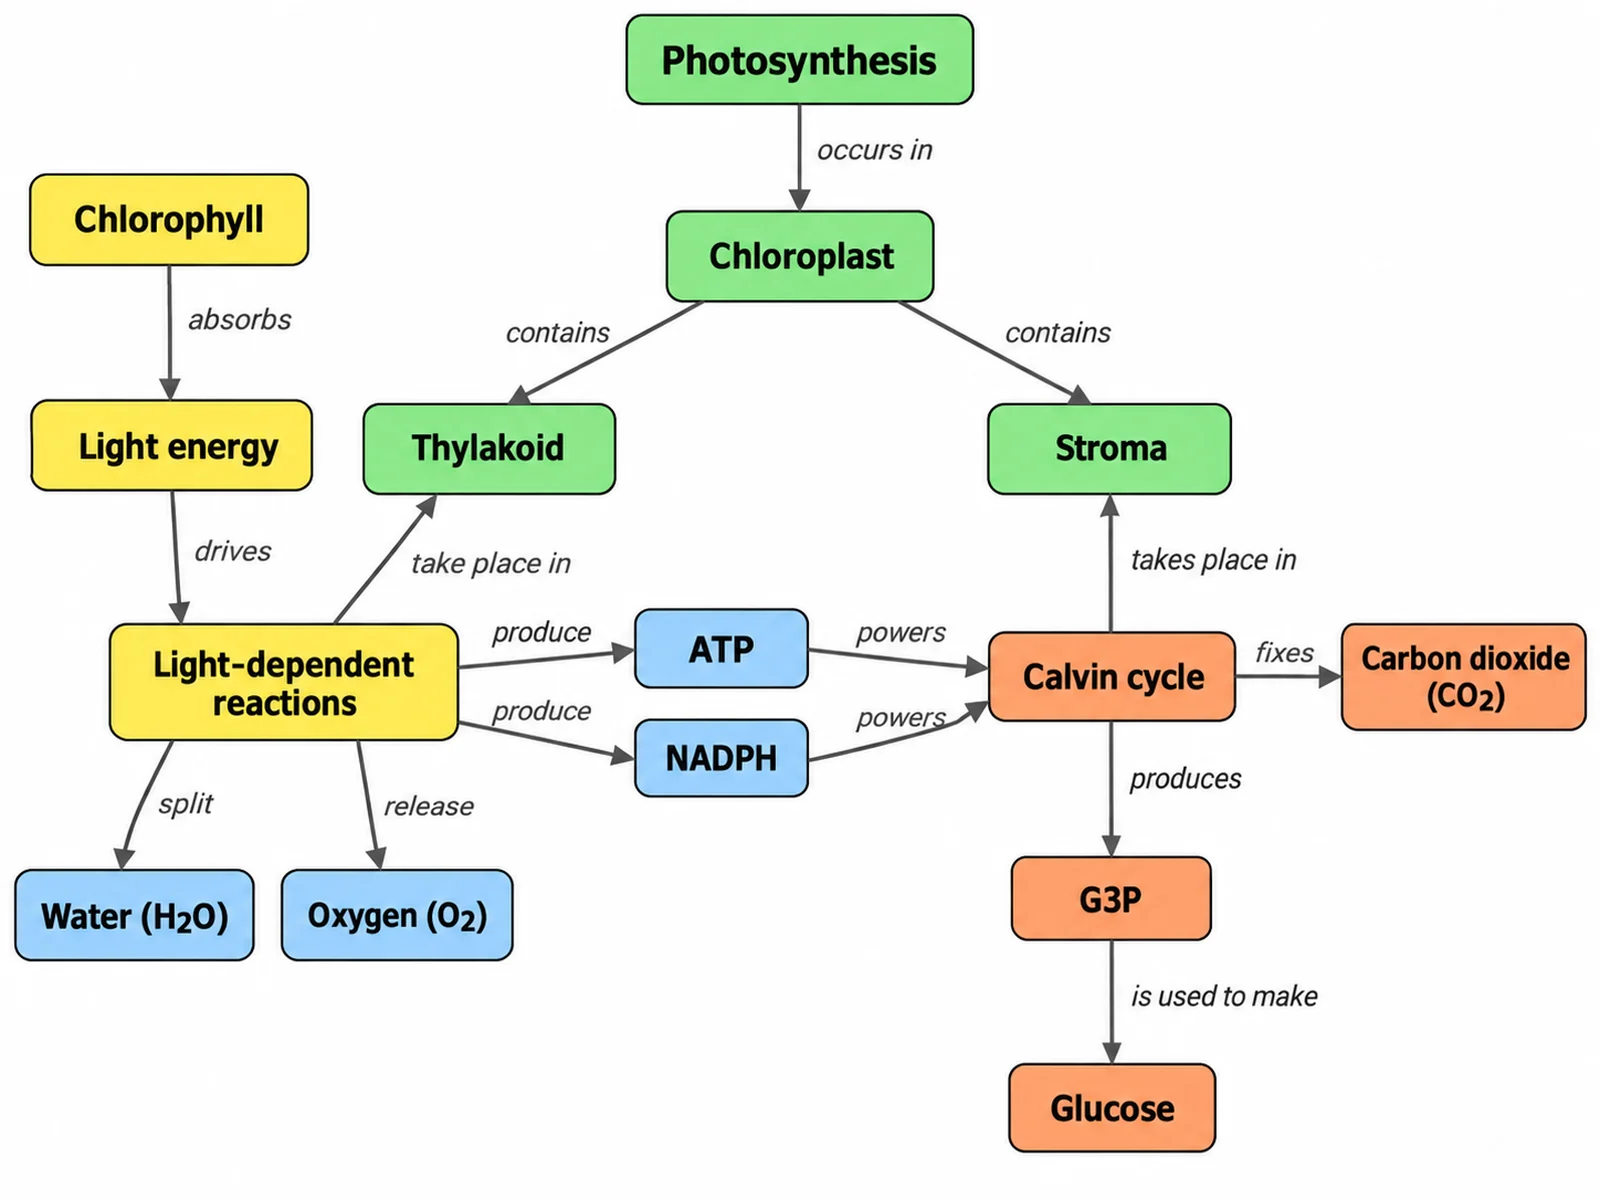
Concept Map Generator
Map the services, schools and people around a family as an ecomap-style concept map.
Comparison Chart Maker
Compare care options, services or interventions side by side with ✓ / ✗ marks and notes.
When the question is inheritance, not relationships, draw the family as a pedigree with affected and carrier status and check which inheritance patterns fit.
Open the pedigree chart makerLast checked: November 17, 2026. Sources: McGoldrick M., Gerson R. & Petry S., Genograms: Assessment and Treatment, 4th ed. (W. W. Norton, 2020); McGoldrick M., Standard Symbols for Genograms (Multicultural Family Institute key); Kinship and Descent, in ANTH 205: Cultures of the World (LibreTexts Social Sciences); Bennett R.L. et al., Standardized pedigree nomenclature update centered on sex and gender inclusivity (Journal of Genetic Counseling, 2022). The template families and names are invented. A genogram supports professional assessment; it is not a diagnosis.