
Free maths tool
Number line generator with fractions and inequalities
Set a range and a step and this number line generator draws the line with labelled ticks, optional sub-divisions, and arrowheads. Label in decimals or reduced fractions, mark points with open or filled circles, shade an inequality, and export a printable PNG or an editable SVG.
Add a point to mark a value. Open circles show a strict inequality, filled circles an inclusive one.
How to make a number line
A number line shows numbers as evenly spaced positions along a straight line, so that order and distance become visible. Three settings define it: where it starts, where it ends, and how far apart the labelled ticks are.
- Set the minimum and maximum. Negative values are fine, and the line will cross zero wherever it falls.
- Set the step: the distance between labelled ticks. A step of 1 on a 0 to 10 line gives eleven labels, counting both ends.
- Add sub-ticks to divide each step into smaller unlabelled parts. Four sub-ticks between tens gives you twos.
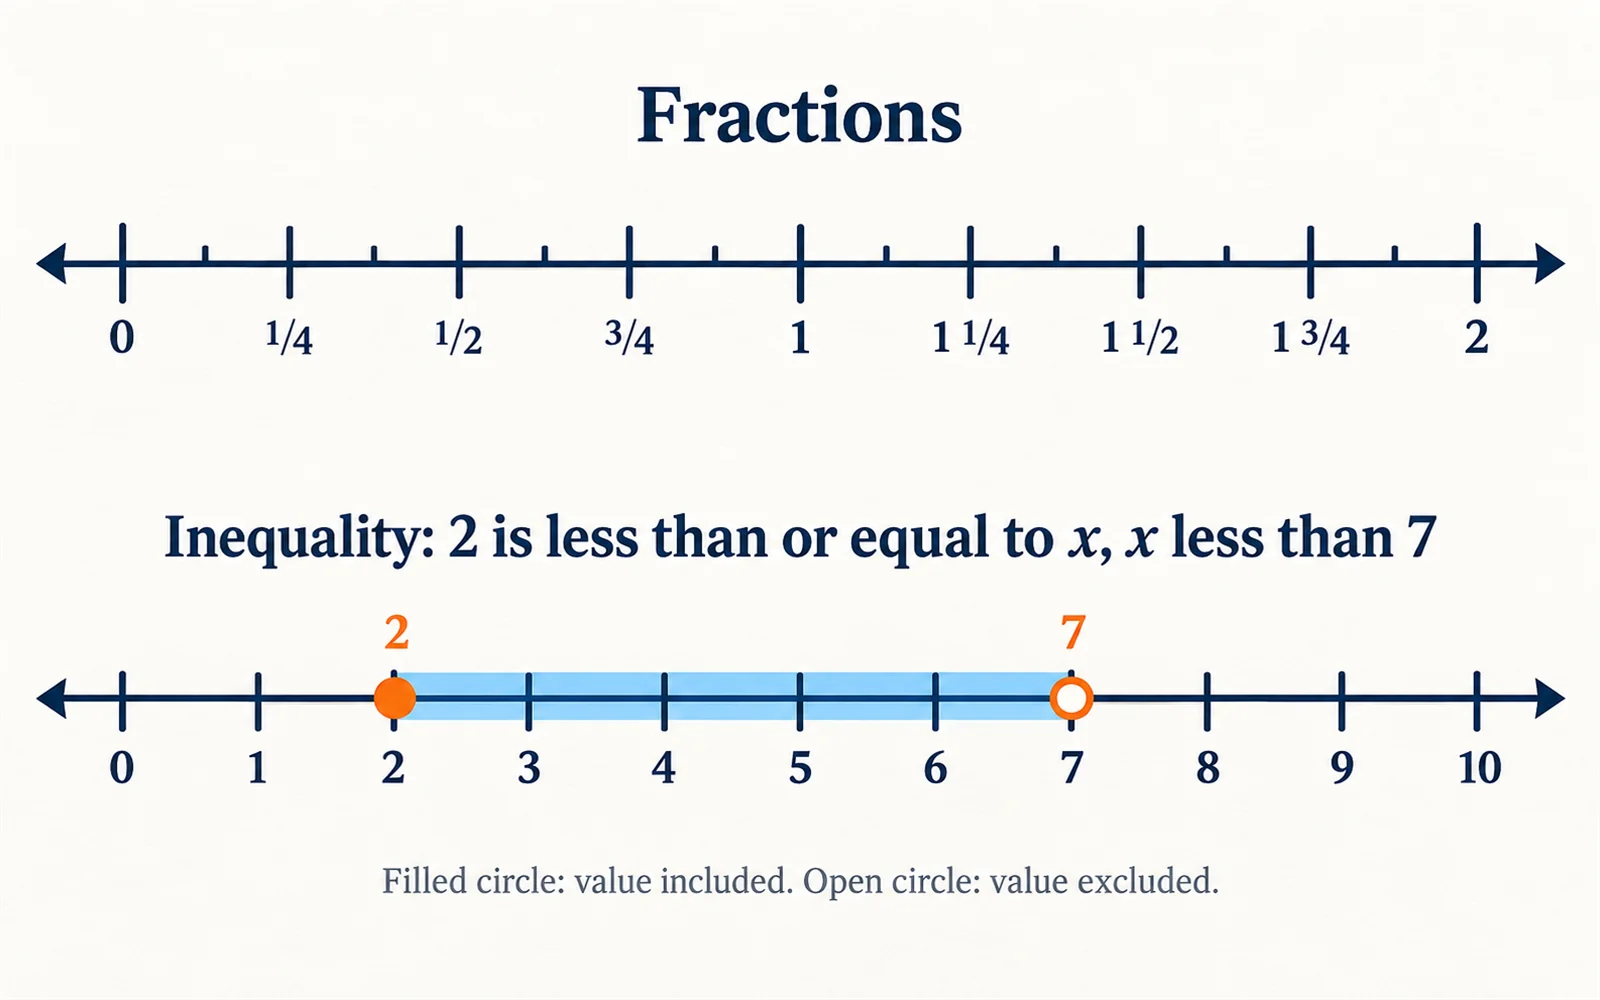
- Choose decimal or fraction labels. Fraction mode reduces automatically, so 0.75 on a quarter-step line prints as 3/4 and 1.5 prints as 1 1/2.
- Leave the labels blank to print an empty number line for students to fill in.
Open and filled circles
When a number line represents an inequality, the circle at the boundary carries the meaning. Getting it backwards reverses what the diagram says.
- A filled circle means the value is included: x ≥ 3 or x ≤ 3. The boundary is part of the solution.
- An open circle means the value is excluded: x > 3 or x < 3. The boundary is not part of the solution.
- The shaded ray shows which direction the solution runs. Shade to the right for greater than, to the left for less than.
- For a compound inequality such as 2 ≤ x < 7, use a filled circle at 2, an open circle at 7, and shade between them.
- In interval notation a square bracket matches a filled circle and a round bracket an open one: [2, 7).
Number lines with fractions
Placing fractions on a line is where the idea of equivalent fractions becomes concrete, because 1/2, 2/4, and 3/6 all land on exactly the same point.
- Set the step to the fraction you are working in. A step of 0.25 gives quarters; 0.3333333333 gives thirds.
- Fraction labels are reduced to lowest terms, so a line in quarters prints 1/4, 1/2, 3/4, 1 rather than 1/4, 2/4, 3/4, 4/4.
- Values above one print as mixed numbers: 1 1/2 rather than 3/2.
- To compare two fractions, put both on the same line. Whichever sits further right is larger, which works even when the denominators differ.
- To show equivalence, generate one line in quarters and one in eighths over the same range and place them one above the other.
Printing a number line for classroom use
Most classroom uses need either a blank line to annotate or a labelled one to read from. Both come out of the same settings.
- For a blank line, set the tick labels to Blank. You get evenly spaced ticks with no numbers, ready to fill in.
- For a number line to cut out and stick on desks, export the PNG at the default width and scale it to the page in your document.
- For a worksheet with several lines, export each one and place them in a document, or export SVG and arrange them in Illustrator, Inkscape, or PowerPoint where the text stays editable.
- Keep the number of labelled ticks under about twenty. Past that the labels crowd and the line stops being readable; the tool warns you when the range and step call for too many.
Frequently asked questions
Is this number line generator free?
Yes. It runs entirely in your browser, needs no account, and exports PNG and SVG without a watermark. Nothing you enter is uploaded to a server.
Can I make a blank number line to print?
Yes. Set the tick labels to Blank and you get evenly spaced ticks with no numbers, which is the usual format for a fill-in-the-blank worksheet. Add sub-ticks if you want students to count smaller intervals.
How do I show fractions such as 3/4 on a number line?
Set the step to the fraction size, so 0.25 for quarters, and switch the labels to Fraction. The tool reduces each label to lowest terms and writes values above one as mixed numbers, so you get 1/4, 1/2, 3/4, 1, 1 1/4 rather than a row of quarters.
What does an open circle mean on a number line?
That the value is not included in the solution, which is what you use for a strict inequality such as x > 3. A filled circle means the value is included, for x ≥ 3. The circle is the whole difference between the two.
Can I show negative numbers?
Yes. Set a negative minimum and the line crosses zero wherever it falls in the range. Fraction labels handle negatives too, so a quarter-step line prints −3/4 correctly rather than as a decimal.
How do I show an inequality like 2 ≤ x < 7?
Choose the Between shading and enter 2 and 7, then add two points: one at 2 set to Filled and one at 7 set to Open. The shaded band shows the solution and the circles show which endpoints belong to it.
Why does it warn me about too many ticks?
Because a line with more than about twenty labelled ticks becomes unreadable at any printed size: the labels overlap and the line loses its point. Increase the step, or narrow the range, and use sub-ticks for the finer divisions instead.
Related tools
Bell Curve Generator
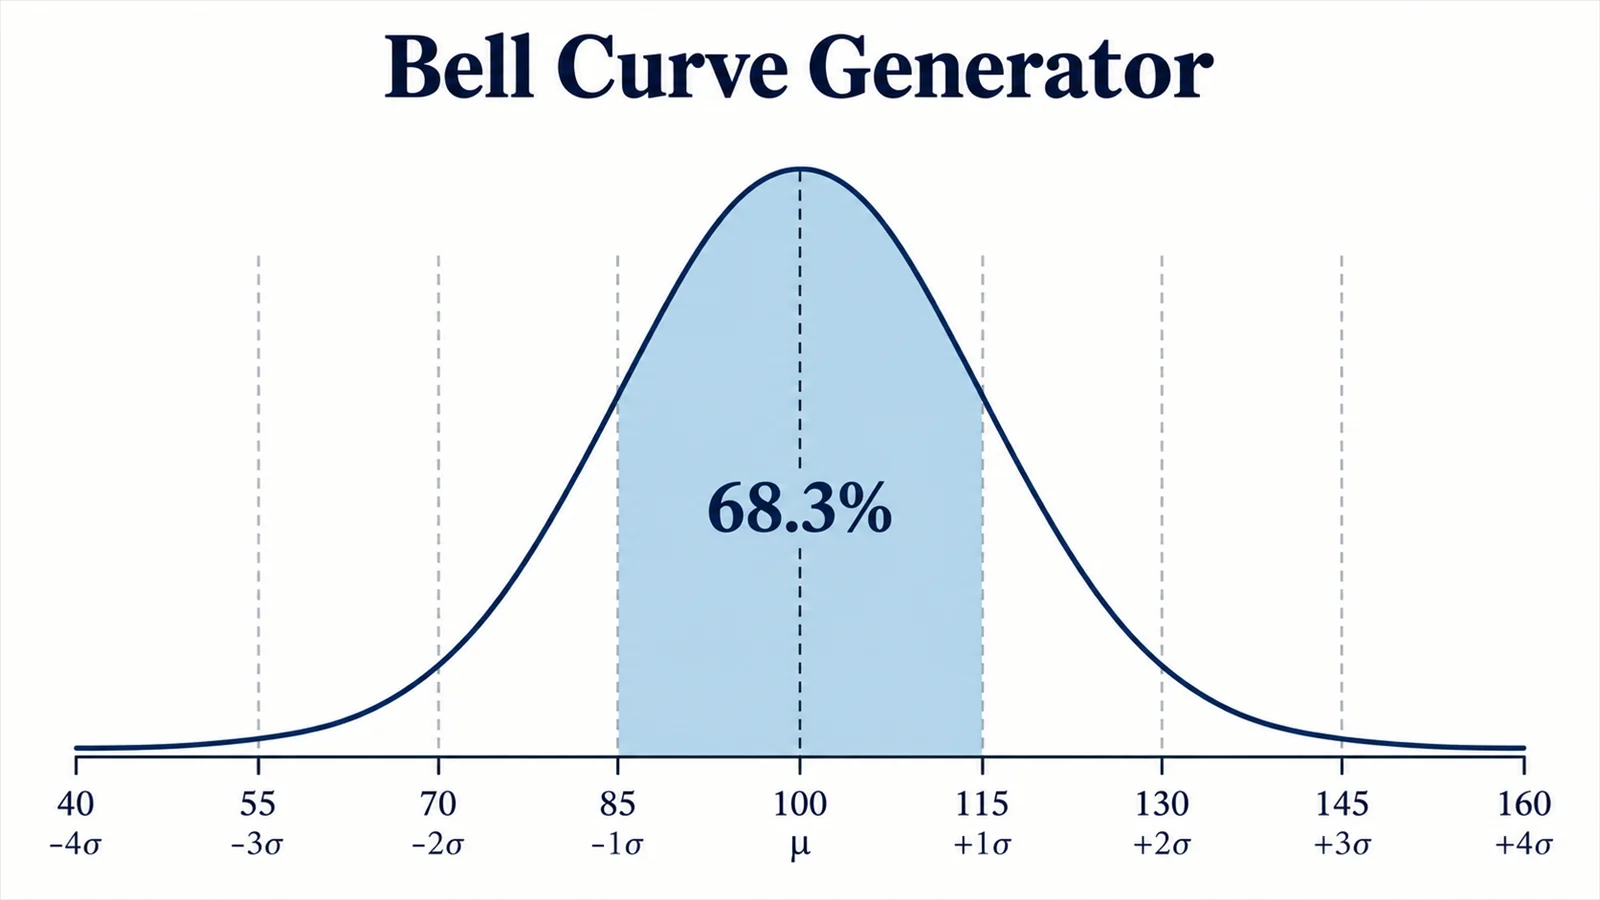
Draw a normal distribution with shaded regions and z-scores.
Stem and Leaf Plot Generator
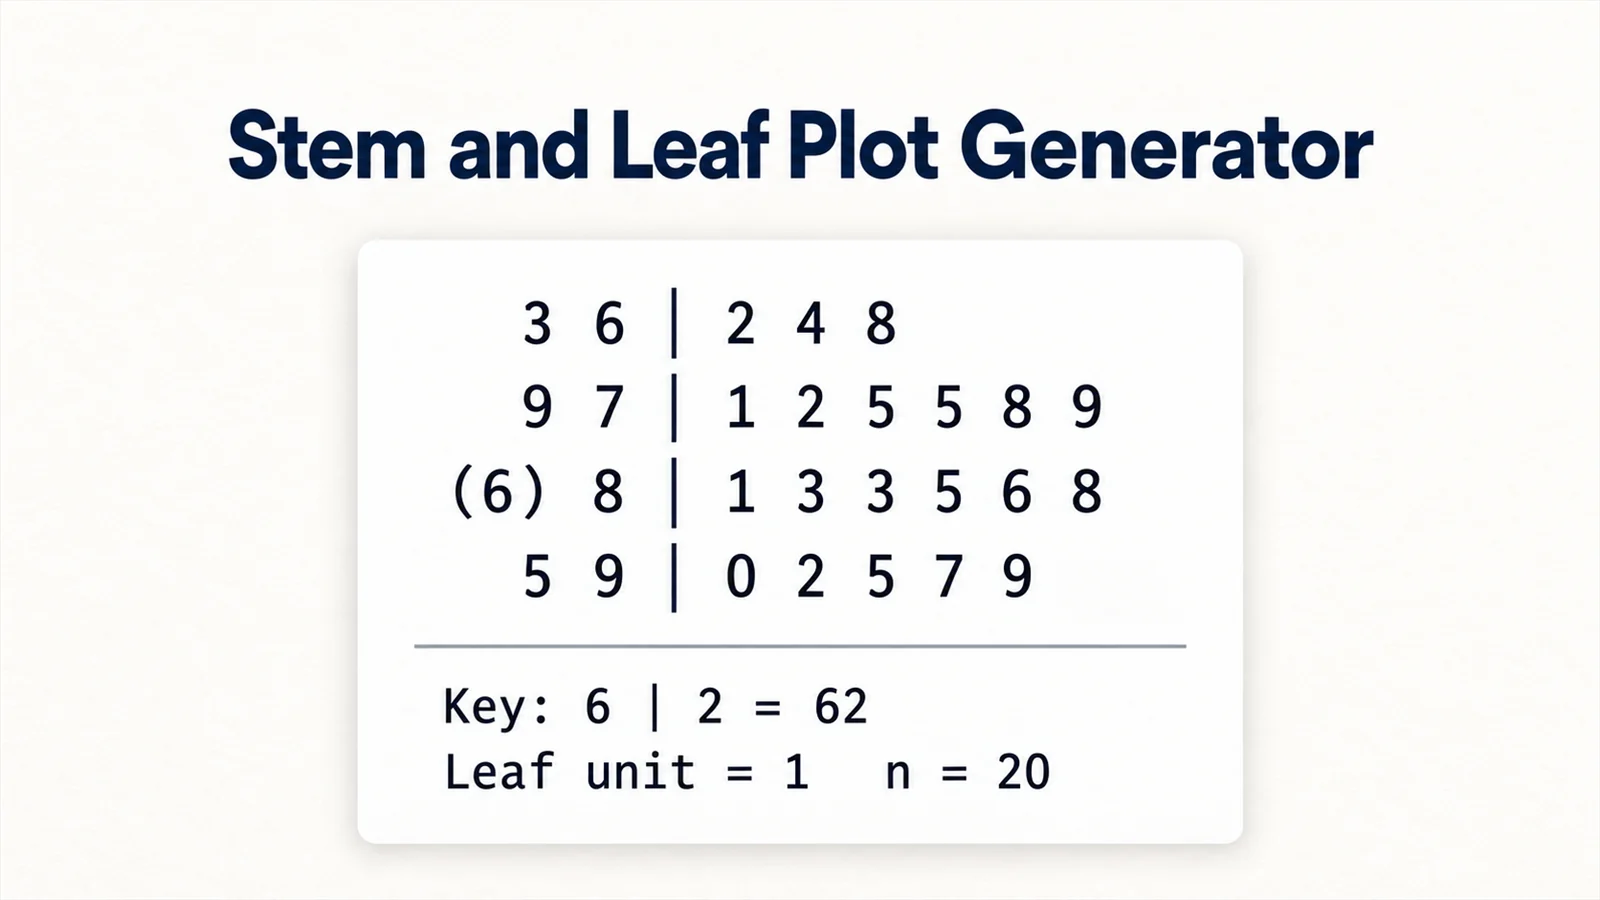
Build a stem-and-leaf display with depths and quartiles.

Box Plot Generator
Build box and whisker plots with quartiles and outliers.
Punnett Square Maker
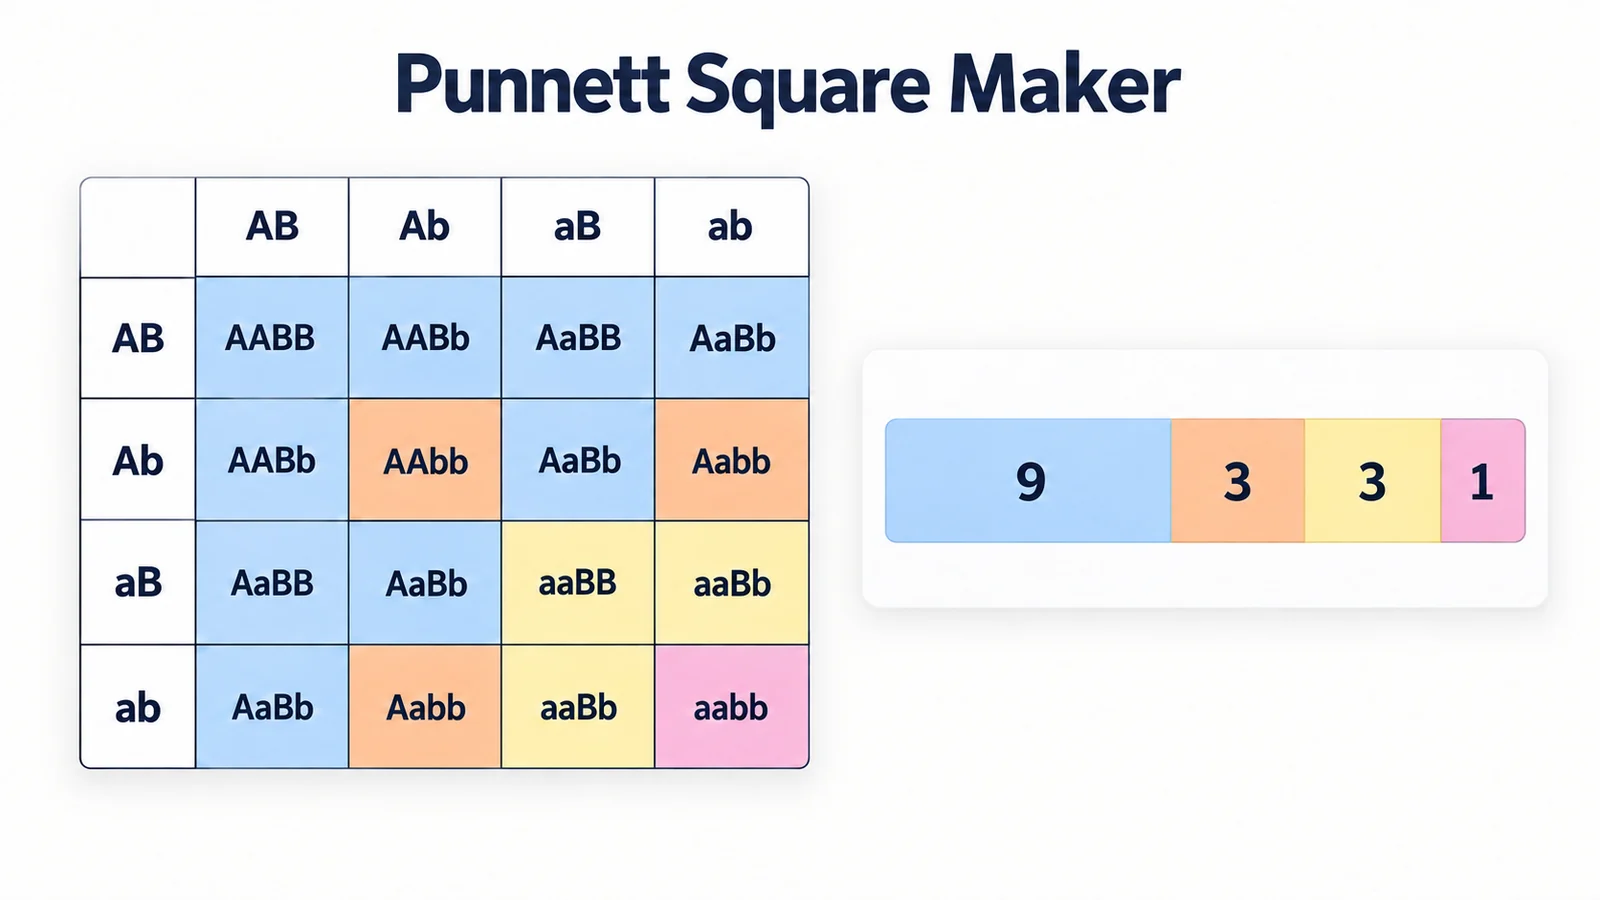
Build genetics crosses with genotype and phenotype ratios.
Need a chart rather than a line?
SciFigure AI turns data into publication-ready charts and diagrams for reports, posters, and slides.
Explore the chart generatorsLast checked: September 20, 2026. Sources: NCTM: Representing numbers on the number line; Okabe & Ito, colour-blind safe palette.