Generate a labeled glycolysis chart with all ten steps in order — from glucose through fructose-1,6-bisphosphate, the split into two three-carbon sugars, and on to two pyruvate — with the enzyme on every arrow and the energy bookkeeping exact: 2 ATP used, 4 ATP made, 2 NADH, net 2 ATP per glucose. Choose an easy two-phase drawing, the ten-step chart, or a blank glycolysis worksheet with its answer key.
All 10 steps and enzymesNet 2 ATP, 2 NADH, 2 pyruvateChart, drawing, or worksheet
Checked against OpenStax Biology 2e
Net 2 ATP, 2 NADH, 2 pyruvate
Labeled, numbered, or blank
Print-ready PNG
AI Glycolysis Diagram Generator
Describe the steps, enzymes, and level of detail you need, or ask for a blank worksheet.
558 / 2000 characters
Generate a publication-ready PNG from your description.
Preview
Glycolysis Diagram Example Previews
Target aspect ratio: 4:3
Sample previews. Describe your diagram to generate your own glycolysis figure.
Glycolysis Diagram Examples
Use these as visual directions for a labeled ten-step glycolysis diagram, an easy drawing, a step-by-step glycolysis chart, glycolysis inside cellular respiration, the fates of pyruvate, and a blank worksheet.
Prompt
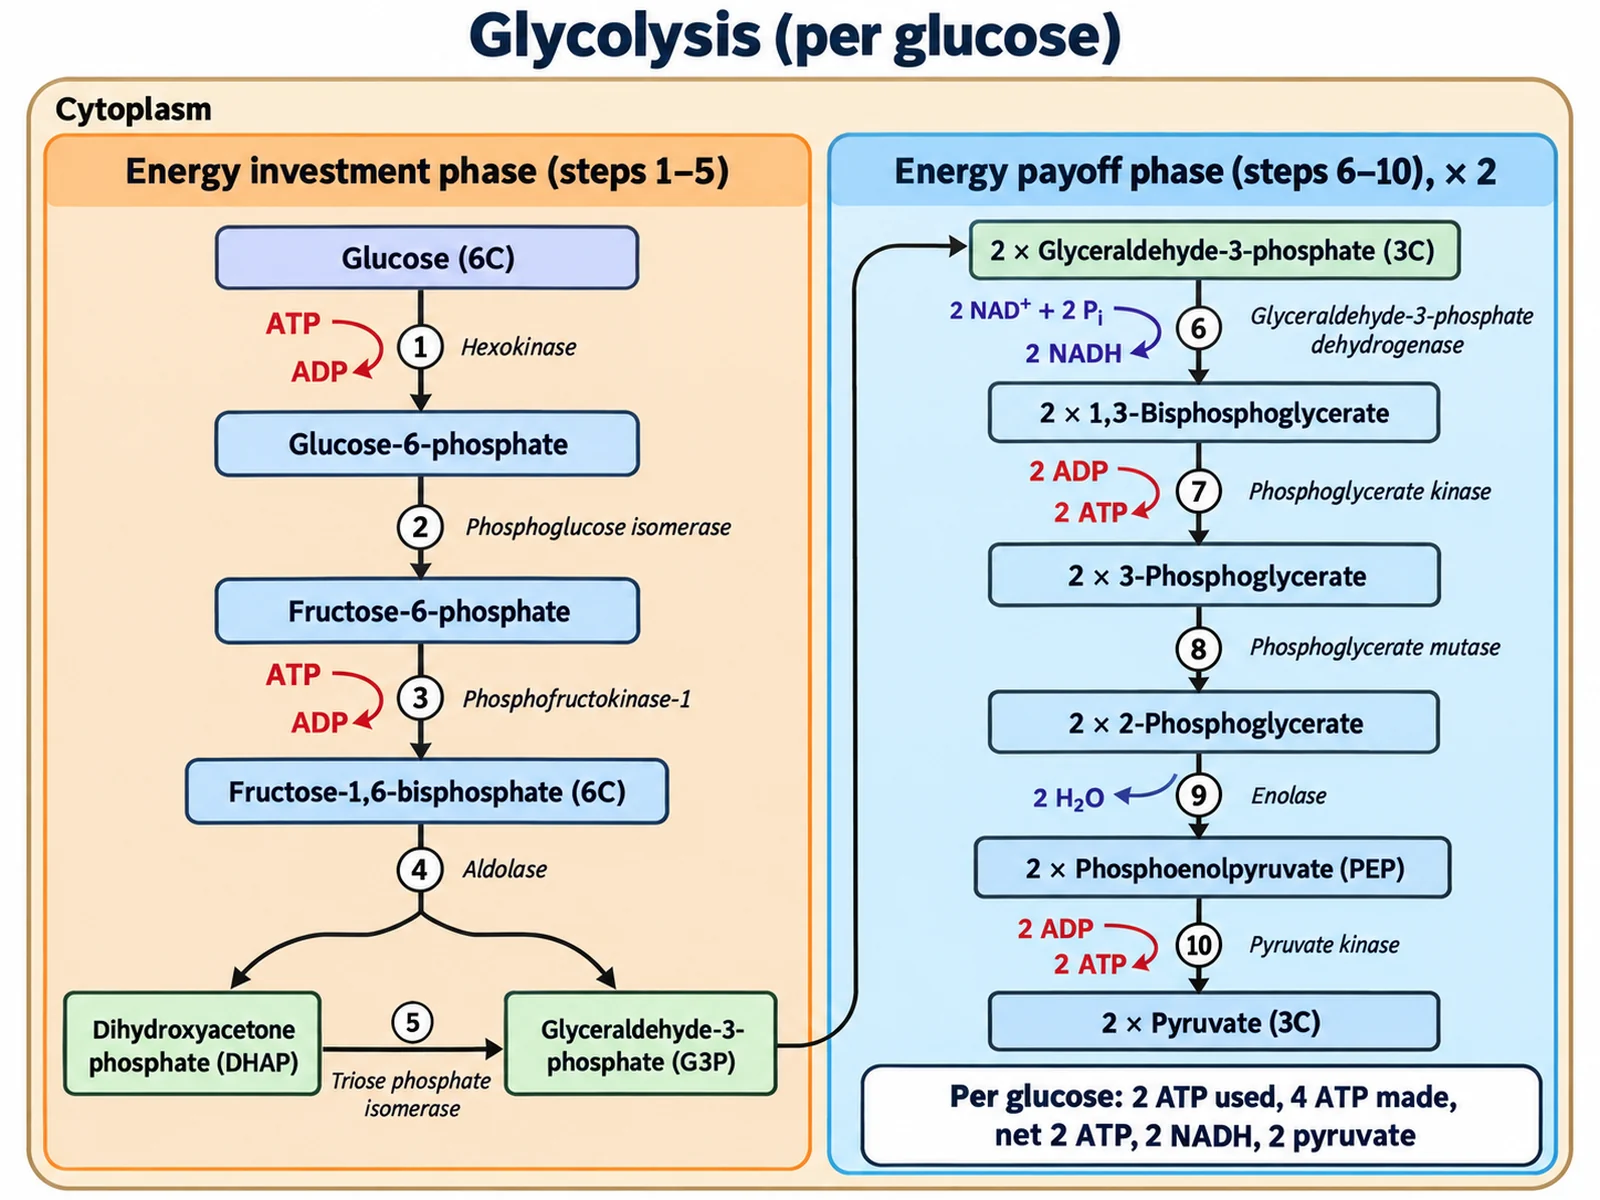
Create a fully labeled glycolysis diagram on a white background in a clean biochemistry textbook style, inside a pale panel labeled "Cytoplasm". Left column, headed "Energy investment phase (steps 1–5)": boxes from top to bottom — "Glucose (6C)", "Glucose-6-phosphate", "Fructose-6-phosphate", "Fructose-1,6-bisphosphate (6C)" — then a split into "Dihydroxyacetone phosphate (DHAP)" and "Glyceraldehyde-3-phosphate (G3P)", with an arrow from DHAP to G3P. Right column, headed "Energy payoff phase (steps 6–10), × 2": "2 × Glyceraldehyde-3-phosphate (3C)", "2 × 1,3-Bisphosphoglycerate", "2 × 3-Phosphoglycerate", "2 × 2-Phosphoglycerate", "2 × Phosphoenolpyruvate (PEP)", "2 × Pyruvate (3C)". Number each arrow 1–10 with its enzyme: hexokinase, phosphoglucose isomerase, phosphofructokinase-1, aldolase, triose phosphate isomerase, glyceraldehyde-3-phosphate dehydrogenase, phosphoglycerate kinase, phosphoglycerate mutase, enolase, pyruvate kinase. Side arrows: "ATP → ADP" at 1 and 3; "2 NAD+ → 2 NADH" at 6; "2 ADP → 2 ATP" at 7 and 10; "2 H2O" out at 9. Summary box: "Per glucose: 2 ATP used, 4 ATP made, net 2 ATP, 2 NADH, 2 pyruvate".
Use this example
Prompt
Create a simple, easy glycolysis drawing for an introductory class, easy to copy by hand. Use bold flat colours, thick dark outlines, large text, and plenty of white space on a white background. At the top draw a hexagon labeled "Glucose (6 carbons)". A thick arrow runs down, with a side arrow labeled "2 ATP in" and the bracket label "Investment". Halfway down, the arrow splits into two arrows, each ending in a rounded box labeled "Pyruvate (3 carbons)". Beside the lower half draw side arrows labeled "4 ATP out" and "2 NADH out" and the bracket label "Payoff". Add a caption box reading "Net: 2 ATP, 2 NADH, 2 pyruvate. Happens in the cytoplasm. No oxygen needed." No other labels, no CO2, and no mitochondrion.
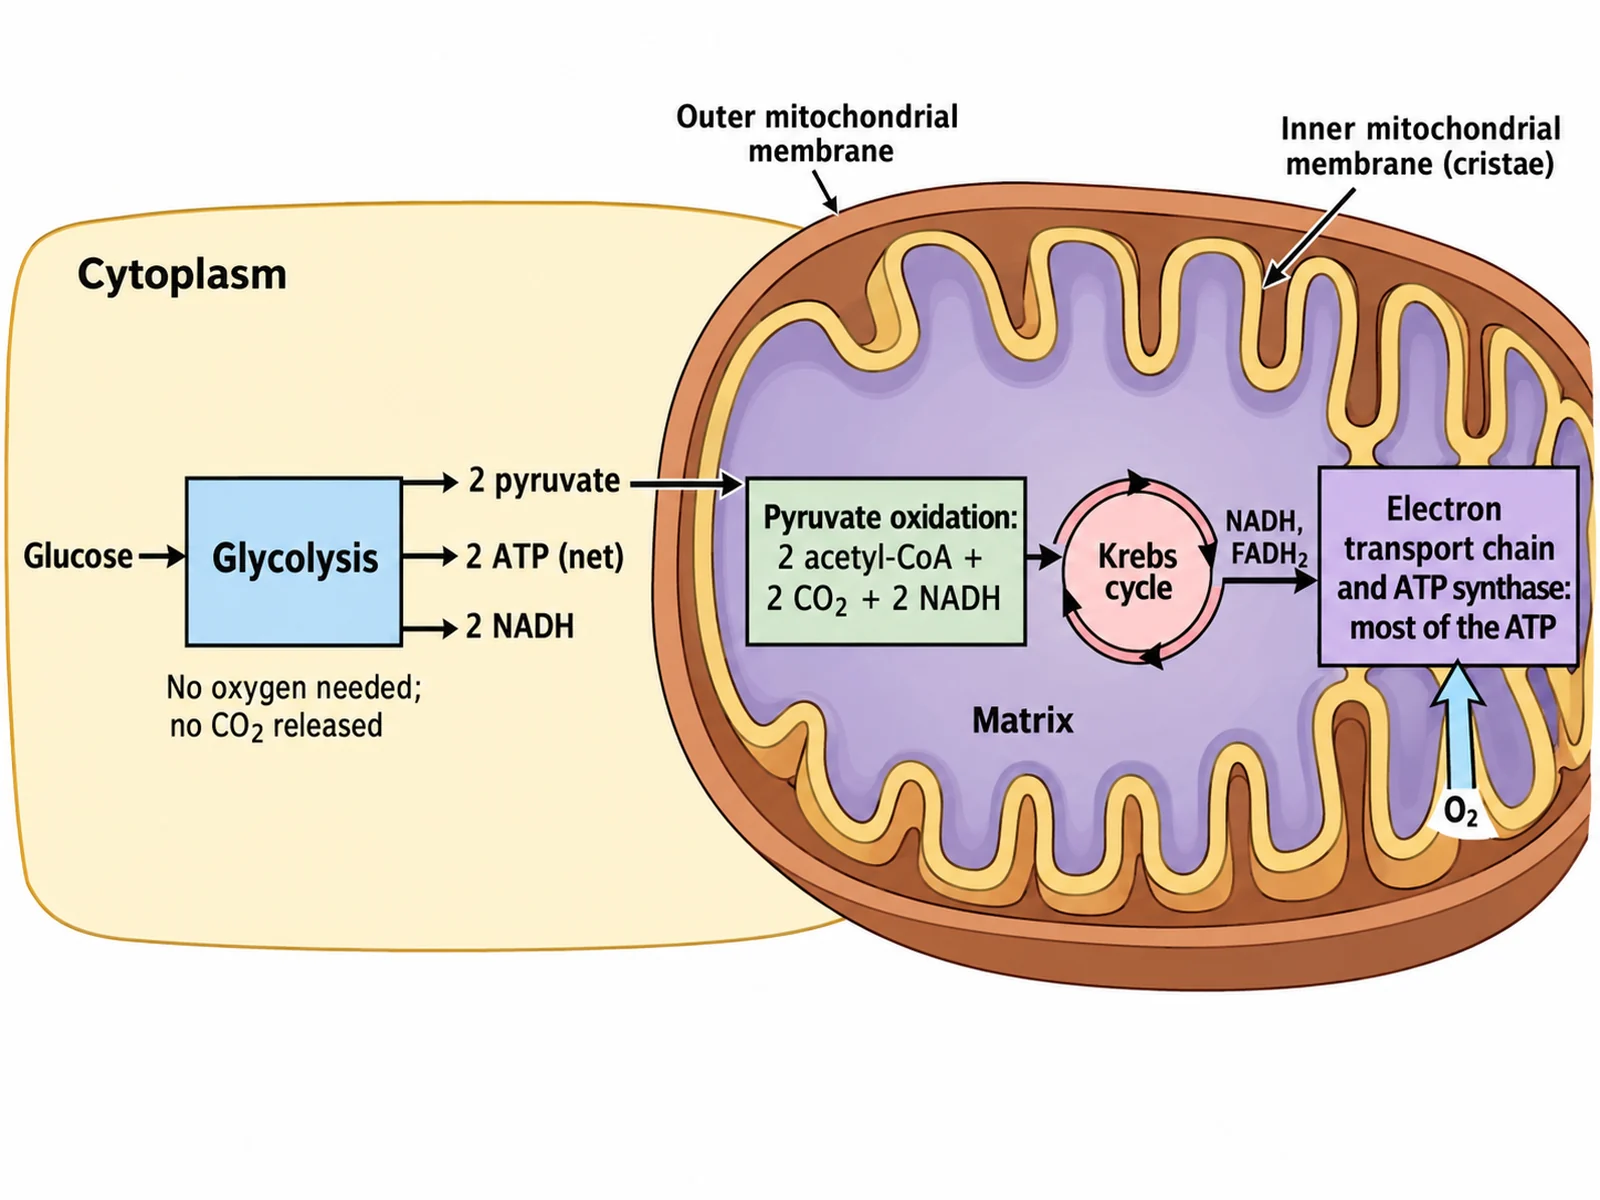
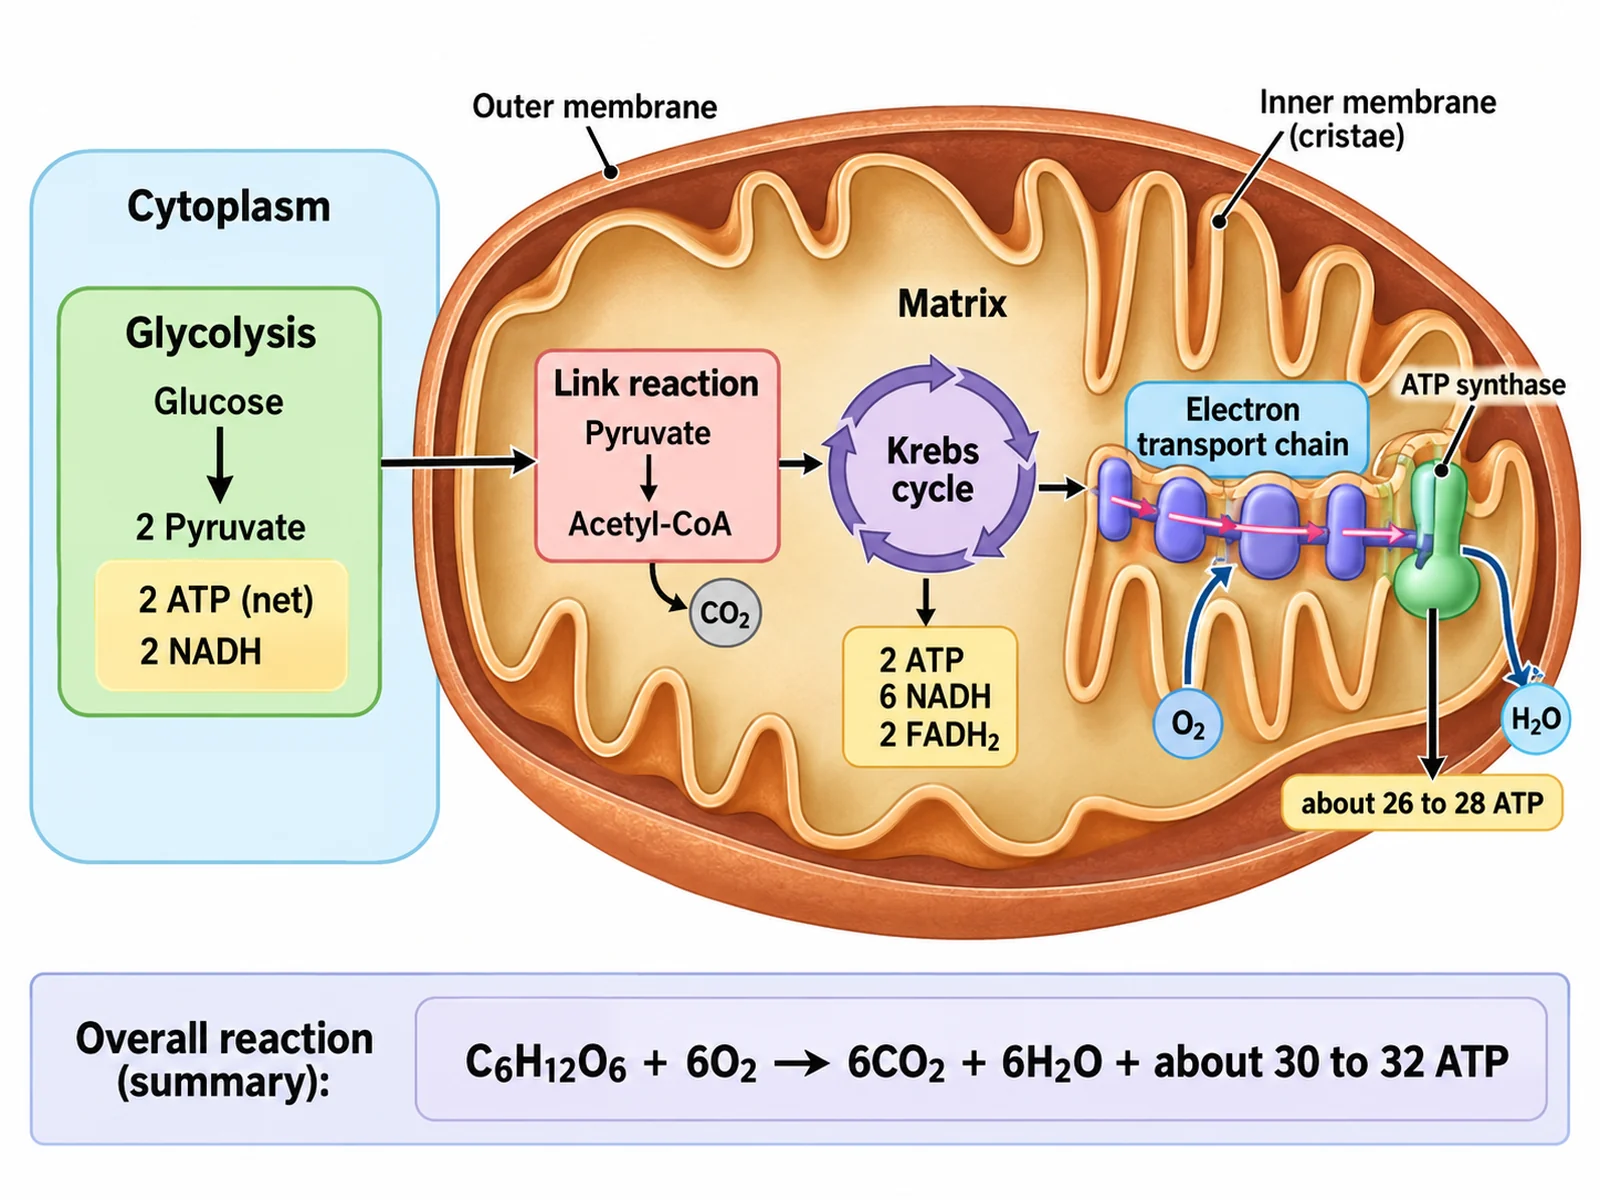
Create a cellular respiration diagram that highlights where glycolysis fits, on a white background. Draw a large pale area labeled "Cytoplasm" containing a bold box labeled "Glycolysis" with "Glucose" entering it and three outputs leaving it: "2 pyruvate", "2 ATP (net)", and "2 NADH". To the right draw a cut-away mitochondrion with an outer membrane, a folded inner membrane, and a matrix. Draw the "2 pyruvate" arrow crossing both membranes into the matrix, to a box labeled "Pyruvate oxidation: 2 acetyl-CoA + 2 CO2 + 2 NADH", then a loop labeled "Krebs cycle", then arrows to the inner membrane labeled "Electron transport chain and ATP synthase: most of the ATP". Add a note under the glycolysis box: "No oxygen needed; no CO2 released". Keep glycolysis outside the mitochondrion.
Use this example
Prompt
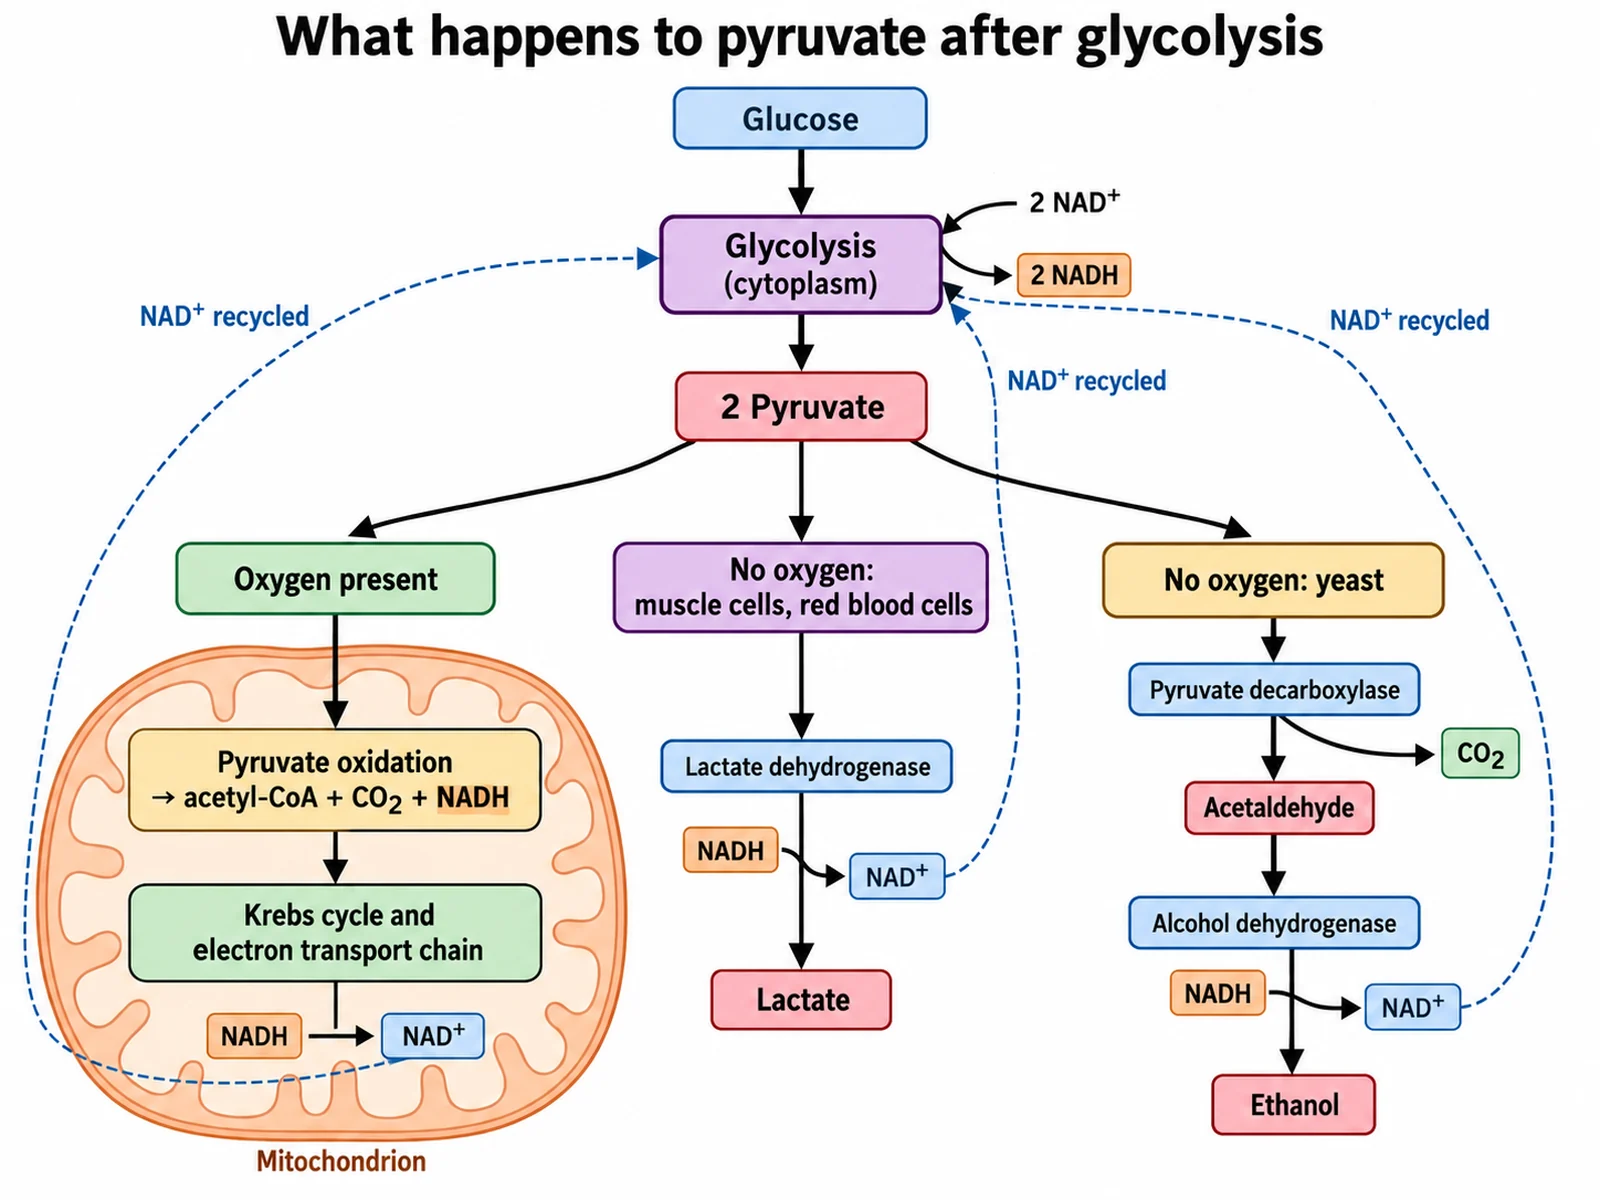
Create a three-branch diagram on a white background titled "What happens to pyruvate after glycolysis". At the top draw "Glucose" → "Glycolysis (cytoplasm)" → "2 Pyruvate", with "2 NAD+ → 2 NADH" beside glycolysis. From pyruvate draw three branches. Branch 1, labeled "Oxygen present": into a mitochondrion, "Pyruvate oxidation → acetyl-CoA + CO2 + NADH" then "Krebs cycle and electron transport chain", with "NADH → NAD+" at the chain. Branch 2, labeled "No oxygen: muscle cells, red blood cells": "Lactate dehydrogenase" turns pyruvate into "Lactate", with "NADH → NAD+" on that arrow and no CO2. Branch 3, labeled "No oxygen: yeast": "Pyruvate decarboxylase" releases "CO2" to give "Acetaldehyde", then "Alcohol dehydrogenase" gives "Ethanol", with "NADH → NAD+" on that second arrow. Draw a return arrow from each NAD+ back to glycolysis labeled "NAD+ recycled".
Use this example
Prompt
Create a blank glycolysis worksheet that is the same drawing as a labeled two-column glycolysis diagram with the intermediate names removed. Keep the pale "Cytoplasm" panel, the left column "Energy investment phase (steps 1–5)" and right column "Energy payoff phase (steps 6–10), × 2", every arrow numbered 1–10 with its enzyme name, every ATP, ADP, NAD+, NADH, and H2O side arrow, the "2 ×" prefixes in the right column, and the summary box. Keep "Glucose (6C)" printed at the top. Replace the other names with numbered empty answer lines: 1 glucose-6-phosphate, 2 fructose-6-phosphate, 3 fructose-1,6-bisphosphate, 4 dihydroxyacetone phosphate, 5 glyceraldehyde-3-phosphate (both the box after the split and the first box of the right column), 6 1,3-bisphosphoglycerate, 7 3-phosphoglycerate, 8 2-phosphoglycerate, 9 phosphoenolpyruvate, 10 pyruvate. Add a word bank: "glucose-6-phosphate, fructose-6-phosphate, fructose-1,6-bisphosphate, dihydroxyacetone phosphate, glyceraldehyde-3-phosphate, 1,3-bisphosphoglycerate, 3-phosphoglycerate, 2-phosphoglycerate, phosphoenolpyruvate, pyruvate".
Blank worksheet
Use this example
How to make a labeled glycolysis diagram
1
Pick the detail and the labels
Choose a simple two-phase drawing, all ten steps with enzymes, or full detail with structures and carbon counts, then choose labeled, numbered with a key, or a blank worksheet. Ask for pyruvate fates or regulation only if you need them.
2
Generate the pathway
The generator keeps the ten intermediates in order in the cytoplasm, puts ATP at steps 1, 3, 7, and 10 and NADH at step 6, doubles the payoff phase after the split, and totals net 2 ATP, 2 NADH, and 2 pyruvate.
3
Check it, then export
Read the intermediates in order, check that 3-phosphoglycerate comes before 2-phosphoglycerate and that no CO₂ or oxygen appears, then download the PNG — or make the matching worksheet or answer key from the same image.
Glycolysis key facts
Location
Cytoplasm (cytosol), in every cell
Oxygen needed
No — glycolysis is anaerobic
Steps
10: investment phase 1–5, payoff phase 6–10
ATP
2 used (steps 1, 3), 4 made (steps 7, 10), net 2
NADH
2 per glucose, at step 6
End product
2 pyruvate, 3 carbons each
Main control point
Step 3, phosphofructokinase-1 (PFK-1)
Irreversible steps
1, 3, and 10: hexokinase, PFK-1, pyruvate kinase
What is glycolysis, and what does a glycolysis chart show?
Glycolysis is the ten-step pathway that breaks one molecule of glucose, with six carbons, into two molecules of pyruvate, with three carbons each, while capturing a small amount of energy as ATP and NADH. The name means “sugar splitting”. It runs in the cytoplasm of practically every living cell, from bacteria to human neurons, and it uses no oxygen, which is why it is thought to be one of the oldest metabolic pathways and why it still supplies energy when oxygen runs short.
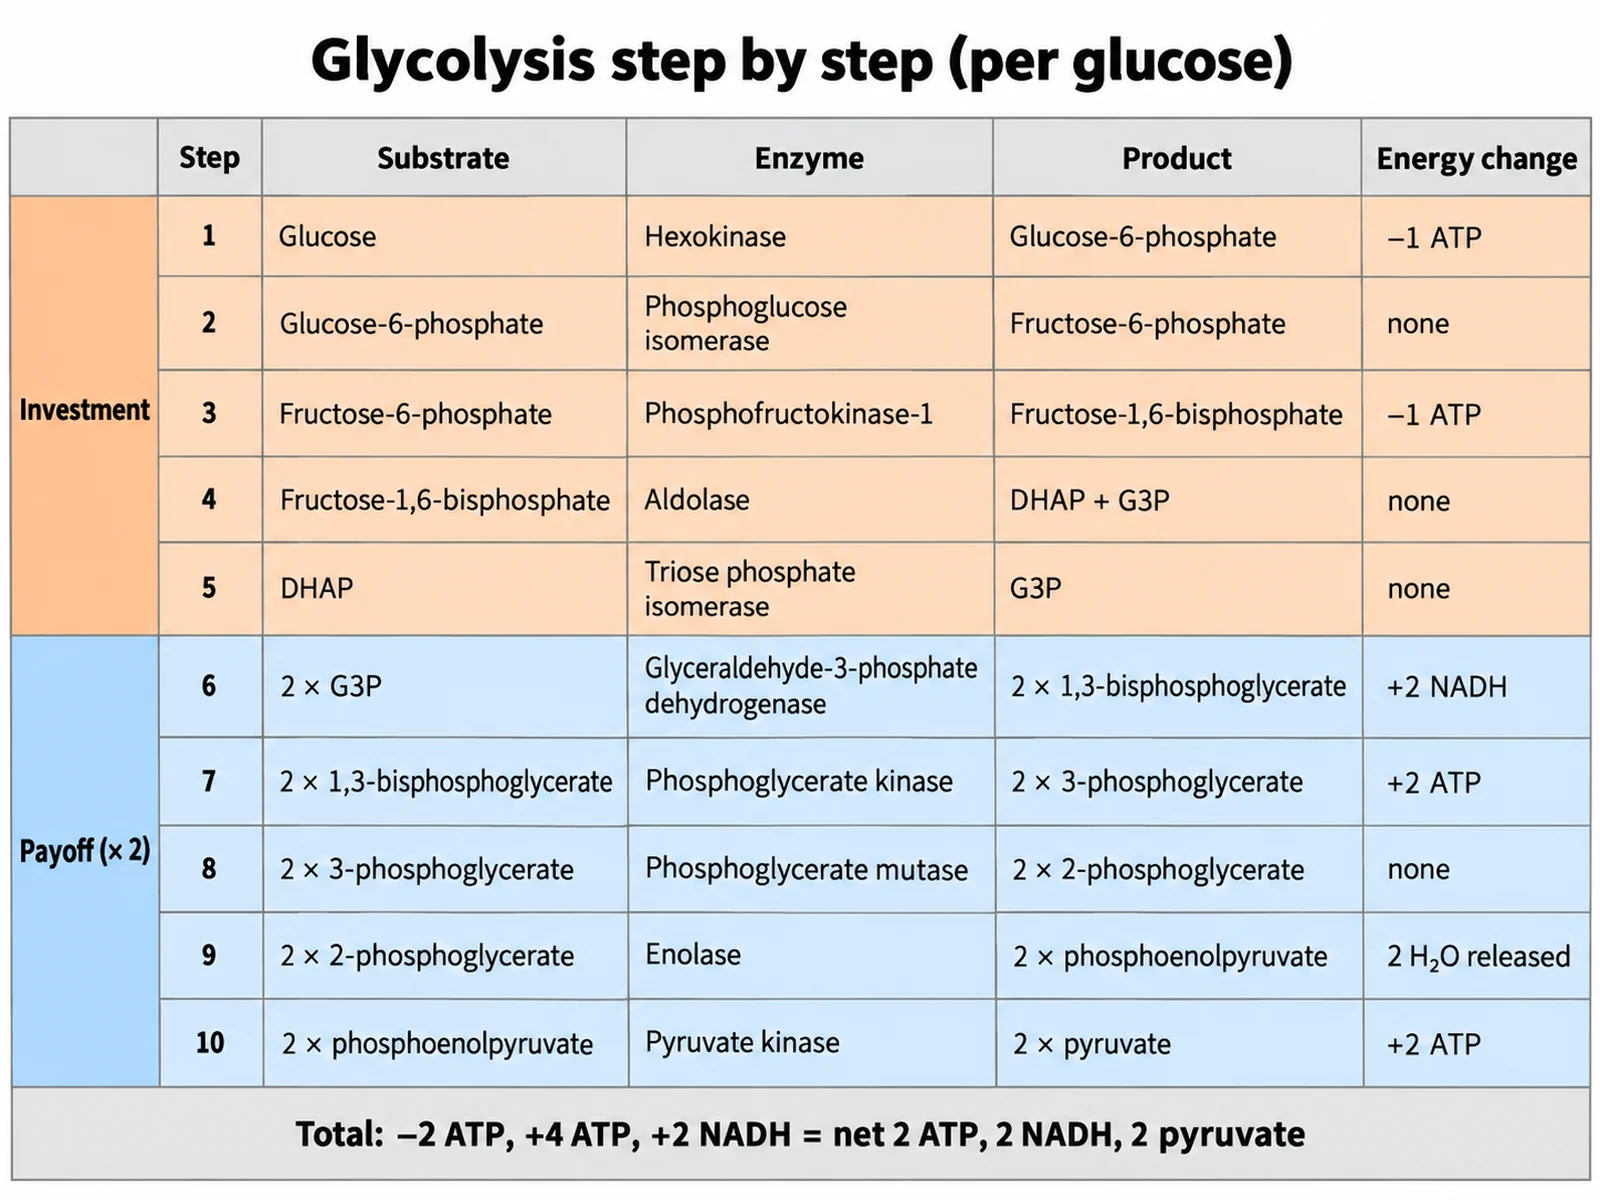
A glycolysis chart or diagram has to show three things clearly. The sequence: ten intermediates in a fixed order, each made from the one before by a named enzyme. The split: at step 4 the six-carbon sugar breaks into two three-carbon sugars, so everything after that happens twice per glucose. And the energy bookkeeping: 2 ATP spent at the start, 4 ATP and 2 NADH made at the end, for a net yield of 2 ATP, 2 NADH, and 2 pyruvate. Get any of those three wrong and the diagram teaches the wrong numbers, however neat it looks.
Glycolysis diagram labeled: what to label
The setting: the cytoplasm (cytosol), written on the figure or shown as a shaded panel.
The two phases: energy investment (steps 1–5) and energy payoff (steps 6–10, which run twice).
The ten intermediates in order: glucose, glucose-6-phosphate, fructose-6-phosphate, fructose-1,6-bisphosphate, dihydroxyacetone phosphate (DHAP) and glyceraldehyde-3-phosphate (G3P), 1,3-bisphosphoglycerate, 3-phosphoglycerate, 2-phosphoglycerate, phosphoenolpyruvate (PEP), and pyruvate.
The ten enzymes on the arrows: hexokinase, phosphoglucose isomerase, phosphofructokinase-1, aldolase, triose phosphate isomerase, glyceraldehyde-3-phosphate dehydrogenase, phosphoglycerate kinase, phosphoglycerate mutase, enolase, and pyruvate kinase.
ATP used: one at step 1 and one at step 3.
NADH made: at step 6, one per G3P, two per glucose.
ATP made: at steps 7 and 10, two at each per glucose.
Water released: at step 9, enolase.
The summary: per glucose, 2 ATP used, 4 ATP made, net 2 ATP, 2 NADH, 2 pyruvate.
The energy investment phase: steps 1 to 5
Glycolysis begins by spending energy. In step 1, hexokinase transfers a phosphate from ATP to glucose, making glucose-6-phosphate. The added phosphate gives the sugar a negative charge, which traps it inside the cell because there is no transporter to carry it back out. In step 2, phosphoglucose isomerase rearranges glucose-6-phosphate into its isomer fructose-6-phosphate, moving the carbonyl group so that the molecule can later be cut into two equal halves.
Step 3 is the most important reaction in the pathway. Phosphofructokinase-1 (PFK-1) uses a second ATP to add a phosphate to the other end of the sugar, giving fructose-1,6-bisphosphate. This is the committed step: once a sugar reaches it, it is going through glycolysis. In step 4, aldolase cuts fructose-1,6-bisphosphate into two three-carbon sugars, dihydroxyacetone phosphate (DHAP) and glyceraldehyde-3-phosphate (G3P). Only G3P can continue down the pathway, so in step 5 triose phosphate isomerase converts DHAP into a second G3P. At the end of the investment phase the cell has spent 2 ATP and holds two molecules of G3P.
The energy payoff phase: steps 6 to 10
Every payoff step happens twice, once for each G3P. In step 6, glyceraldehyde-3-phosphate dehydrogenase oxidises G3P and, at the same time, attaches an inorganic phosphate from the cytoplasm, not from ATP, to make 1,3-bisphosphoglycerate. The electrons removed reduce NAD⁺ to NADH. This is the only oxidation in glycolysis and the only place NADH is made: two per glucose.
In step 7, phosphoglycerate kinase transfers the high-energy phosphate from 1,3-bisphosphoglycerate to ADP, making ATP and 3-phosphoglycerate. With two of these per glucose, the cell has now earned back the two ATP it invested. In step 8, phosphoglycerate mutase moves the remaining phosphate from carbon 3 to carbon 2, giving 2-phosphoglycerate. In step 9, enolase removes a molecule of water, creating phosphoenolpyruvate (PEP), whose phosphate bond holds a great deal of energy. In step 10, pyruvate kinase transfers that phosphate to ADP, making a second ATP per three-carbon molecule and leaving pyruvate. Steps 7 and 10 are examples of substrate-level phosphorylation: ATP made by moving a phosphate directly from a substrate, with no electron transport chain involved.
Glycolysis chart totals: counting carbons, ATP, and NADH
The easiest way to check a glycolysis chart is to count. Carbons first: glucose has six; fructose-1,6-bisphosphate still has six; after step 4 there are two three-carbon molecules, and they stay three-carbon all the way to pyruvate. Six carbons go in and six come out as two pyruvate, so no CO₂ is released anywhere in glycolysis.
Then energy. Investment phase: −1 ATP at step 1, −1 ATP at step 3, total −2 ATP. Payoff phase, counted twice: +2 NADH at step 6, +2 ATP at step 7, +2 ATP at step 10, total +4 ATP and +2 NADH. Net per glucose: 2 ATP, 2 NADH, 2 pyruvate, and 2 water molecules from step 9. The overall equation is glucose + 2 NAD⁺ + 2 ADP + 2 Pᵢ → 2 pyruvate + 2 NADH + 2 H⁺ + 2 ATP + 2 H₂O. If a chart’s totals do not come out to exactly this, one of its steps is wrong — most often the payoff phase has been counted once, or an extra ATP has been drawn at step 2 or step 6.
How to draw glycolysis: an easy drawing and a simple version
A drawing of glycolysis does not have to show all ten molecules to be useful. For a quick, easy glycolysis drawing, draw glucose at the top as a six-sided ring labeled “6C”, one arrow running down with “2 ATP in” beside it, a fork halfway down to show the sugar splitting in two, and two arrows continuing to “pyruvate, 3C” at the bottom with “4 ATP out” and “2 NADH out” beside them. Bracket the top half as the investment phase and the bottom half as the payoff phase, write “net 2 ATP” beside the whole thing, and shade the background as the cytoplasm. That is the glycolysis simple drawing most introductory classes ask for.
To draw glycolysis in full, use two columns rather than one long line: steps 1 to 5 down the left from glucose to the two G3P, and steps 6 to 10 down the right from G3P to pyruvate, with “× 2” at the top of the right column. Put the enzyme name on each arrow and the ATP, NADH, and water as short side arrows. A two-column layout fits on one page, keeps the split visible, and matches the way most textbooks print the pathway.
Glycolysis in a cellular respiration diagram
In a cellular respiration diagram, glycolysis is the first of four stages and the only one outside the mitochondrion. It sits in the cytoplasm and sends two pyruvate across the two mitochondrial membranes into the matrix. There, pyruvate oxidation turns each pyruvate into acetyl-CoA, releasing one CO₂ and making one NADH; the Krebs cycle oxidises the acetyl groups completely to CO₂, making more NADH, FADH₂, and ATP; and oxidative phosphorylation on the inner membrane uses the electrons carried by NADH and FADH₂ to make most of the cell’s ATP. Glycolysis contributes only a net 2 ATP of the roughly 30–32 that current textbooks give for one glucose, but it is the gateway: every glucose that is respired goes through it first. A cellular respiration glycolysis diagram that draws glycolysis inside the mitochondrion, or that releases CO₂ during glycolysis, has merged it with the stages that follow.
What happens to pyruvate: aerobic respiration and fermentation
Pyruvate is a fork in the road. When oxygen is available and the cell has mitochondria, pyruvate is carried into the mitochondrion and oxidised to acetyl-CoA, and the NADH made in glycolysis passes its electrons to the electron transport chain, which regenerates NAD⁺. When oxygen is short, that route backs up, and the cell would run out of NAD⁺ for step 6 within moments if it had no alternative.
Fermentation is the alternative. In lactic acid fermentation, lactate dehydrogenase uses NADH to reduce pyruvate to lactate, regenerating NAD⁺; this happens in muscle working faster than its oxygen supply, in red blood cells, which have no mitochondria, and in the bacteria that make yogurt. In alcohol fermentation, yeast first remove a CO₂ from pyruvate with pyruvate decarboxylase, giving acetaldehyde, then reduce acetaldehyde to ethanol with alcohol dehydrogenase, regenerating NAD⁺. Neither fermentation makes any extra ATP; their only job is to keep glycolysis supplied with NAD⁺ so it can go on making its 2 ATP per glucose.
How glycolysis is regulated
Three steps of glycolysis — 1, 3, and 10 — release so much free energy that they are effectively irreversible in the cell, and these are the steps the cell uses to control the pathway. Phosphofructokinase-1, at step 3, is the main control point. It is inhibited when the cell has plenty of energy, signalled by high ATP and by citrate from the Krebs cycle, and activated when energy is low, signalled by AMP and ADP, and by fructose-2,6-bisphosphate, a regulator set by hormones such as insulin and glucagon in the liver. Hexokinase is inhibited by its own product, glucose-6-phosphate, and pyruvate kinase is regulated too; OpenStax calls both PFK and pyruvate kinase rate-limiting enzymes. When the liver makes glucose by gluconeogenesis, it bypasses exactly these three irreversible steps with different enzymes, which is why a regulation diagram marks them with one-way arrows.
Glycolysis vs gluconeogenesis
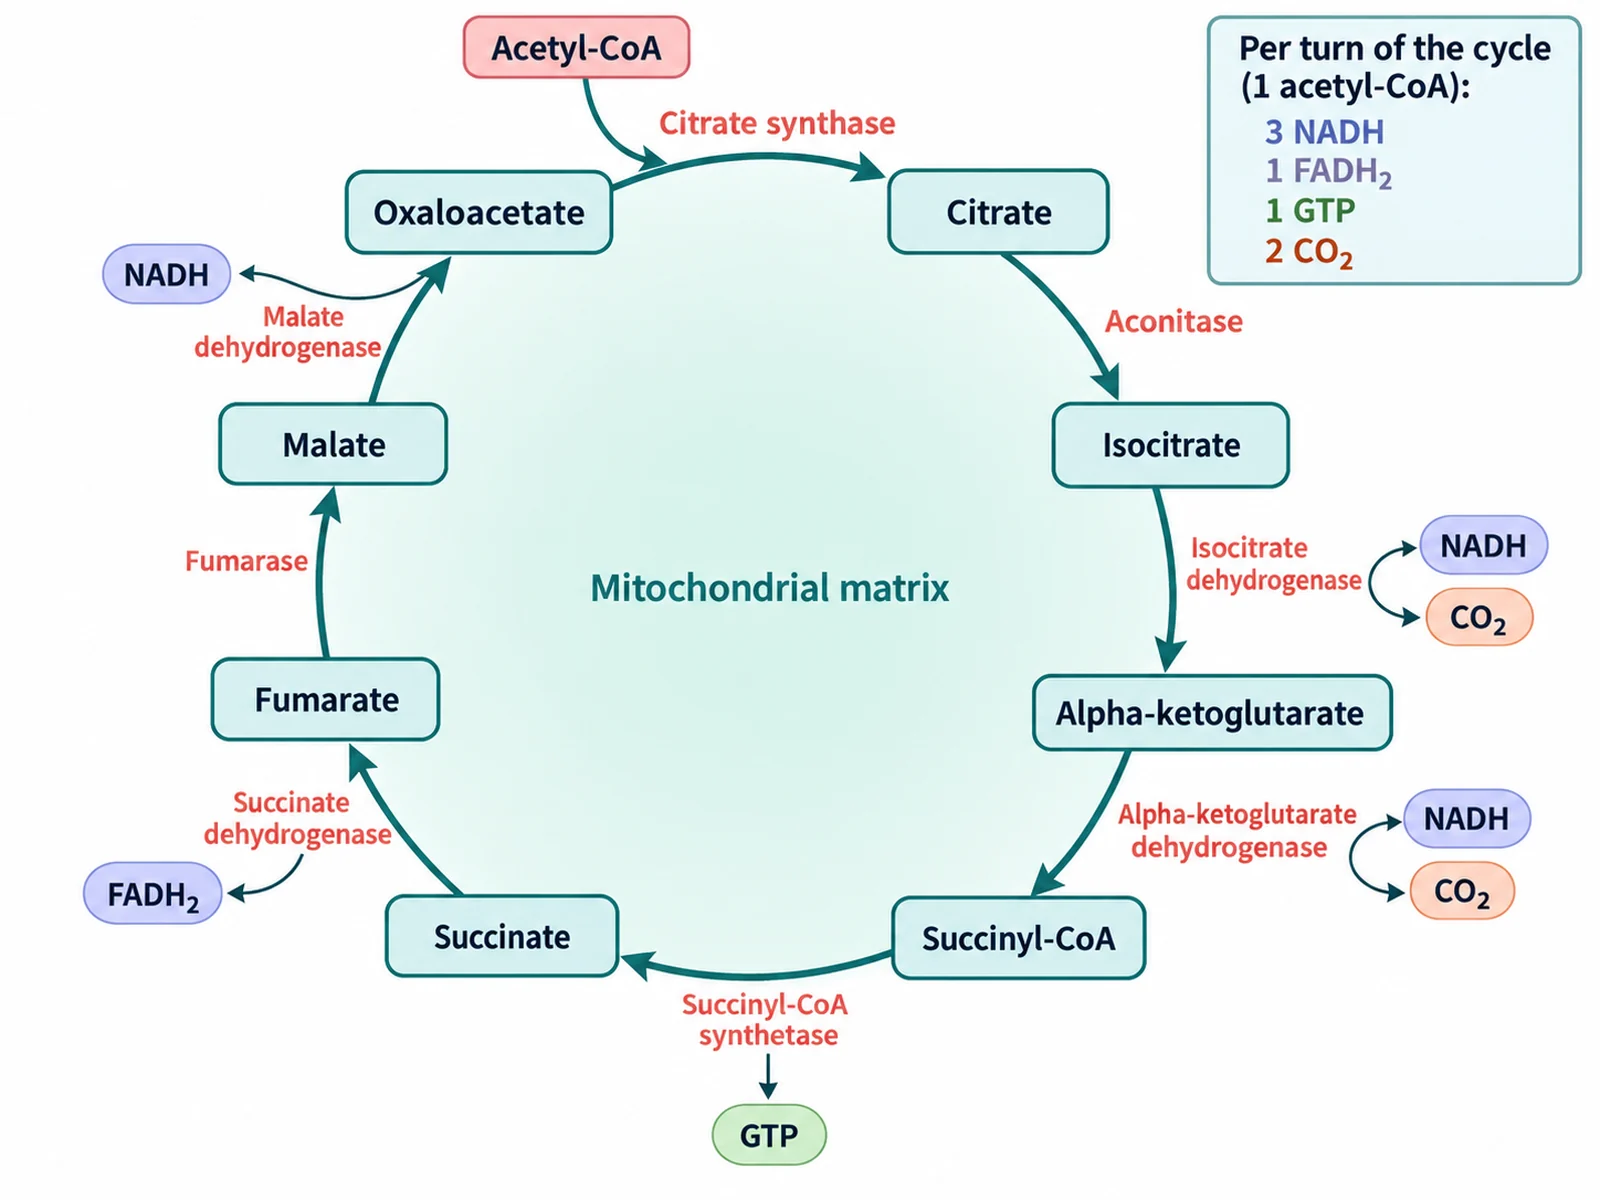
Gluconeogenesis is glycolysis run in the opposite direction — making glucose from pyruvate and other small molecules — and a diagram of one is often drawn beside the other. Seven of the ten glycolytic reactions are close enough to equilibrium that the same enzymes can run them backwards. The three irreversible steps cannot be reversed, so gluconeogenesis goes around them with its own enzymes: pyruvate carboxylase and PEP carboxykinase turn pyruvate back into phosphoenolpyruvate by way of oxaloacetate, fructose-1,6-bisphosphatase replaces phosphofructokinase-1, and glucose-6-phosphatase replaces hexokinase. Running uphill costs more than glycolysis earns: making one glucose from two pyruvate uses 4 ATP, 2 GTP, and 2 NADH. Gluconeogenesis happens mainly in the liver, with some in the kidney, and keeps blood glucose up between meals. Because the two pathways share most of their intermediates, the cell regulates them in opposite directions at the same three steps so that they do not run at full speed at the same time.
Why glycolysis matters in the body
Glycolysis yields only 2 ATP per glucose, but it is fast and needs no oxygen, which makes it essential in several places. Red blood cells have no mitochondria and depend on glycolysis for all of their ATP, ending in lactate. Sprinting muscle can make ATP by glycolysis far faster than its blood supply can deliver oxygen, so it produces lactate during intense exercise. The brain relies on a steady supply of glucose that is broken down by glycolysis before it is respired. Many cancer cells take up large amounts of glucose and run glycolysis at a high rate even when oxygen is present, a pattern called the Warburg effect, which is why scans that trace a radioactive glucose analogue can locate tumours. And inherited deficiencies of glycolytic enzymes, of which pyruvate kinase deficiency is the most common, cause anaemia because red blood cells cannot make enough ATP to survive.
Glycolysis worksheet: blank charts and answer keys
A glycolysis worksheet works best when the blank version and the answer key are the same drawing. Generate the labeled chart first, then use the blank edit to erase the intermediate names and leave numbered answer lines in the same boxes, or start from the blank worksheet setting and use the answer-key edit to fill the lines back in. Keep the enzyme names, the ATP and NADH side arrows, and the summary printed if students only need to recall the intermediates; switch to the numbered-with-key setting for a labeling quiz where the key is printed on the same page; and add a word bank for younger or less confident groups. Because the numbering follows pathway order, the worksheet doubles as a sequencing exercise. For a harder version, blank the enzyme names as well and ask students to match each enzyme to its step.
Drawing of glycolysis: what to check before you use one
Location: cytoplasm, never the mitochondrion.
Oxygen: none used, none drawn going in.
Order: 3-phosphoglycerate before 2-phosphoglycerate, phosphoenolpyruvate before pyruvate.
ATP: used at steps 1 and 3, made at steps 7 and 10 — nowhere else.
NADH: made at step 6 only, and no NADPH or FADH₂ anywhere.
Doubling: every payoff step marked twice per glucose.
Totals: net 2 ATP, 2 NADH, 2 pyruvate, and no CO₂.
Most common glycolysis diagram mistakes
These are the errors that turn up most often in student charts, in images found online, and in AI output. Check for each one before a diagram goes on a worksheet.
MistakeCorrect
MistakeGlycolysis is drawn inside the mitochondrion.
CorrectAll ten steps run in the cytoplasm (cytosol). Only pyruvate goes on into the mitochondrion.
MistakeOxygen is shown entering glycolysis.
CorrectGlycolysis is anaerobic: no step uses O₂. It runs with or without oxygen.
MistakeThe yield is written as 4 ATP.
Correct4 ATP are made but 2 are spent, so the net yield is 2 ATP per glucose.
MistakeSteps 6 to 10 are drawn and counted once.
CorrectAfter the split at step 4 there are two G3P, so every payoff step runs twice per glucose.
MistakeATP is drawn at step 2 or step 6.
CorrectATP is used at steps 1 and 3 and made at steps 7 and 10. Step 6 makes NADH.
MistakeNADPH or FADH₂ appears in the pathway.
CorrectGlycolysis makes NADH only. FADH₂ belongs to the Krebs cycle; NADPH to photosynthesis.
MistakeA CO₂ arrow leaves one of the steps.
CorrectGlycolysis releases no CO₂. The first CO₂ comes later, in pyruvate oxidation or alcohol fermentation.
Mistake2-phosphoglycerate comes before 3-phosphoglycerate.
CorrectStep 7 makes 3-phosphoglycerate; step 8 moves the phosphate to make 2-phosphoglycerate.
What happens to pyruvate: aerobic respiration vs fermentation
Glycolysis is the same in all three. What changes is what the cell does with the two pyruvate and the two NADH afterwards.
Aerobic respiration
Lactic acid fermentation
Alcohol fermentation
Oxygen needed
Yes, as the final electron acceptor
No
No
Where pyruvate goes
Into the mitochondrion: pyruvate oxidation, then the Krebs cycle
Stays in the cytoplasm
Stays in the cytoplasm
End products
CO₂ and H₂O
Lactate
Ethanol and CO₂
CO₂ released after glycolysis
Yes
No
Yes, by pyruvate decarboxylase
How NAD⁺ is regenerated
NADH is oxidised by the electron transport chain
Lactate dehydrogenase reduces pyruvate to lactate
Alcohol dehydrogenase reduces acetaldehyde to ethanol
ATP per glucose
About 30–32 in current textbooks
2 (from glycolysis only)
2 (from glycolysis only)
Where it happens
Most eukaryotic cells, many bacteria
Muscle short of oxygen, red blood cells, yogurt bacteria
Yeast and some bacteria
Glycolysis Diagram FAQ
The ten reactions that split one glucose into two pyruvate, in order, with the intermediate after each step and the enzyme on each arrow. It also marks where energy carriers cross the pathway: ATP used at steps 1 and 3, NADH made at step 6, and ATP made at steps 7 and 10. A good glycolysis chart divides the steps into the energy investment phase (1–5) and the energy payoff phase (6–10), shows the six-carbon sugar splitting into two three-carbon molecules at step 4, and ends with a summary of 2 ATP net, 2 NADH, and 2 pyruvate per glucose, all in the cytoplasm.
Generate respiration and photosynthesis pathways, mitochondria and cell diagrams, and worksheet-ready biology illustrations with the same SciFigure AI workflow.