Gas Chromatography Diagram and GC-MS Schematic Maker
Describe the instrument and get a labeled gas chromatography diagram: carrier gas cylinder and regulator, split/splitless injector, capillary column coiled in the oven, an FID, TCD or mass spectrometer, and the data system with its chromatogram. Draw the GC-MS interface, the ion source, quadrupole and detector under vacuum, or a blank worksheet with a matching answer key.
GC, GC-FID and GC-MSParts in the right orderWorksheet + answer key
Checked against analytical chemistry texts
Worksheet + answer key pairs
Print-ready PNG
AI Gas Chromatography Diagram Maker
Pick the figure and detector or describe your own instrument, then choose labels, style and level.
851 / 2000 characters
Generate a publication-ready PNG from your description.
Preview
GC and GC-MS Diagram Example Previews
Target aspect ratio: 16:9
Sample previews. Describe your instrument to generate your own gas chromatography diagram.
Gas Chromatography Diagram Examples
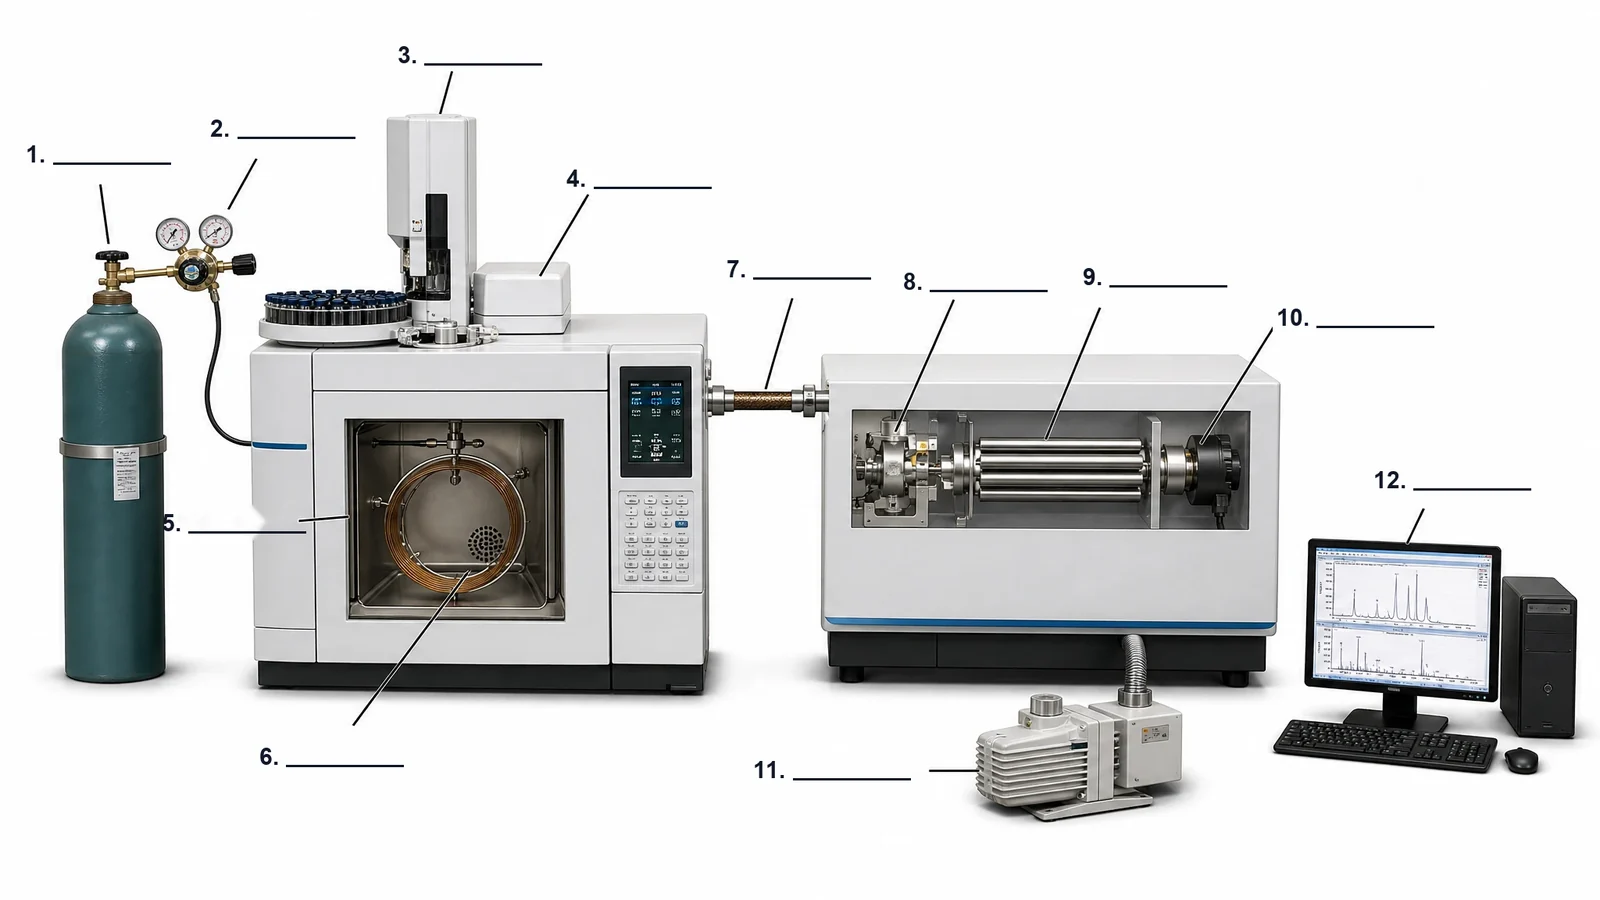
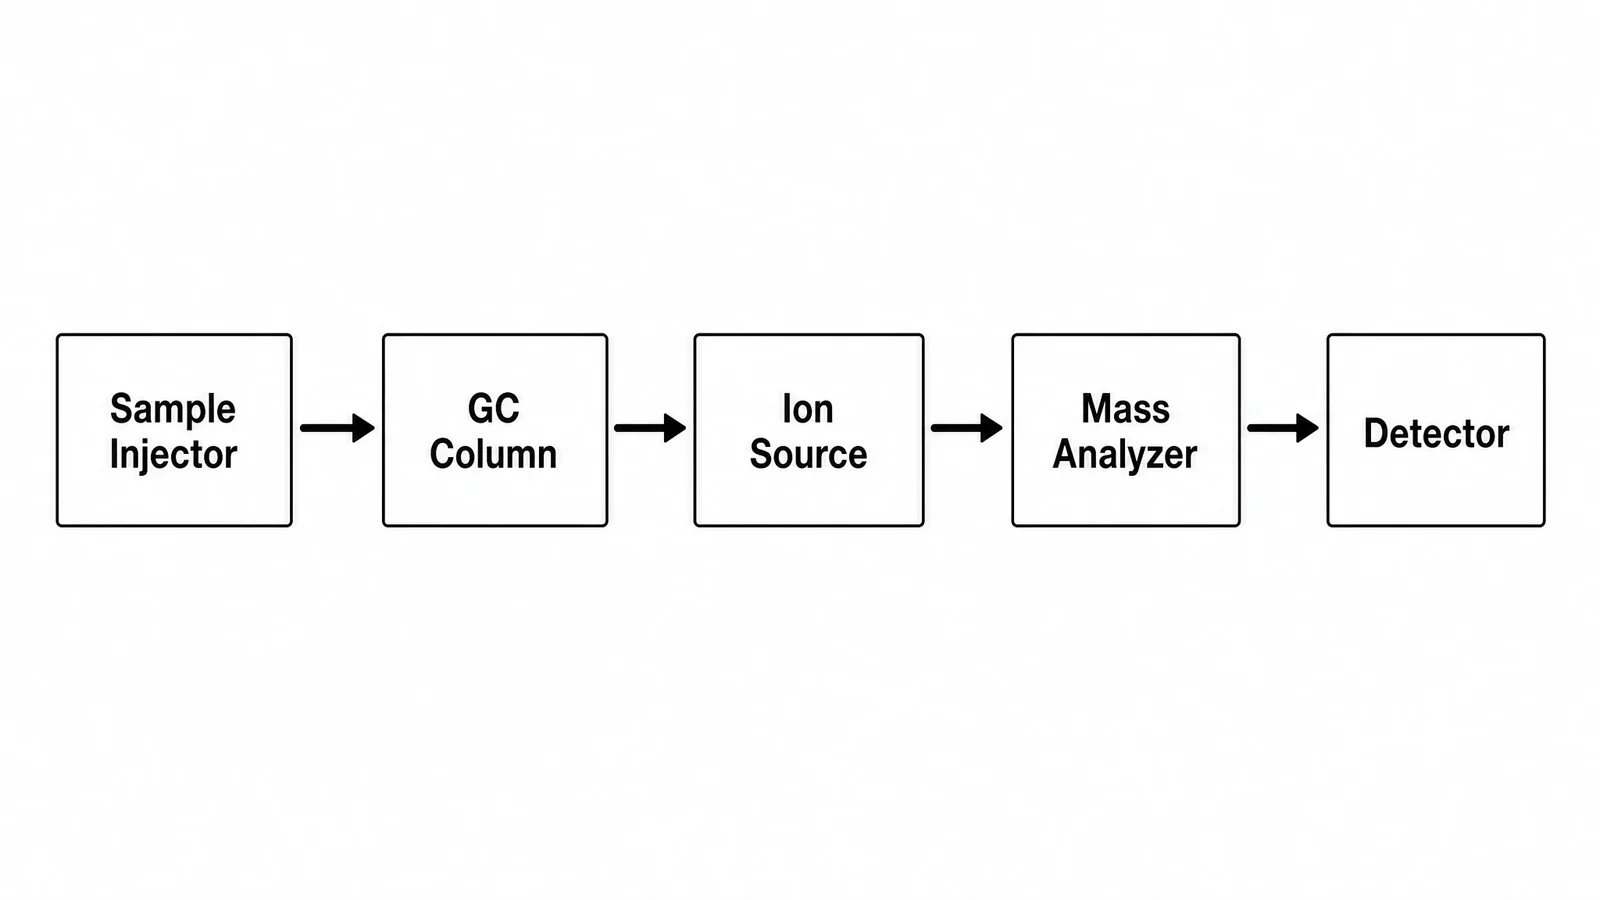
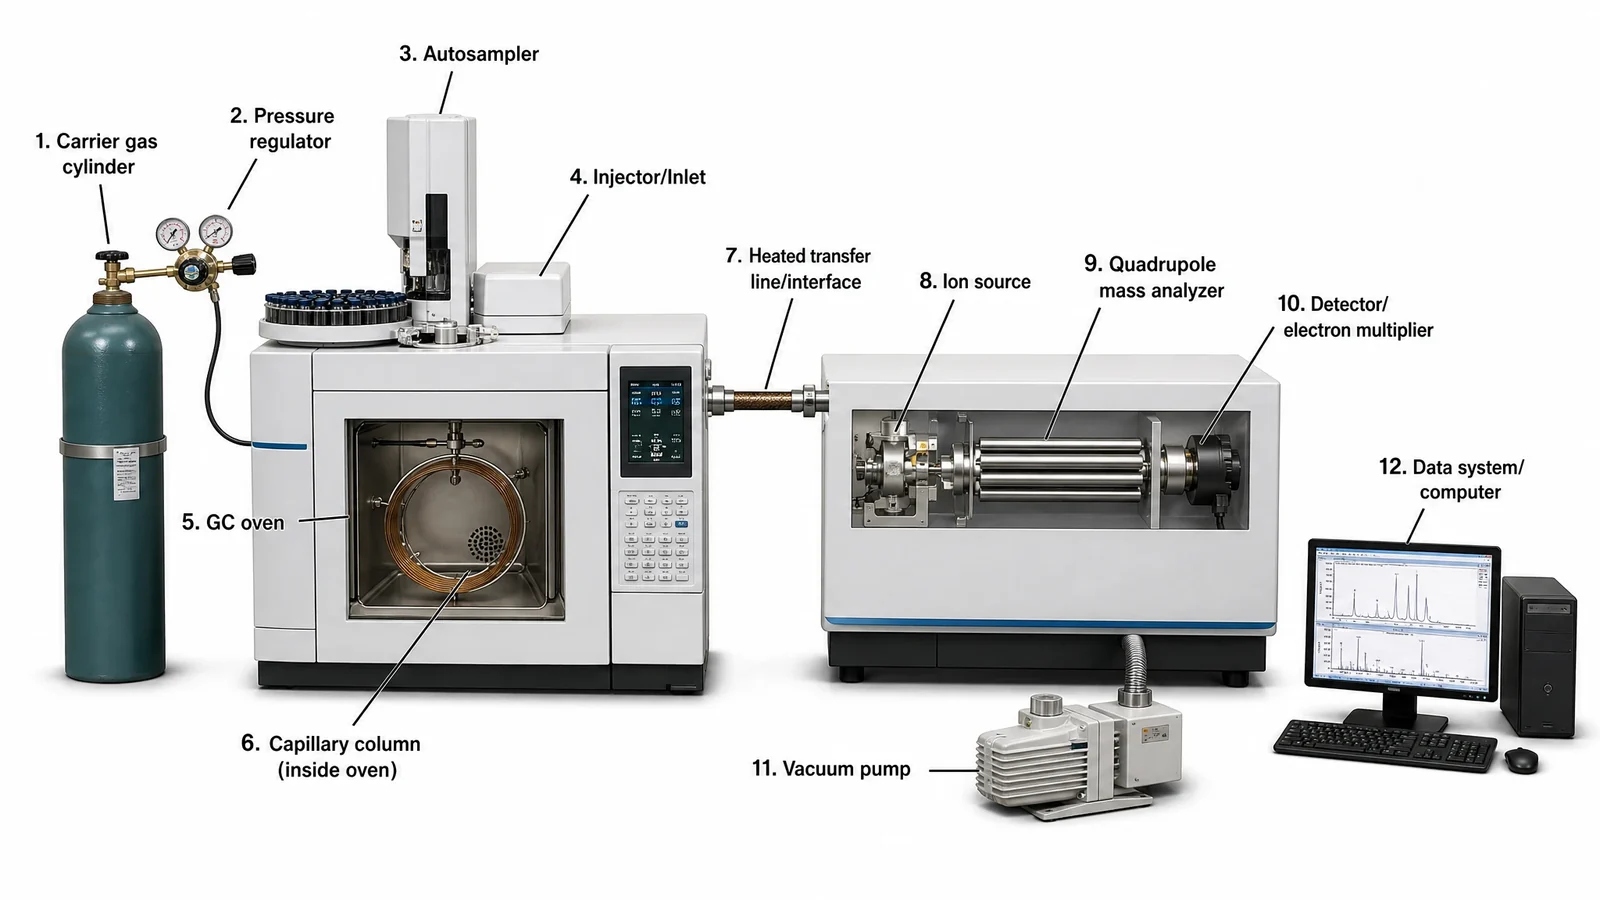
A labeled GC-MS instrument with all twelve parts in flow order, the same drawing as a blank worksheet, and a five-box GC-MS block diagram for notes.
Prompt
Create a labeled GC-MS instrument diagram on a white background, drawn as a realistic, softly shaded benchtop system with no brand names. On the left, a green carrier gas cylinder with a two-stage pressure regulator feeds the gas chromatograph through a hose. On top of the gas chromatograph, an autosampler tray of vials sits beside the injector. A window in the GC oven shows the capillary column coiled on its cage inside the oven. A heated transfer line leads from the oven into the mass spectrometer, whose cut-away side shows the ion source, the four-rod quadrupole mass analyzer and the electron multiplier detector in a row, with a rotary vacuum pump connected below by a ribbed hose. On the right, a computer shows a chromatogram and a mass spectrum. Number and name each part: 1 Carrier gas cylinder, 2 Pressure regulator, 3 Autosampler, 4 Injector/Inlet, 5 GC oven, 6 Capillary column (inside oven), 7 Heated transfer line/interface, 8 Ion source, 9 Quadrupole mass analyzer, 10 Detector/electron multiplier, 11 Vacuum pump, 12 Data system/computer.
Create a blank GC-MS labeling worksheet on a white background from a realistic, softly shaded benchtop GC-MS with no brand names: a carrier gas cylinder with a pressure regulator, a gas chromatograph with an autosampler and injector on top and a window showing the capillary column coiled inside the oven, a heated transfer line into a cut-away mass spectrometer with its ion source, quadrupole and electron multiplier detector, a rotary vacuum pump below it, and a computer on the right. Twelve thin leader lines end at numbered empty answer lines, numbered 1 to 12 in the order the gas and sample travel, from the cylinder to the computer. No part names anywhere on the image.
Create a simple GC-MS block diagram on a white background in black and white. Draw five plain rectangles in one row from left to right, joined by thick black arrows pointing right: "Sample Injector", "GC Column", "Ion Source", "Mass Analyzer" and "Detector". Bold black sans-serif text, no pictures of the hardware, no colour.
Block diagramMass spectrometer (MS)Exam-style black and whiteHigh school
Use this example
Prompt
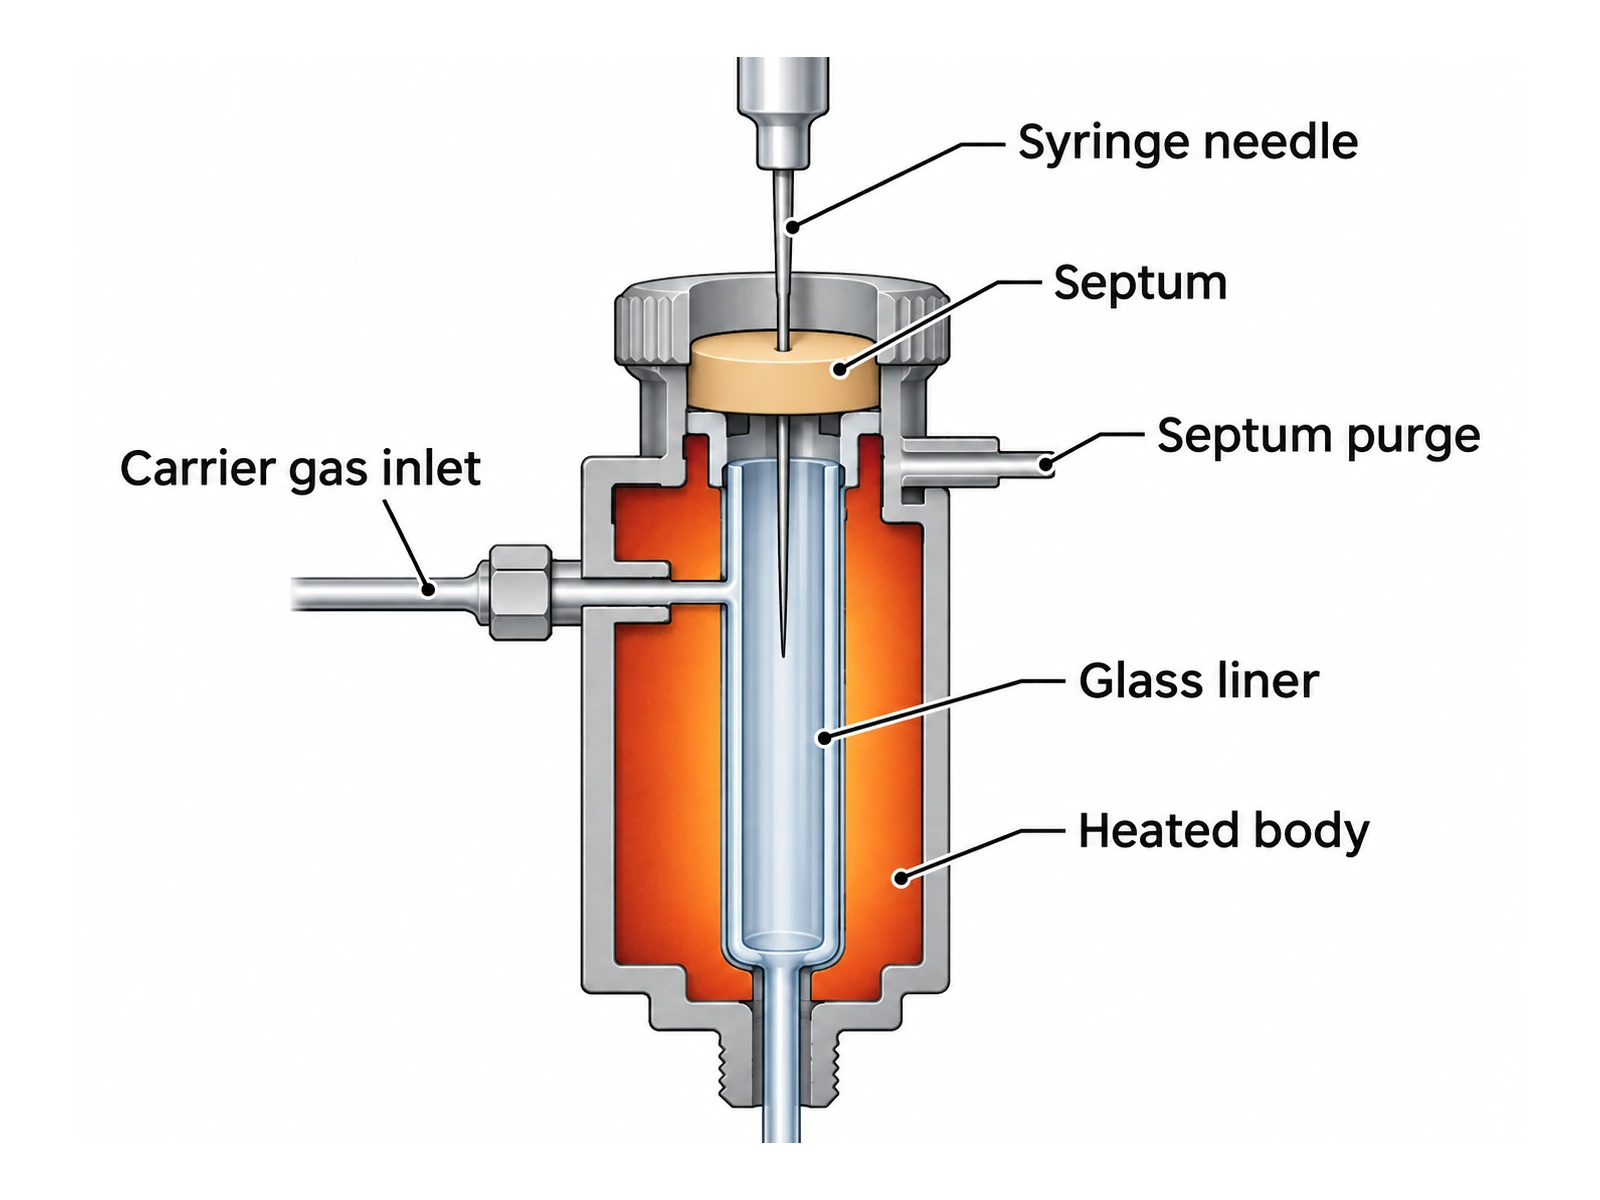
Create a labeled cross-section of a gas chromatography injection port on a white background: a "Syringe needle" pierces the "Septum" in the cap and enters a "Glass liner" inside a "Heated body" (warm orange); the "Carrier gas inlet" enters the side, the "Septum purge" line leaves just under the septum, and the capillary column leaves the bottom of the liner into the oven.
Split/splitless injectorFlame ionization (FID)Colour for slides
Use this example
Prompt
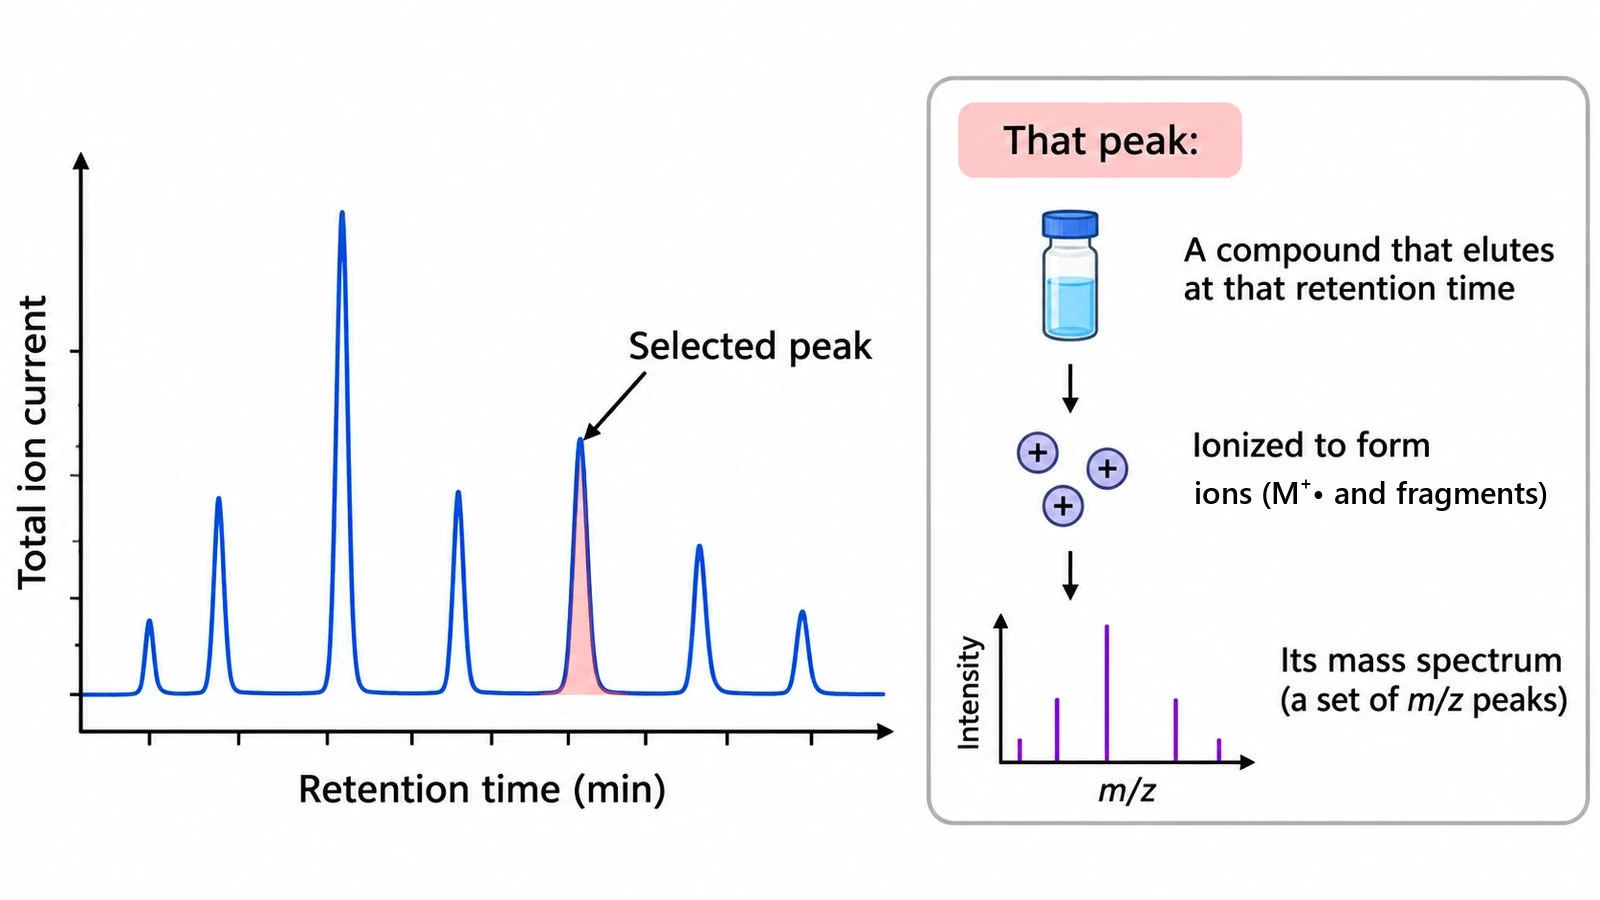
Create a GC-MS data figure on a white background. Left: a total ion chromatogram, "Total ion current" against "Retention time (min)", with seven sharp peaks and one shaded and labeled "Selected peak". Right: a boxed panel headed "That peak:" with a vial and the text "A compound that elutes at that retention time", an arrow to "Ionized to form ions (M+• and fragments)", and an arrow to a small bar spectrum, "Intensity" against "m/z", labeled "Its mass spectrum (a set of m/z peaks)". No compound names or m/z values.
Chromatogram and spectrumMass spectrometer (MS)Colour for slides
Use this example
Prompt
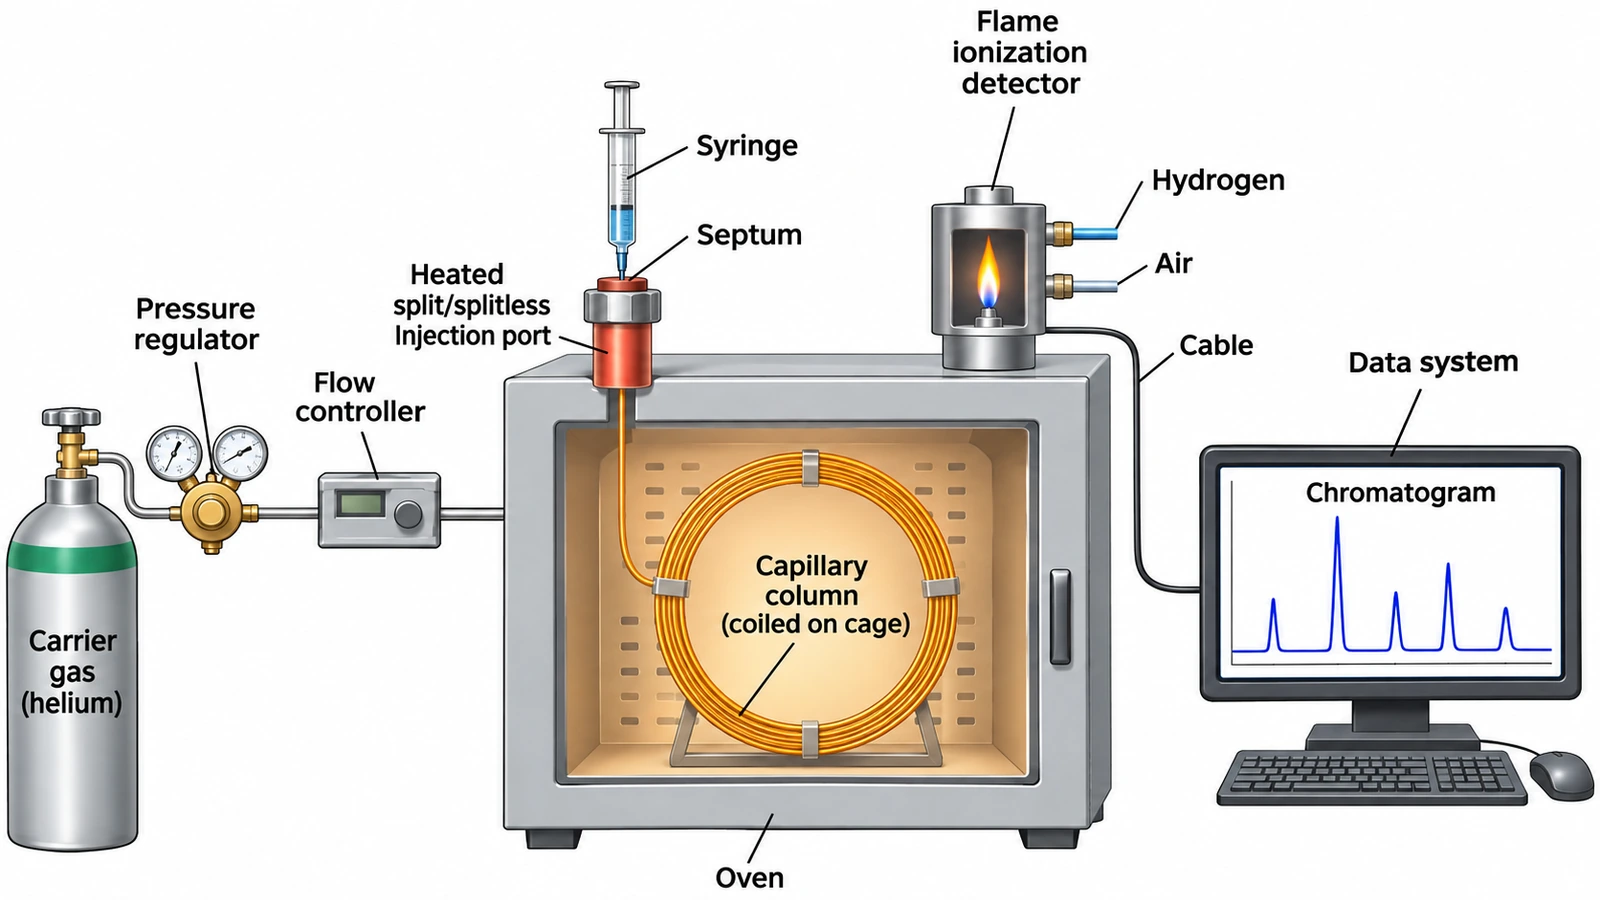
Create a labeled GC-FID instrument schematic on a white background, left to right: "Carrier gas (helium)" cylinder, "Pressure regulator", "Flow controller", a "Heated split/splitless injection port" with "Septum" and "Syringe" on top of the "Oven", a "Capillary column (coiled on cage)" inside the oven, a "Flame ionization detector" on top of the oven with "Hydrogen" and "Air" inlets and a blue flame, and a "Cable" to a "Data system" showing a "Chromatogram". No temperature gradient across the oven, no column outside the oven.
Flame ionization (FID)Colour for slides
Use this example
Prompt
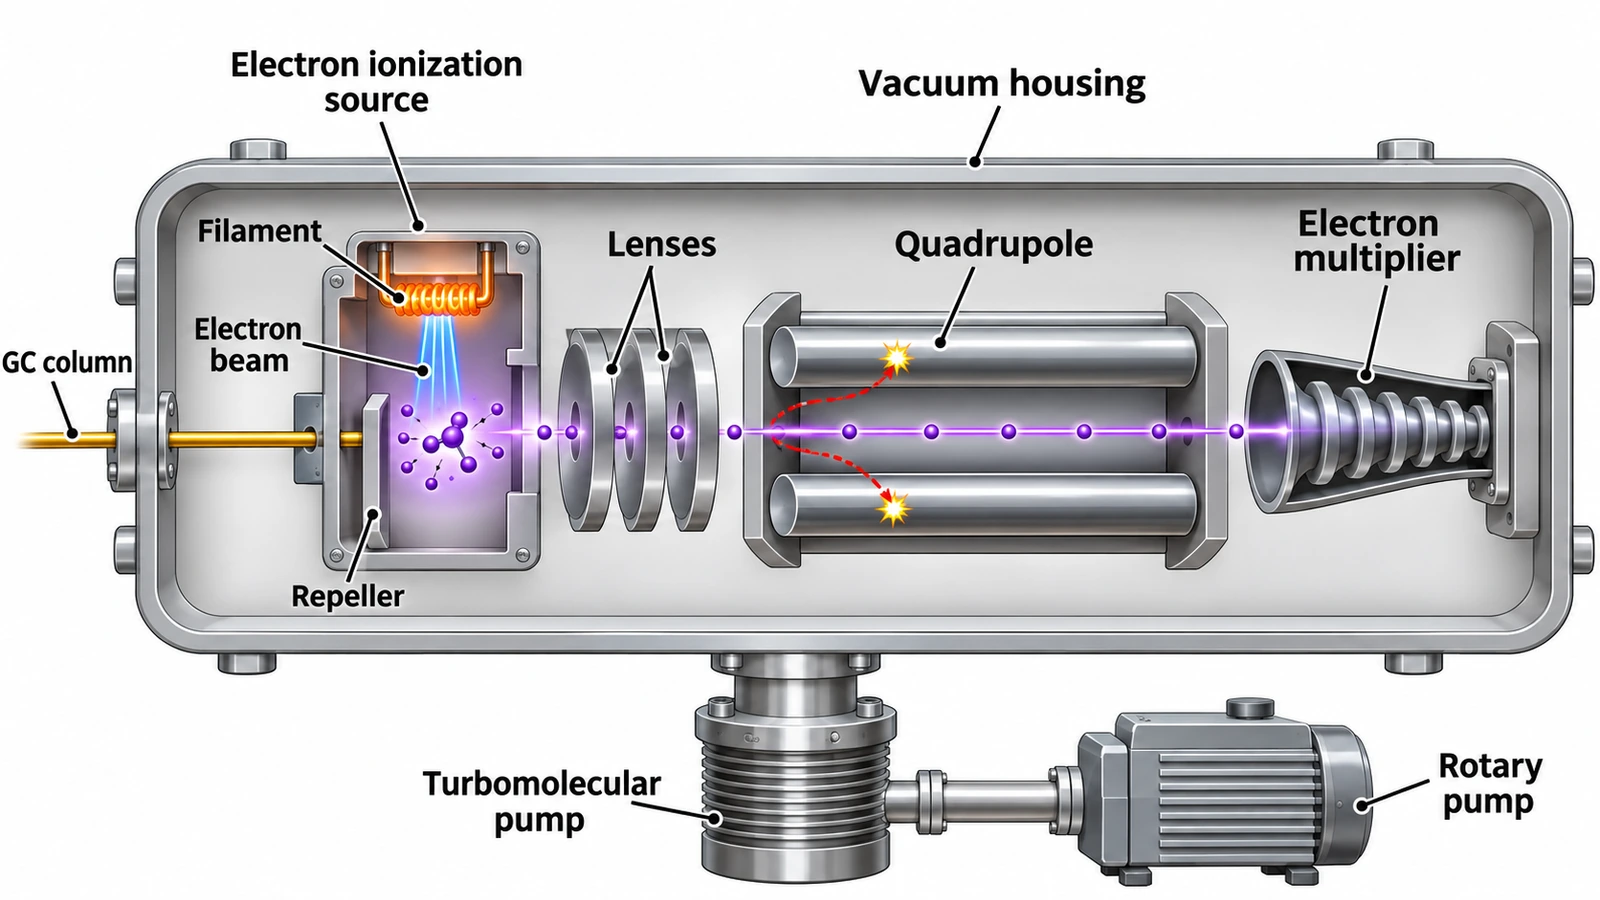
Create a labeled cutaway of a GC-MS mass spectrometer on a white background inside one "Vacuum housing": the "GC column" enters an "Electron ionization source" with "Filament", "Electron beam" and "Repeller"; ions pass through "Lenses" into a four-rod "Quadrupole", where one ion path passes straight through and other ions curve into the rods; the transmitted ions reach an "Electron multiplier". Below, a "Turbomolecular pump" backed by a "Rotary pump". No fragmentation inside the quadrupole.
Mass spectrometer close-upMass spectrometer (MS)Realistic instrument
Use this example
How to make a gas chromatography diagram
1
Pick the figure, detector, and labels
Choose a full instrument schematic, a block diagram, a GC-MS system, a close-up of the mass spectrometer or the injector, or the chromatogram and mass spectrum. Pick FID, TCD, ECD or MS, then labeled, numbered with a key, a blank worksheet, or a worksheet with a word bank.
2
Generate the instrument
The generator keeps the parts in flow order from the gas cylinder to the data system, puts the column inside a uniformly heated oven, draws each detector the way it is built, and puts the mass spectrometer under vacuum. It labels only what you ask for and invents no settings.
3
Make the answer key, check, and export
For a worksheet, make the answer key from the same result so the numbers match. Check the order of the parts, the oven, the carrier gas and the vacuum against the mistakes list, then download the PNG for a lab handout, a lecture slide or a methods figure.
Gas chromatography key facts
Flow order
Carrier gas → injector → column in oven → detector → data system
Carrier gas (mobile phase)
Helium, hydrogen or nitrogen, from a cylinder
Common capillary column
30 m long, 0.25 mm inner diameter, 0.25 µm film
Oven
One temperature at a time, isothermal or programmed
Split injection
Only a fraction of the sample reaches the column
Splitless injection
Nearly all of the sample reaches the column; for trace analysis
FID
Hydrogen–air flame; responds to organic compounds
TCD
Universal and non-destructive, less sensitive
GC-MS ion source
Electron ionization, standard at 70 eV
Quadrupole
Four rods, DC + RF voltages, one m/z at a time
Mass spectrometer
Always under high vacuum
Retention time
Injection to the peak maximum
What is a gas chromatography diagram?
A gas chromatography diagram is a labeled drawing of a gas chromatograph (GC): the instrument that separates the volatile compounds in a mixture by carrying them in a stream of gas through a long, coated column, so that each one reaches the detector at its own time. The diagram shows where the sample goes in, what moves it, where it separates, how each compound is detected, and how the signal becomes a chromatogram.
The same figure has several names. A GC schematic or block diagram shows the parts as boxes; a GC instrument diagram draws the hardware; a GC-MS diagram, also written GCMS or gas chromatography mass spectrometry diagram, adds the mass spectrometer that identifies each compound. All of them follow one rule this generator draws to: the parts appear in the order the carrier gas and sample meet them.
The parts of a gas chromatograph, in order
Trace the gas from the cylinder to the computer and you have the whole diagram.
Carrier gas supply: a cylinder of helium, hydrogen or nitrogen with a two-stage pressure regulator, often with traps that remove moisture and oxygen, and a flow or pressure controller.
Injection port (inlet): a heated block with a rubber septum on top and a glass liner inside. A microsyringe or an autosampler pushes about a microlitre of liquid sample through the septum, and it vaporises at once.
Column: where the separation happens. A fused-silica capillary column has a thin film of stationary phase on its inner wall.
Oven: a fan-stirred chamber that holds the column at a set temperature or heats it on a program.
Detector: at the column outlet, heated so nothing condenses. It turns each compound into an electrical signal.
Data system: records the signal against time and draws the chromatogram, with retention times and peak areas.
Carrier gas: the mobile phase
In gas chromatography the mobile phase is a gas that only carries the sample; it does not interact with it the way an HPLC solvent does. It has to be inert and pure, and it has to suit the detector. Helium is the usual choice for GC-MS and is safe; hydrogen gives faster separations at the same resolution but is flammable; nitrogen is inexpensive and works well for slower separations. Draw the gas as coming from an upright cylinder or a gas generator through a regulator with two gauges, then through a flow controller to the injector. A diagram with a solvent bottle and a pump feeding a GC is drawing the wrong instrument.
The injection port: split and splitless injection
Most capillary GCs use a split/splitless inlet. The sample is injected through the septum into a hot glass liner, where it vaporises and mixes with carrier gas. At the bottom of the liner the column takes some of that gas; the rest can leave through the split vent.
Split injection: the split vent is open, so only a small, fixed fraction of the vapour reaches the column. This keeps a concentrated sample from overloading the thin film and gives narrow peaks.
Splitless injection: the split vent is closed for the first part of the run, so nearly all the sample enters the column, then it opens to sweep out what is left. This is the method for trace analysis.
Septum purge: a small gas flow just under the septum that keeps bleed from the septum out of the column.
An injector close-up diagram labels the syringe, septum, septum purge, carrier gas inlet, liner, heated body, split vent and the column.
The column and the oven
Capillary (open tubular) columns are the standard today: fused-silica tubing, usually 15 to 60 m long and 0.1 to 0.53 mm across, with a polymer stationary phase such as a polysiloxane coated on the inside as a film a fraction of a micrometre to a few micrometres thick. A 30 m column with a 0.25 mm inner diameter and a 0.25 µm film is the most common general-purpose size. Older packed columns are shorter and much wider, filled with a solid support coated with the liquid phase, and are still drawn in some school textbooks.
Because the column is so long, it is wound into a loose coil on a wire cage and hung inside the oven, with one end through the wall to the injector and the other to the detector. The oven matters because retention depends strongly on temperature. Run isothermally, the whole column stays at one temperature; in a temperature program the oven starts low and heats at a set rate, so volatile compounds separate early and high-boiling ones still leave as sharp peaks. Either way, the column is at one temperature along its whole length at any moment, so a diagram should never shade the oven hot at one end and cold at the other.
GC detectors: FID, TCD, ECD and MS
The detector sits at the column outlet and is heated above the oven temperature. Each type is drawn differently.
Flame ionization detector (FID): the column effluent mixes with hydrogen and burns in air at a small jet; ions from burning organic compounds are collected by an electrode as a current. It responds to nearly all organic compounds, is very sensitive, and destroys the sample. Draw the jet, the hydrogen and air lines, the flame and the collector.
Thermal conductivity detector (TCD): a heated filament cools less when a compound with lower thermal conductivity than the carrier gas passes over it; a reference cell with pure carrier gas balances the bridge. It detects almost everything, including permanent gases and water, and does not destroy the sample, but it is less sensitive.
Electron capture detector (ECD): a radioactive nickel-63 source fills the cell with electrons; compounds with halogens capture them and lower the current. It is highly selective for chlorinated pesticides and similar compounds.
Mass spectrometer (MS): ionizes each compound, sorts the ions by m/z and records a full spectrum, so it both detects and identifies. That combination is GC-MS.
The GC-MS diagram: joining a GC to a mass spectrometer
A GC-MS diagram has the gas chromatograph on one side and the mass spectrometer on the other, joined by the heated transfer line, also called the interface. The end of the capillary column runs through this heated tube and finishes inside the ion source, so separated compounds stay in the gas phase all the way.
The mass spectrometer works under high vacuum, so the diagram must show its pumps: usually a turbomolecular pump on the analyser housing and a rotary vane pump that backs it. The low gas flow of a capillary column, about a millilitre a minute, is what lets the column run straight into the vacuum. A complete labeled GC-MS diagram therefore has the carrier gas cylinder, regulator, autosampler or syringe, injector, oven and column, transfer line, ion source, mass analyser, detector, vacuum pumps and data system.
Inside the mass spectrometer: ion source, quadrupole and detector
Ion source: in electron ionization (EI), electrons from a hot filament are accelerated, standardly to 70 eV, and strike the neutral molecules coming off the column. A molecule loses an electron to give the molecular ion, a radical cation, and much of it breaks into fragment ions. Lenses push the positive ions out of the source. A softer method, chemical ionization (CI), gives less fragmentation.
Mass analyser: a quadrupole is four parallel rods with DC and radio-frequency voltages on opposite pairs. At each voltage setting only one narrow m/z range has a stable path to the far end; the voltages are swept to scan the whole range several times a second. Ion traps and time-of-flight analysers are also used with GC.
Detector: an electron multiplier turns each arriving ion into a cascade of electrons, amplifying the signal enough to record.
Order: always source, then analyser, then detector, all in one vacuum housing. Fragmentation happens in the source, never in the analyser.
Reading a chromatogram: retention time and peaks
The chromatogram is the detector signal plotted against time since injection. Each separated compound gives a peak; the time to its maximum is its retention time, and under fixed conditions a compound always comes out at the same time, so retention times are compared with standards to identify peaks. An unretained substance, such as air or methane, marks the dead time; the retention time minus the dead time is the adjusted retention time. The area under a peak is proportional to the amount of that compound, and with a calibration, often against an internal standard, it gives a concentration. Two peaks are resolved when they return to the baseline between them.
Total ion chromatogram and mass spectrum
A GC-MS records a full mass spectrum many times a second. Adding up every ion in each spectrum and plotting the total against time gives the total ion chromatogram (TIC), which looks like an ordinary chromatogram. Picking one m/z gives an extracted ion chromatogram, and monitoring only a few chosen ions (selected ion monitoring, SIM) gives higher sensitivity for target compounds. Selecting the top of a TIC peak shows that compound’s mass spectrum: vertical bars of relative abundance against m/z, with the base peak at 100 % and, when it survives, the molecular ion at the highest significant m/z. Because 70 eV electron ionization spectra are reproducible, they can be searched against large reference libraries.
Why compounds separate in gas chromatography
Each compound shares its time between the moving gas and the stationary phase on the column wall. A compound that dissolves or sticks more strongly in the stationary phase spends less time moving and leaves later. On a non-polar column, compounds come out roughly in order of boiling point; on a polar column, polar compounds are held back more. Raising the oven temperature pushes every compound into the gas phase sooner and shortens retention times. The compound must be volatile and stable when heated; polar compounds such as sugars or amino acids are often made volatile first by derivatization.
GC vs HPLC diagrams: how to tell them apart
Both are column chromatography and both end in a detector and a chromatogram, which is why they get mixed up. Look at the start of the drawing: a gas cylinder, a heated injector and a coiled column in an oven mean gas chromatography; solvent bottles, a degasser, a high-pressure pump, an injection valve and a short straight column mean HPLC. GC suits small, volatile, heat-stable molecules; HPLC suits polar, non-volatile and heat-sensitive ones such as most drugs and proteins. The comparison table on this page lists what each diagram must and must not show.
Making a GC or GC-MS worksheet and answer key
Choose the figure: the instrument schematic for a first lesson, the GC-MS system for an analytical chemistry course, or the mass spectrometer close-up for an instrumental analysis exam.
Choose Blank worksheet for a test, or Worksheet with word bank for a scaffolded lesson. The numbers follow the gas path, from the cylinder to the data system.
Make the answer key from the same result with the answer-key action, so every number lines up.
For older students, add a fault to find: generate a correct diagram, then ask AI Drawing to move the detector before the column or remove the vacuum pump, and ask the class what is wrong.
A GC-MS schematic in a paper, thesis or poster
In a thesis methods chapter, a review or a poster, a schematic helps readers who do not run the instrument every day. Keep it to the parts your method depends on, name them as in your text (for example "split/splitless inlet", "5 % phenyl polysiloxane capillary column", "single-quadrupole MS, EI at 70 eV"), and put the instrument model and settings in the text and caption rather than in the drawing. If the figure is about your results rather than the instrument, pair a chromatogram plotted from your own data, made with a line chart tool, with a small schematic. For a sample-preparation and analysis pipeline, a workflow diagram usually does the job better than a drawing of the hardware.
Most common mistakes on a gas chromatography diagram
These are the errors image models make most often when they draw a gas chromatograph or a GC-MS. Each one would cost marks on an exam answer and confuse a reader of a methods figure, so check them before you use a diagram.
MistakeCorrect
MistakeDetector drawn before the column, or the sample injected at the column outlet
CorrectCarrier gas → injector → column → detector → data system, in that order
MistakeColumn outside the oven, or a short straight tube
CorrectA long capillary column coiled on a cage inside the oven, each end through the oven wall
MistakeOven shaded hot at one end and cool at the other
CorrectOne uniform oven temperature at any moment; a temperature program changes it over time
MistakeCarrier gas pumped from a solvent bottle
CorrectCompressed helium, hydrogen or nitrogen from a cylinder with a regulator; pumps and solvent bottles are HPLC
MistakeMass spectrometer with no vacuum pumps
CorrectHigh vacuum from a turbomolecular pump backed by a rotary pump
MistakeMass analyser placed before the ion source
CorrectIon source → mass analyser → detector inside the vacuum housing
MistakeMolecules breaking apart inside the quadrupole
CorrectFragmentation happens in the electron ionization source; the quadrupole only filters ions by m/z
MistakeSeparated compounds leaving the column side by side into parallel analysers
CorrectCompounds leave one column one after another in time and pass through one source and one analyser
MistakeFID drawn with no hydrogen or air supply
CorrectColumn effluent burns in a hydrogen–air flame, with a collector electrode above it
MistakeMass spectrum drawn as a smooth curve, or a chromatogram with m/z on the x axis
CorrectSpectrum: vertical bars of relative abundance against m/z; chromatogram: response against retention time
GC vs GC-MS vs HPLC: what each diagram must show
Three instruments that are often drawn alike and confused in exam answers. Use this table to check that a diagram really shows the instrument it is labeled as.
GC (FID or TCD)
GC-MS
HPLC
Mobile phase
Inert gas: helium, hydrogen or nitrogen from a cylinder
Inert gas, usually helium
Liquid solvents pushed by a high-pressure pump
Sample suits
Volatile compounds that vaporise without decomposing
The same, when the compounds must also be identified
Non-volatile, polar, heat-sensitive or large molecules
Column
Long, thin capillary (often 30 m) coiled in an oven
The same, ending in the ion source via a heated transfer line
Short packed column, often in a column heater
Detector
FID, TCD or ECD: one signal against time
Ion source, mass analyser (often a quadrupole) and electron multiplier under vacuum
UV-Vis or diode array, fluorescence, refractive index, or MS
Output
Chromatogram: response against retention time
Total ion chromatogram plus a mass spectrum for every point
Chromatogram: absorbance (or response) against time
Must not appear in the diagram
Solvent bottles or a pump; a column outside the oven
An MS without vacuum pumps; analyser before the source
A gas cylinder as the mobile phase; an oven-coiled capillary
Gas Chromatography Diagram FAQ
It is a labeled drawing of a gas chromatograph, the instrument that separates the volatile compounds in a mixture. It shows the parts in the order the sample meets them: the carrier gas supply and its regulator, the heated injector, the column coiled inside the oven, the detector at the column outlet, and the data system that draws the chromatogram. A GC-MS diagram replaces the simple detector with a mass spectrometer.
Generate lab setups, reaction mechanisms, chemistry diagrams, and blank labeling worksheets with matching answer keys with the same SciFigure AI workflow.