
Free writing tool
Figure legend generator for journal submissions
Fill in what each panel shows, your sample size, what the error bars represent, and which test you ran. The tool assembles a legend in the order journals expect, flags the details reviewers ask about, and gives you the LaTeX caption alongside the plain text.
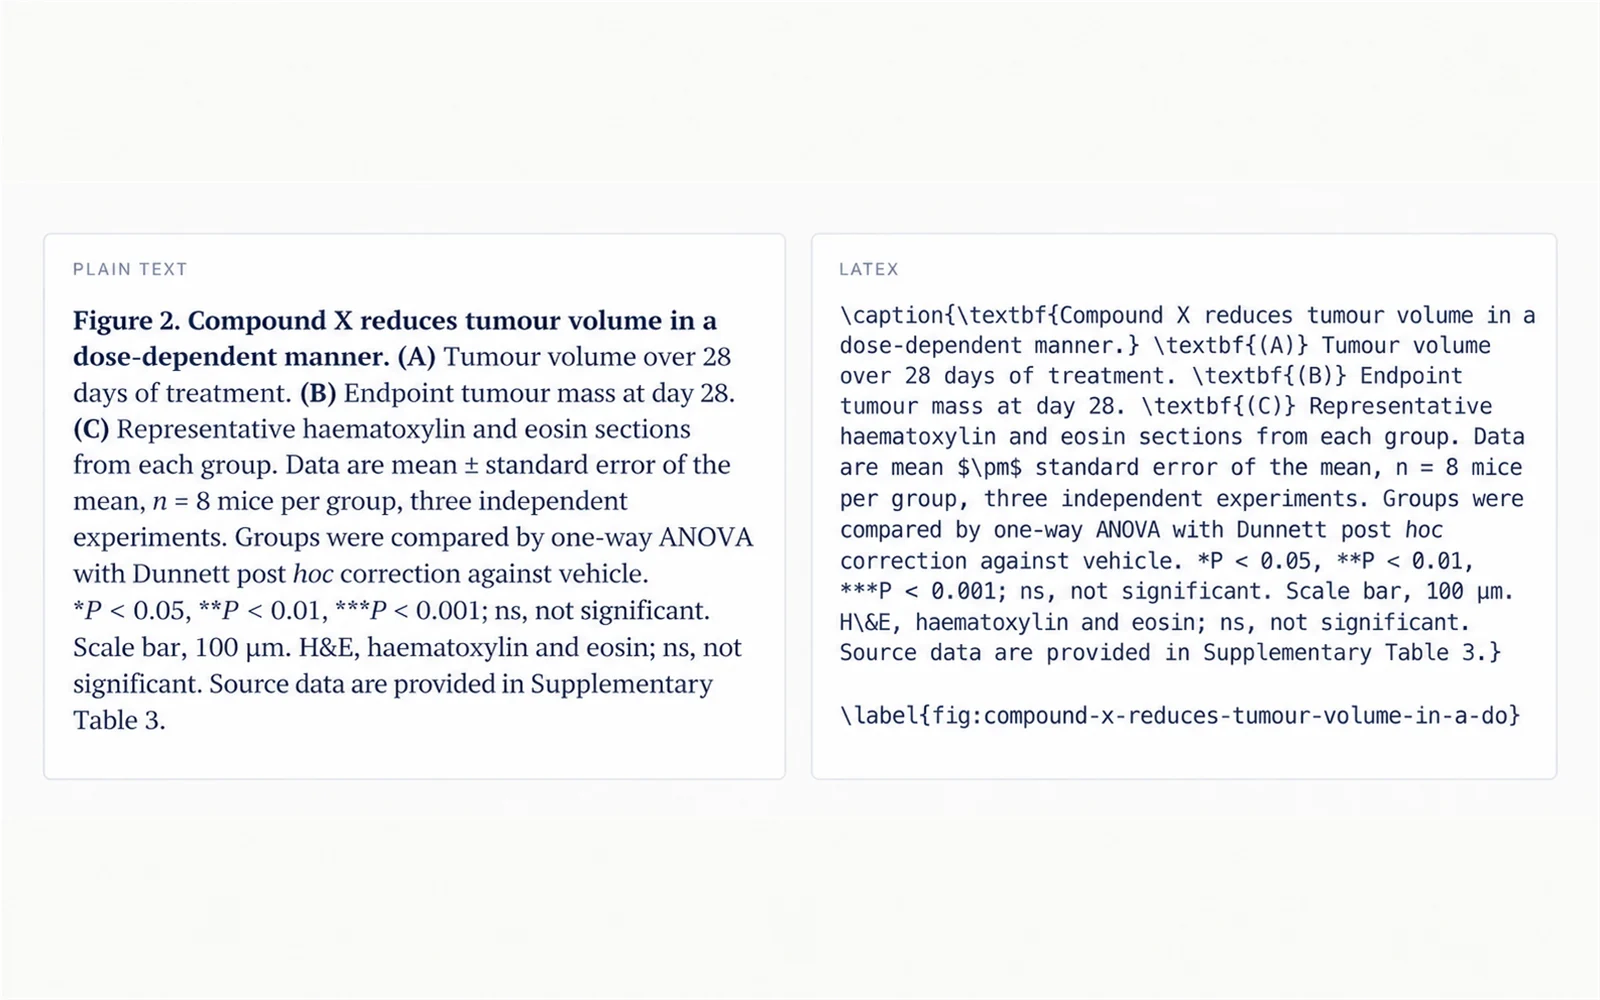
Figure 2. Compound X reduces tumour volume in a dose-dependent manner. (A) Tumour volume over 28 days of treatment. (B) Endpoint tumour mass at day 28. (C) Representative haematoxylin and eosin sections from each group. Data are mean ± standard error of the mean, n = 8 mice per group, three independent experiments. Groups were compared by one-way ANOVA with Dunnett post hoc correction against vehicle. *P < 0.05, **P < 0.01, ***P < 0.001; ns, not significant. Scale bar, 100 μm. H&E, haematoxylin and eosin; ns, not significant. Source data are provided in Supplementary Table 3.
What is a figure legend?
A figure legend, also called a caption, is the block of text under a figure that lets a reader understand it without hunting through the Methods. It is not a title and it is not a results paragraph. Most journals expect it to be self-contained, because figures are what readers look at first and what gets reproduced in slides and reviews.
- A legend sits below the figure. A table caption sits above its table. That convention is near-universal.
- A key, sometimes loosely called a legend, is the small box inside the plot mapping colours or symbols to series. It is a different thing from the caption.
- Self-contained means a reader can interpret the figure from the legend alone: what is plotted, how many samples, what the error bars mean, and which test produced the asterisks.
The parts of a good figure legend
Legends across journals vary in length but rarely in structure. Working through these in order produces something a copy editor will not send back.
- Title sentence. One phrase stating the finding, not the axes. "Compound X reduces tumour volume in a dose-dependent manner" beats "Tumour volume versus time".
- Panel descriptions. One clause per panel, each opening with its letter in parentheses: (A), (B), (C). Every panel in the figure needs one.
- Sample size. State n and say what n counts: cells, animals, biological replicates, or fields of view. "n = 8" alone is ambiguous.
- Centre and spread. Name both: "mean ± SEM" or "median with interquartile range". SD and SEM are different quantities and readers cannot tell which you used by looking.
- Statistical test. Name the test, the correction for multiple comparisons, and what was compared with what.
- Significance markers. Define every symbol used in the figure, including ns.
- Scale bar. Give the length for any micrograph or image. A scale bar without a stated length is decoration.
- Abbreviations. Expand anything that appears in the figure but not in the legend text.
SD, SEM, or confidence interval?
This is the single most common error in figure legends, and it changes how a reader interprets the figure. The three quantities answer different questions and differ in size, so labelling them interchangeably is not a stylistic slip.
- Standard deviation (SD) describes the spread of the data. It does not shrink as you collect more samples. Use it when the point is variability among observations.
- Standard error of the mean (SEM) describes the precision of the estimated mean. It equals SD divided by the square root of n, so it shrinks with sample size and is always smaller than the SD.
- A 95% confidence interval is roughly the mean ± 1.96 × SEM for large samples, and it states a range of plausible values for the true mean.
- Because SEM is smaller than SD, error bars showing SEM look tighter. Reporting SEM when the reader expects SD makes results look more consistent than they are.
- Whichever you choose, state it in the legend together with n. Error bars without n cannot be interpreted at all.
Common mistakes reviewers flag
These are the comments that come back on revision, in rough order of frequency.
- Error bars undefined. The figure shows bars, the legend never says what they represent.
- n missing, or n that does not distinguish technical from biological replicates. Three wells from one culture is not n = 3 biological replicates.
- Asterisks undefined. Every significance marker in the figure needs a threshold in the legend.
- A panel present in the figure but absent from the legend, usually after a figure gets rearranged late.
- A title that restates the axes instead of the finding.
- Scale bar shown but its length never given, or given in the Methods instead of the legend.
- Interpretation smuggled into the legend. Say what the figure shows; argue about what it means in the Results and Discussion.
Frequently asked questions
Is this figure legend generator free?
Yes. It runs entirely in your browser, needs no account, and nothing you type is uploaded to a server. Copy the legend or download it as a .txt or .tex file.
What is the difference between a figure legend and a caption?
In practice nothing: most journals use the terms interchangeably for the text below a figure. Where a distinction is drawn, the caption is the short title line and the legend is the fuller explanation that follows it. Both belong below the figure, while table captions go above the table.
How long should a figure legend be?
Long enough to be self-contained and no longer. Most fall between 50 and 200 words. Several journals cap legends at around 300 words, and the tool warns you when you cross that. A multi-panel figure legitimately needs more room than a single plot.
Should the legend go above or below the figure?
Below. Figures take their legend underneath; tables take their caption above. Almost every style guide and journal template follows this, including Nature, Science, Cell, and the ICMJE recommendations.
Do I write the legend in past or present tense?
Present tense for what the figure shows ("Data are mean ± SEM"), past tense for what you did ("Cells were treated for 24 h"). Mixing the two in that pattern is standard and reads naturally.
Can I get the legend as a LaTeX caption?
Yes. Switch to the LaTeX tab and you get a \caption{} block with the title sentence and each panel letter wrapped in \textbf, special characters escaped, and a \label derived from your title.
Does the legend need to define abbreviations again?
Yes, if they appear in the figure. A legend is meant to stand alone, so an abbreviation shown in an axis label or a panel needs expanding in the legend even when it is already defined in the main text.
Related tools

Journal Figure Requirements
Compare figure size, resolution, and format rules across 14 publishers.
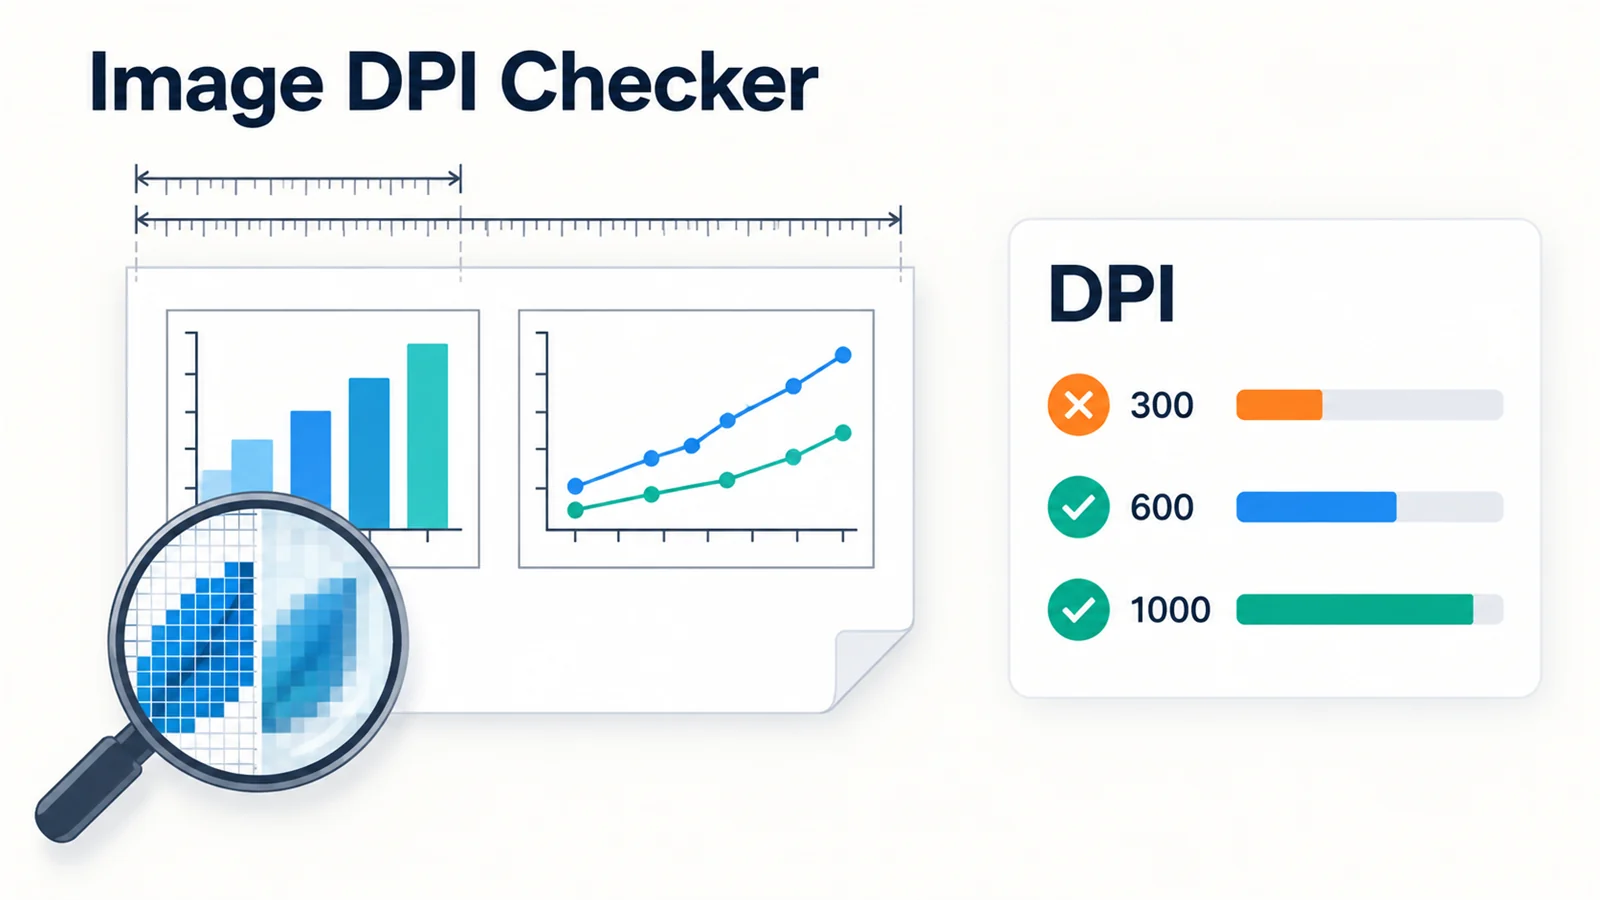
Image DPI Checker
Check whether a figure meets a journal DPI requirement at its print width.
Colorblind Simulator
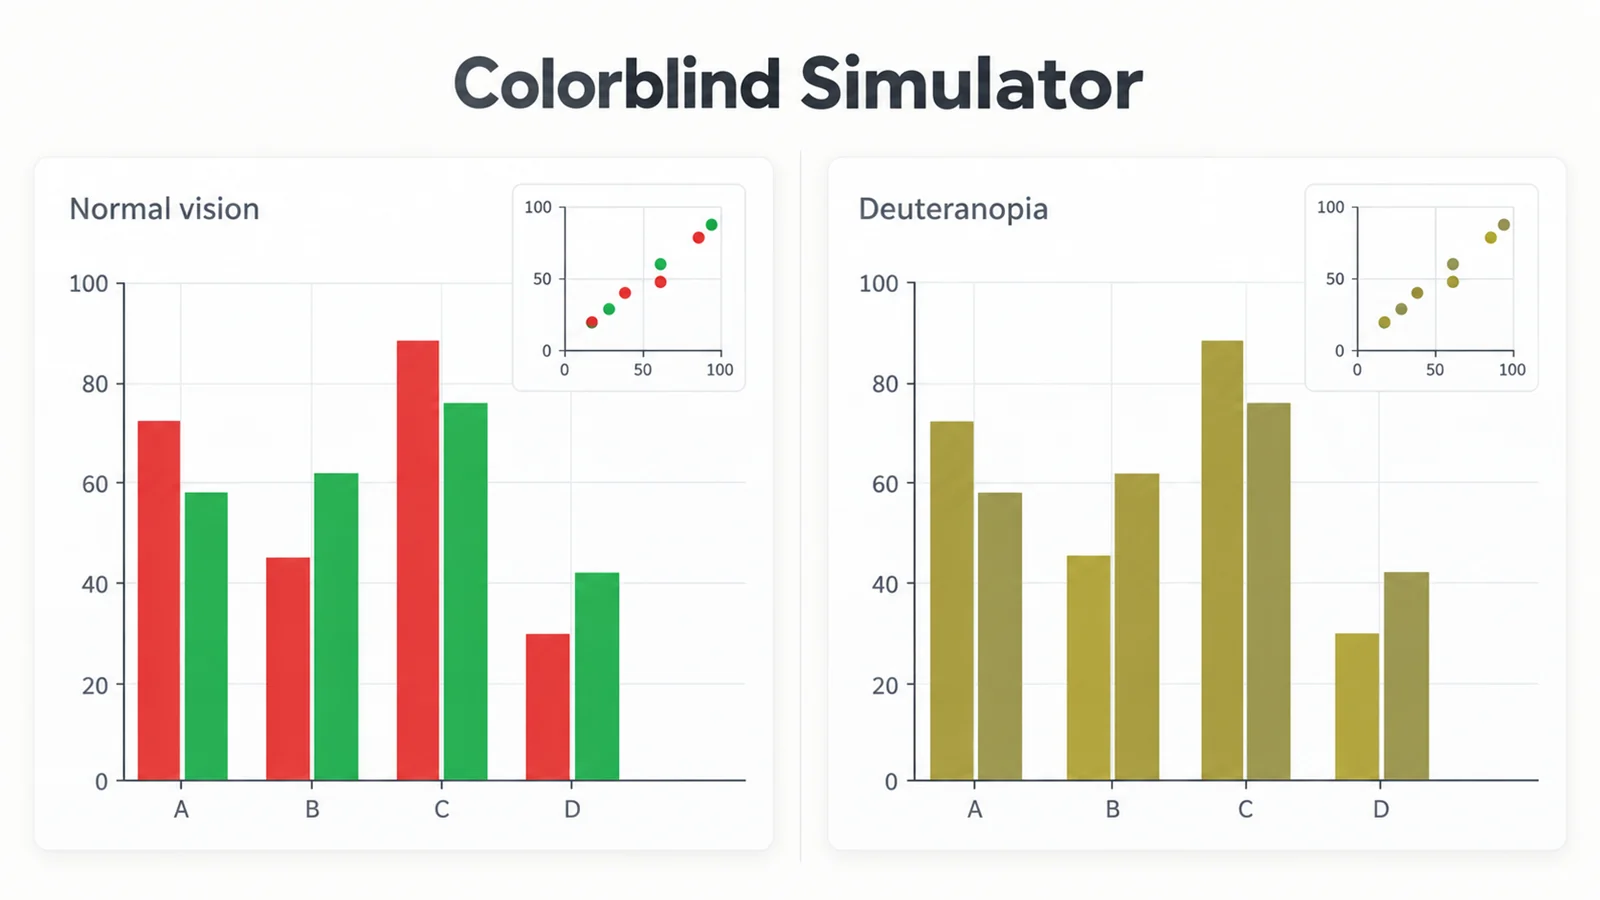
Preview a figure with protanopia, deuteranopia, and tritanopia.
CONSORT Diagram Generator
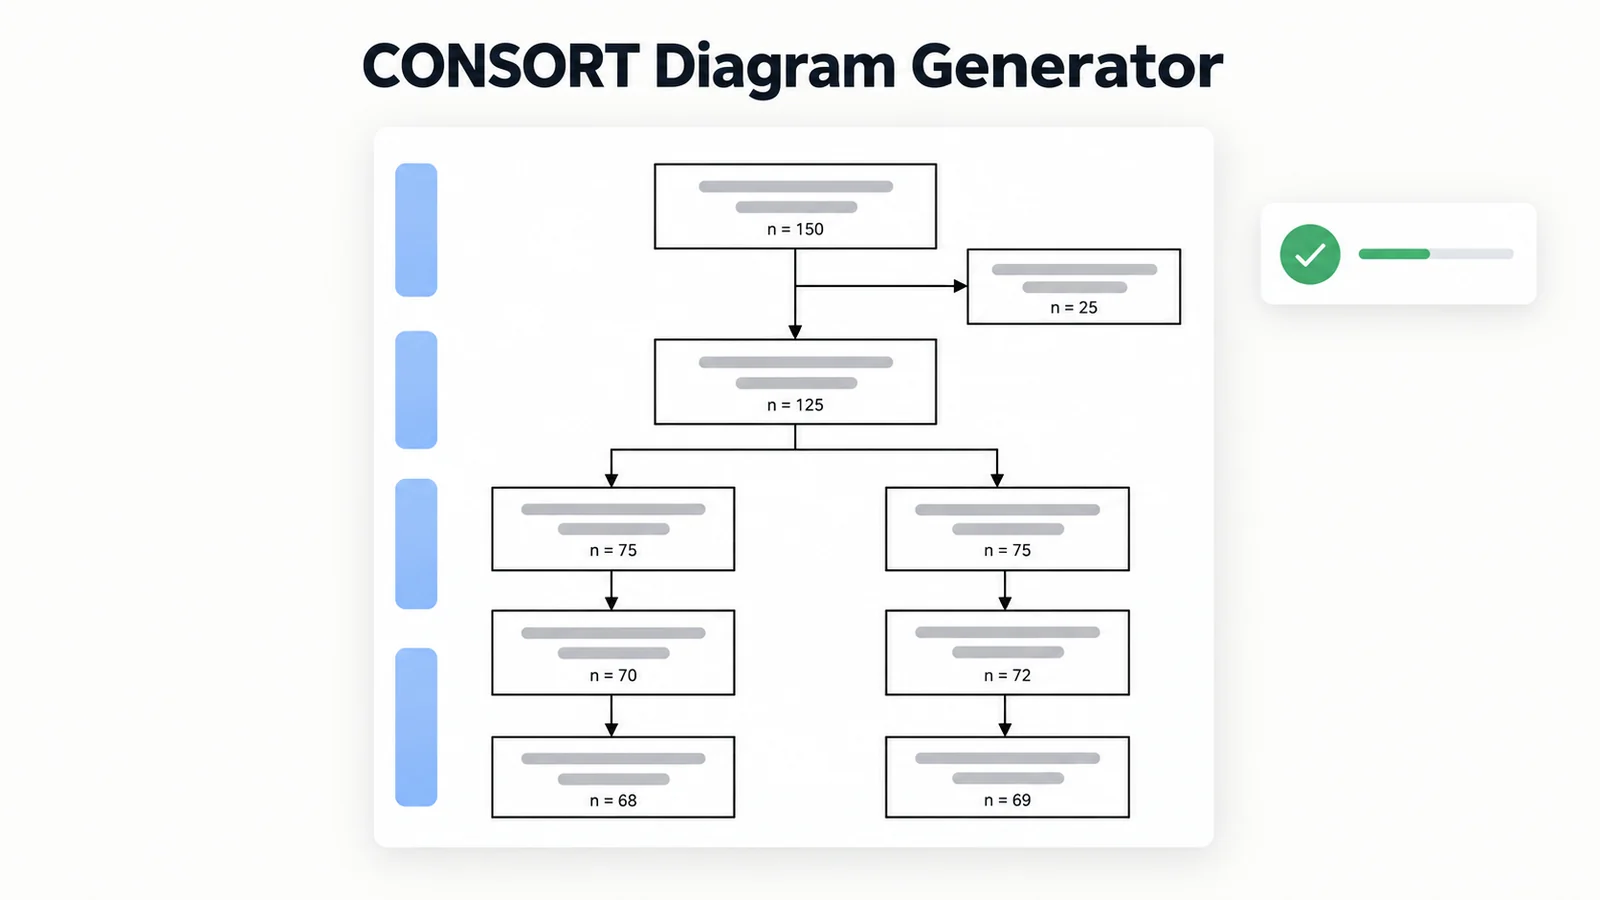
Build a CONSORT participant flow diagram for a randomised trial.
Need the figure as well as the legend?
SciFigure AI turns research data and mechanisms into publication-ready figures for papers, posters, and slides.
Explore the figure toolsLast checked: September 20, 2026. Sources: ICMJE Recommendations: Preparation of Figures; Nature: Figure legend guidelines for authors.