
Free Venn diagram generator
Venn diagram maker for 2, 3 and 4 sets, from blank templates to exact list overlaps
Create a Venn diagram in your browser. Type words into each region for a compare-and-contrast worksheet, start from a blank printable template, or paste one list per set (genes, species, students, numbers) and the generator sorts every item into its region and counts it exactly. Shade any expression such as A ∩ B′, draw the circles to scale, and download SVG, PNG, PDF or a CSV of every overlap.
Have lists instead of notes? Switch to Paste lists under Data and every overlap is counted exactly, with a table of each region’s items and a CSV download.
Free, no sign-up, nothing uploaded: your lists stay in this browser tab, and your last diagram is kept on this device only. Undo with Ctrl+Z.
Worked example
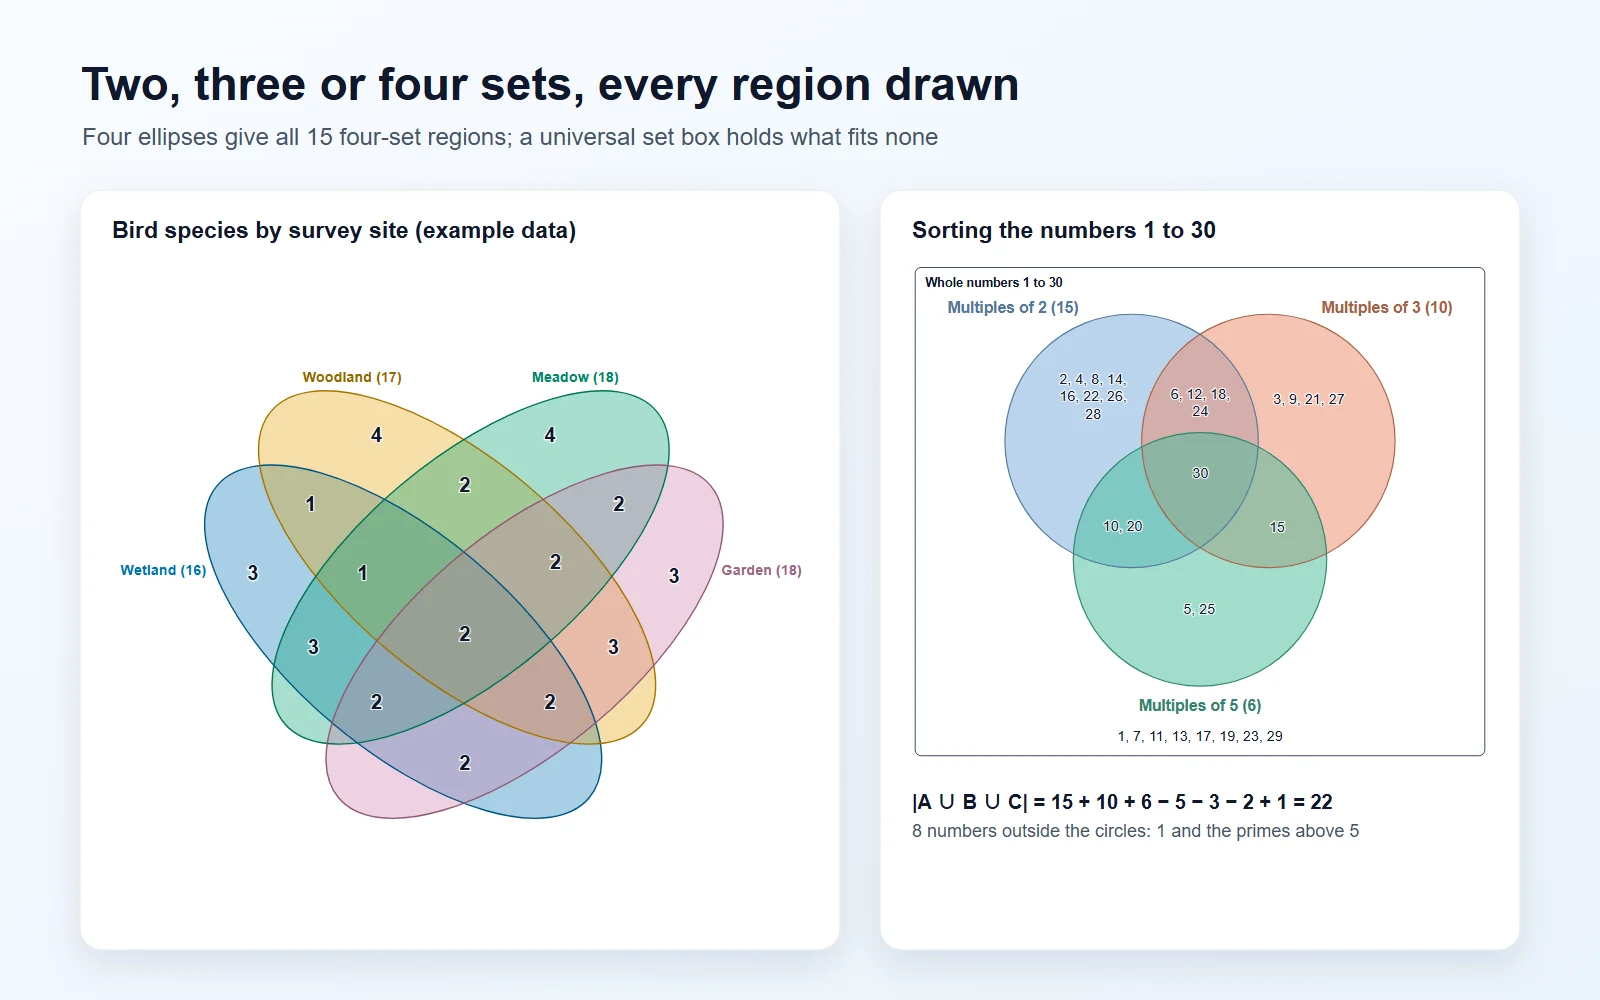
Sorting the numbers 1 to 30 into a three-circle Venn diagram
The universal set is the whole numbers 1 to 30. Set A is the multiples of 2, B the multiples of 3 and C the multiples of 5. Each number goes in exactly one of the eight regions, and the regions show at once which numbers share which factors: 30 is the only number divisible by all three, and the eight numbers outside the circles are 1 and the primes other than 2, 3 and 5.
| Region | n | Numbers |
|---|---|---|
| Only Multiples of 2A ∩ B′ ∩ C′ | 8 | 2, 4, 8, 14, 16, 22, 26, 28 |
| Only Multiples of 3A′ ∩ B ∩ C′ | 4 | 3, 9, 21, 27 |
| Only Multiples of 5A′ ∩ B′ ∩ C | 2 | 5, 25 |
| Multiples of 2 and Multiples of 3 onlyA ∩ B ∩ C′ | 4 | 6, 12, 18, 24 |
| Multiples of 2 and Multiples of 5 onlyA ∩ B′ ∩ C | 2 | 10, 20 |
| Multiples of 3 and Multiples of 5 onlyA′ ∩ B ∩ C | 1 | 15 |
| In all threeA ∩ B ∩ C | 1 | 30 |
| None of the three(A ∪ B ∪ C)′ | 8 | 1, 7, 11, 13, 17, 19, 23, 29 |
Check it with inclusion–exclusion
|A ∪ B ∪ C| = 15 + 10 + 6 − 5 − 3 − 2 + 1 = 22
That matches the 22 numbers inside the circles, and 30 − 22 = 8 numbers lie outside them. The centre, 1, is added three times with the single sets, removed three times with the pairs, and added back once.
Read a probability from it
P(A ∪ B) = (15 + 10 − 5) ÷ 30 = 20/30
A number picked at random from 1 to 30 is a multiple of 2 or of 3 with probability 20/30, about 67%. The 5 multiples of 6 sit in the overlap and would be counted twice if the two sets were simply added.
For an illustrated comparison rather than a sorted one, the plant vs animal cell diagram draws both cells as a labelled Venn diagram or side by side, and the mitosis and meiosis diagram pages illustrate the two divisions compared in the template above. With more than four lists, switch to an UpSet plot; to show how strongly many samples resemble each other, a clustered heatmap works better than overlapping circles. To connect ideas instead of sorting them, use the concept map generator, and to sort organisms by traits into a branching key, the dichotomous key maker.
Set notation key
Union, intersection and complement, shaded
Each card shows which regions a set expression covers. The rectangle is the universal set, so a complement includes the space outside the circles. Click a card to shade the same expression in the maker, then try your own in the Shade tab.
How to make a Venn diagram here
The diagram redraws as you type, and nothing is sent anywhere: the lists are read and the shapes are drawn by code running in your browser tab.
- Pick a template or a number of sets. Two and three sets use circles; four sets use four ellipses, because four circles cannot produce every region.
- Name the sets and choose their colours. The default palette is Okabe-Ito, which stays distinguishable for the common forms of colour blindness; Outline only gives a black-and-white printable.
- To compare and contrast, choose Type in regions and write one item per line in each region’s box. Clicking a region in the diagram jumps to its box.
- To compare lists, choose Paste lists and paste one list per set, or paste two to four spreadsheet columns at once. Every overlap is computed exactly and listed in the region table.
- Under Style, show counts, percentages, the items themselves or the set notation in each region; add a universal set box, writing lines for worksheets, or area-proportional circles.
- Under Shade, type a set expression such as (A ∪ B) ∩ C′ to shade it, and, with lists, see exactly which items it contains.
- Export SVG for editing in Illustrator, Inkscape or PowerPoint, PNG at 2× or 3×, or PDF through the print dialog. The region table downloads as CSV, and the item-by-set membership matrix is ready for an UpSet plot or R.
What is a Venn diagram?
A Venn diagram draws sets as overlapping closed shapes inside a rectangle that stands for the universal set, everything under consideration. Each set is one circle or ellipse, and the shapes are arranged so that every possible combination of membership has its own region: in A only, in A and B but not C, in all of them, in none. John Venn described the method in the Philosophical Magazine in 1880 as a way to picture logical propositions, and it has since become the standard picture of sets in mathematics, statistics, logic and biology.
- The universal set U is the rectangle. A region outside every circle but inside the rectangle holds the items that belong to none of the sets.
- Every region is drawn even when it is empty. An empty region is shown with a 0, or shaded in logic diagrams, rather than left out; that is what separates a Venn diagram from an Euler diagram.
- A “completed” Venn diagram has every region filled in. A blank one is the same drawing with the regions left empty for a student to fill, which is why a worksheet and its answer key can come from the same template here.
How to read the regions of a Venn diagram
Each region is defined by which sets it is inside and which it is outside. A diagram of n sets has 2ⁿ − 1 regions inside the shapes, plus the outside region.
- Two sets: three regions. A only, B only, and the overlap A ∩ B in the middle. In a compare-and-contrast diagram the overlap holds the similarities and the two crescents hold the differences.
- Three sets: seven regions. Three “only” regions on the outside, three regions where exactly two sets overlap, and the centre where all three meet.
- Four sets: fifteen regions. Four “only” regions, six pairs, four triples and one region shared by all four.
- The middle of a Venn diagram is the intersection of every set: what all of them have in common.
- Regions are exclusive. The “A and B only” region leaves out anything that is also in C, so it can be smaller than A ∩ B as a whole. The pairwise table under the diagram gives both numbers.
- Adding the counts of every region inside the shapes gives the size of the union. Each item is counted once, in exactly one region; the region table shows that sum as a check.
Set notation on a Venn diagram: union, intersection and complement
Set operations are easiest to learn by shading. Type any of these into the Shade tab and the matching regions are hatched; the set notation key further down this page shows each one drawn.
- Union, A ∪ B (“A or B”): everything in A, in B, or in both.
- Intersection, A ∩ B (“A and B”): only what is in both. Two sets with nothing in common are disjoint, and their intersection is the empty set, ∅.
- Complement, A′ (also written Aᶜ or Ā, “not A”): everything in the universal set that is outside A.
- Difference, A − B (also A \ B, “A but not B”): what is in A and not in B. It equals A ∩ B′.
- Symmetric difference, A △ B: what is in exactly one of the two sets, the union without the overlap.
- De Morgan’s laws are easy to see shaded: (A ∪ B)′ is the same region as A′ ∩ B′, and (A ∩ B)′ is the same as A′ ∪ B′.
- The tool applies complement first, then intersection, then difference, then union and symmetric difference. When in doubt, use brackets: (A ∪ B) ∩ C and A ∪ (B ∩ C) are different regions.
Counting with a Venn diagram: inclusion–exclusion
Adding the sizes of overlapping sets counts the shared items more than once. The inclusion–exclusion principle corrects for it, and a Venn diagram shows why each term is there.
- Two sets: |A ∪ B| = |A| + |B| − |A ∩ B|. The overlap is counted in both |A| and |B|, so it is subtracted once.
- Three sets: |A ∪ B ∪ C| = |A| + |B| + |C| − |A ∩ B| − |A ∩ C| − |B ∩ C| + |A ∩ B ∩ C|. The centre is added three times, taken away three times, and added back once.
- The same rule gives probabilities: P(A or B) = P(A) + P(B) − P(A and B). Divide each region’s count by the total to turn the diagram into a probability diagram.
- Worked the other way, the rule fills in a Venn diagram from survey totals: start with the centre, then the pairs, then the “only” regions, subtracting as you go.
- The worked example below sorts the numbers 1 to 30 by multiples of 2, 3 and 5 and checks the formula against the regions.
2-, 3- and 4-set Venn diagrams, and what to do beyond four
Two and three sets fit naturally in circles. Four do not: two circles cross at no more than two points, which limits n circles to at most n² − n + 2 regions, counting the outside. For four circles that is 14, two short of the 16 that four sets need, so at least two combinations would have nowhere to go.
- Ellipses can cross at four points, so four ellipses can show all 16 regions. Venn himself drew a four-set diagram this way, and it is the layout used here.
- The four-ellipse diagram is still readable for counts and short labels, but its smallest regions are narrow. Keep the text in them short.
- Five-set Venn diagrams exist, but their 31 regions include slivers too small to label, and readers struggle to find a given intersection.
- For five or more sets, or for many sets of different sizes, use an UpSet plot. It lists the intersections as rows of a matrix with a bar for each one’s size, so it scales to dozens of sets. The membership CSV from this tool is the input it needs.
Area-proportional Venn diagrams: what is exact and what is not
In a standard Venn diagram every region gets similar room whatever its count. An area-proportional (scaled) diagram sizes the shapes so that the areas match the numbers, which shows at a glance that one list is three times another.
- Two sets: exact. The circle areas equal the two set sizes, and the distance between the centres is solved so that the lens of overlap equals the shared count.
- Three sets: the three circle areas are exact, but the seven regions usually cannot all be matched at once. Three circles leave only three distances free to fit four overlap areas, so some combinations of counts cannot be drawn with circles at all. This tool finds the closest placement and reports how far each region’s area is from its count.
- Because of that, the numbers in a scaled three-set diagram are the result; the areas are an approximate guide. Say so in the figure legend.
- Very unequal sets can leave a small region too thin to label, and a region with items can even vanish. The tool lists any such region under the diagram, and the standard layout always draws every region.
- Four or more sets are not drawn to scale here: ellipses with matched areas become unreadable, and an UpSet plot shows sizes more accurately.
Venn diagram or Euler diagram?
The two look alike but answer different questions. A Venn diagram shows every possible combination of sets, empty or not. An Euler diagram, named after Leonhard Euler, who used overlapping circles to teach logic in the 1760s, shows only the relationships that actually occur.
- If no item is in both A and B, an Euler diagram draws A and B apart; a Venn diagram still draws the overlap and marks it empty or shaded.
- If every A is also a B, an Euler diagram puts A inside B. The Venn version keeps the overlap and shades the “A only” region as empty.
- Area-proportional diagrams with a zero region are, strictly, Euler diagrams: an empty overlap is drawn as two separate circles.
- For teaching syllogisms (“all A are B”) an Euler diagram is clearer. For counting, probability and comparing lists, a Venn diagram is the safer choice, because a missing region cannot be mistaken for a forgotten one.
Comparing gene lists and other research data
Venn diagrams are a routine figure in genomics and ecology: differentially expressed genes shared between conditions, proteins detected by two methods, species found at several sites, patients meeting several criteria. A correct one depends on the lists being comparable before they are drawn.
- Use one identifier system throughout. A gene listed by symbol in one list and by Ensembl or Entrez ID in another will never match; neither will a symbol and its older alias.
- Matching ignores letter case and spaces at either end by default, so BRCA1, brca1 and “BRCA1 ” are one item. Turn on Match case where case carries meaning.
- Repeats within a list are counted once, and the tool tells you how many it removed, so a duplicated row cannot inflate an overlap.
- A count of shared items means little without the background. Paste the universal set, such as every gene measured, to see what lies outside all lists; to test whether an overlap is larger than chance, a hypergeometric or Fisher’s exact test needs that background size too.
- The Jaccard index in the pairwise table (shared ÷ union) compares overlaps between pairs of lists of different sizes on one scale from 0 to 1.
- With more than four lists, or when the reader needs to rank intersections by size, an UpSet plot is clearer than any Venn diagram.
Venn diagrams in the classroom
From primary sorting activities to set theory and probability, the same template covers most classroom uses, and the blank and completed versions come from one file.
- Compare and contrast: two circles for two topics, characters, cells, historical periods or materials, with similarities in the middle. The Mitosis vs meiosis template is a ready example.
- Plant and animal cells: the classic biology comparison puts the cell wall, chloroplasts and large central vacuole on the plant side, centrioles on the animal side, and the shared organelles in the middle. The template follows our plant and animal cell diagram page.
- Sorting numbers: multiples, factors, odd and even, or primes, with a universal set box for the numbers that fit none of the rules. The 1 to 30 template shows one.
- Set notation and probability: turn on Region notation to label each region, or shade an expression and ask students to name it.
- Printable templates: Blank 2-circle and Blank 3-circle come with writing lines and write-in name lines; leave everything blank or fill in one region as a model answer.
- Venn diagram foldable: print the blank two-circle template, fold the sheet in half along its long side, and cut the top layer into three flaps, one over each region, so students write the answers underneath.
- Big Venn diagram for a wall or a whiteboard: export the PDF and print it at poster size, or use the 3× PNG; the SVG scales to any size without losing sharpness.
Making a Venn diagram in Word, PowerPoint, Google Slides, R or Python
If the diagram has to be built in another program, these are the usual routes. Each has limits that this maker avoids, such as fixed layouts or no counting.
- Word, PowerPoint and Excel: Insert, SmartArt, Relationship, Basic Venn. The circles are equal and the overlaps have no text boxes of their own, so labels in the overlaps are added as separate text boxes. Pasting this tool’s SVG into Office gives an editable vector drawing instead.
- Google Docs and Slides: there is no Venn template. In Slides, Insert, Shape, Oval, then lower the fill transparency so the overlaps show; in Docs, do the same inside Insert, Drawing, New.
- R: the VennDiagram and ggVennDiagram packages draw standard diagrams from lists, eulerr draws area-proportional Euler and Venn diagrams, and UpSetR draws UpSet plots.
- Python: the matplotlib-venn package draws area-weighted two- and three-set diagrams (venn2, venn3); its documentation notes that three-set areas cannot in general match the counts exactly, for the same geometric reason as here.
- Whichever you use, check the counts by inclusion–exclusion before publishing, and state whether the areas are drawn to scale.
Tips for a clear Venn diagram in a paper, poster or slide
- Print the set size next to each name, and the count in each region. Readers should not have to estimate overlaps from areas.
- Say whether the shapes are drawn to scale. If the three-set layout is area-proportional, note that the overlap areas are approximate.
- Use a colour-blind-safe palette and translucent fills so the overlaps mix visibly, or outlines alone for print. Do not rely on colour alone to name the sets.
- Keep text in the small regions of a four-set diagram short, or show counts in the diagram and the items in a table.
- Export SVG or PDF for journals and posters; a PNG at 3× is roughly 2,400 to 3,300 pixels wide here, comfortably above 300 dpi at a single journal column.
- Report the data behind the figure: the region CSV gives every count and item for supplementary material.
Frequently asked questions
Is this Venn diagram maker free?
Yes. There is no sign-up, no watermark and no limit on sets, items or downloads, and it costs no credits. The diagram is drawn in your browser, so the lists you paste never reach a server, and your last diagram is kept on your own device for when you come back.
How do I make a Venn diagram with 3 circles?
Choose 3 sets under Data, or the Blank 3-circle template. Name the three sets, then either type into each of the seven regions or switch to Paste lists and paste one list per set. The three circles, their names and every region’s content are drawn as you type, and the diagram exports as SVG, PNG or PDF.
Can I make a 4-way Venn diagram?
Yes. Choose 4 sets and the tool draws four ellipses with all 15 regions, each labelled with its count, items or notation. It uses ellipses because four circles can form at most 14 regions including the outside, two fewer than four sets need.
What should I use for 5 or more sets?
An UpSet plot. A five-set Venn diagram has 31 regions, some of them too small to read. An UpSet plot lists each intersection as a row with a bar for its size, so it scales to many sets. Download the membership CSV here and use it as the UpSet plot’s input.
How do I find the overlap between two gene lists?
Choose Paste lists and paste one list of gene symbols or IDs into each set, or paste spreadsheet columns with the list names in the first row. The region table shows exactly which genes are shared and which are unique, and Regions CSV downloads them. Use one kind of identifier in every list, since a symbol never matches an Ensembl ID.
Does it count BRCA1 and brca1 as the same item?
By default, yes: matching ignores letter case and spaces at either end, and repeats within a list are counted once. Turn on Match case under the lists if capital letters carry meaning in your data. Items are split at new lines, commas, semicolons and tabs, or at new lines only if your items contain commas.
What does A ∩ B′ mean, and how do I shade it?
A ∩ B′ is “in A and not in B”: the part of circle A outside circle B, the same as A − B. Open the Shade tab and type A ∩ B′, or A n B', or pick it from the examples; the region is hatched in the diagram, and with lists the tool lists the items it contains.
What is the difference between a Venn diagram and an Euler diagram?
A Venn diagram draws every possible combination of the sets, including empty ones, which are marked 0 or shaded. An Euler diagram draws only the combinations that exist, so disjoint sets appear as separate circles and a subset sits inside its superset.
Are the circles drawn to scale?
Only if you ask. The standard layout gives every region the same room so labels fit. With lists, Area-proportional under Style sizes the circles by the counts: exactly for two sets, and as the closest possible fit for three, since three circles generally cannot match all seven region areas. The tool shows how far each area is from its count.
Can I print a blank Venn diagram template?
Yes. Pick Blank 2-circle, Blank 3-circle or Blank 4-set, keep or remove the writing lines under Style, type set names or leave the write-in lines, and choose PDF or print from Export. The Outline only palette prints cleanly in black and white.
How do I make a plant and animal cell Venn diagram?
Load the Plant vs animal cell template: the cell wall, chloroplasts, large central vacuole and plasmodesmata sit on the plant side, centrioles on the animal side, and the shared organelles such as the nucleus, mitochondria and ribosomes in the middle. Edit any line, or clear the regions for a worksheet. For an illustrated version, use the plant vs animal cell diagram page.
How many regions does a 3-circle Venn diagram have?
Seven inside the circles, plus the region outside all three. In general n sets give 2ⁿ − 1 regions inside the shapes: 3 for two sets, 7 for three and 15 for four.
What is the middle of a Venn diagram called?
The intersection. With two sets it is A ∩ B, the items in both; with three it is A ∩ B ∩ C, the items all three share. In a compare-and-contrast diagram the middle holds the similarities.
Can I export the overlaps as a table?
Yes. With lists, Regions CSV gives one row per region with its notation, count, percentage and items; Membership CSV gives one row per item with a 1 or 0 for each set; and Copy puts the table on the clipboard for Excel or Google Sheets.
Is this an AI Venn diagram generator?
No, and that is deliberate. The diagram is computed, not imagined: every item is sorted into its region by exact set operations, so the counts are always right. If you want an illustrated scientific diagram, such as drawn plant and animal cells, the AI diagram pages on this site do that.
Related tools
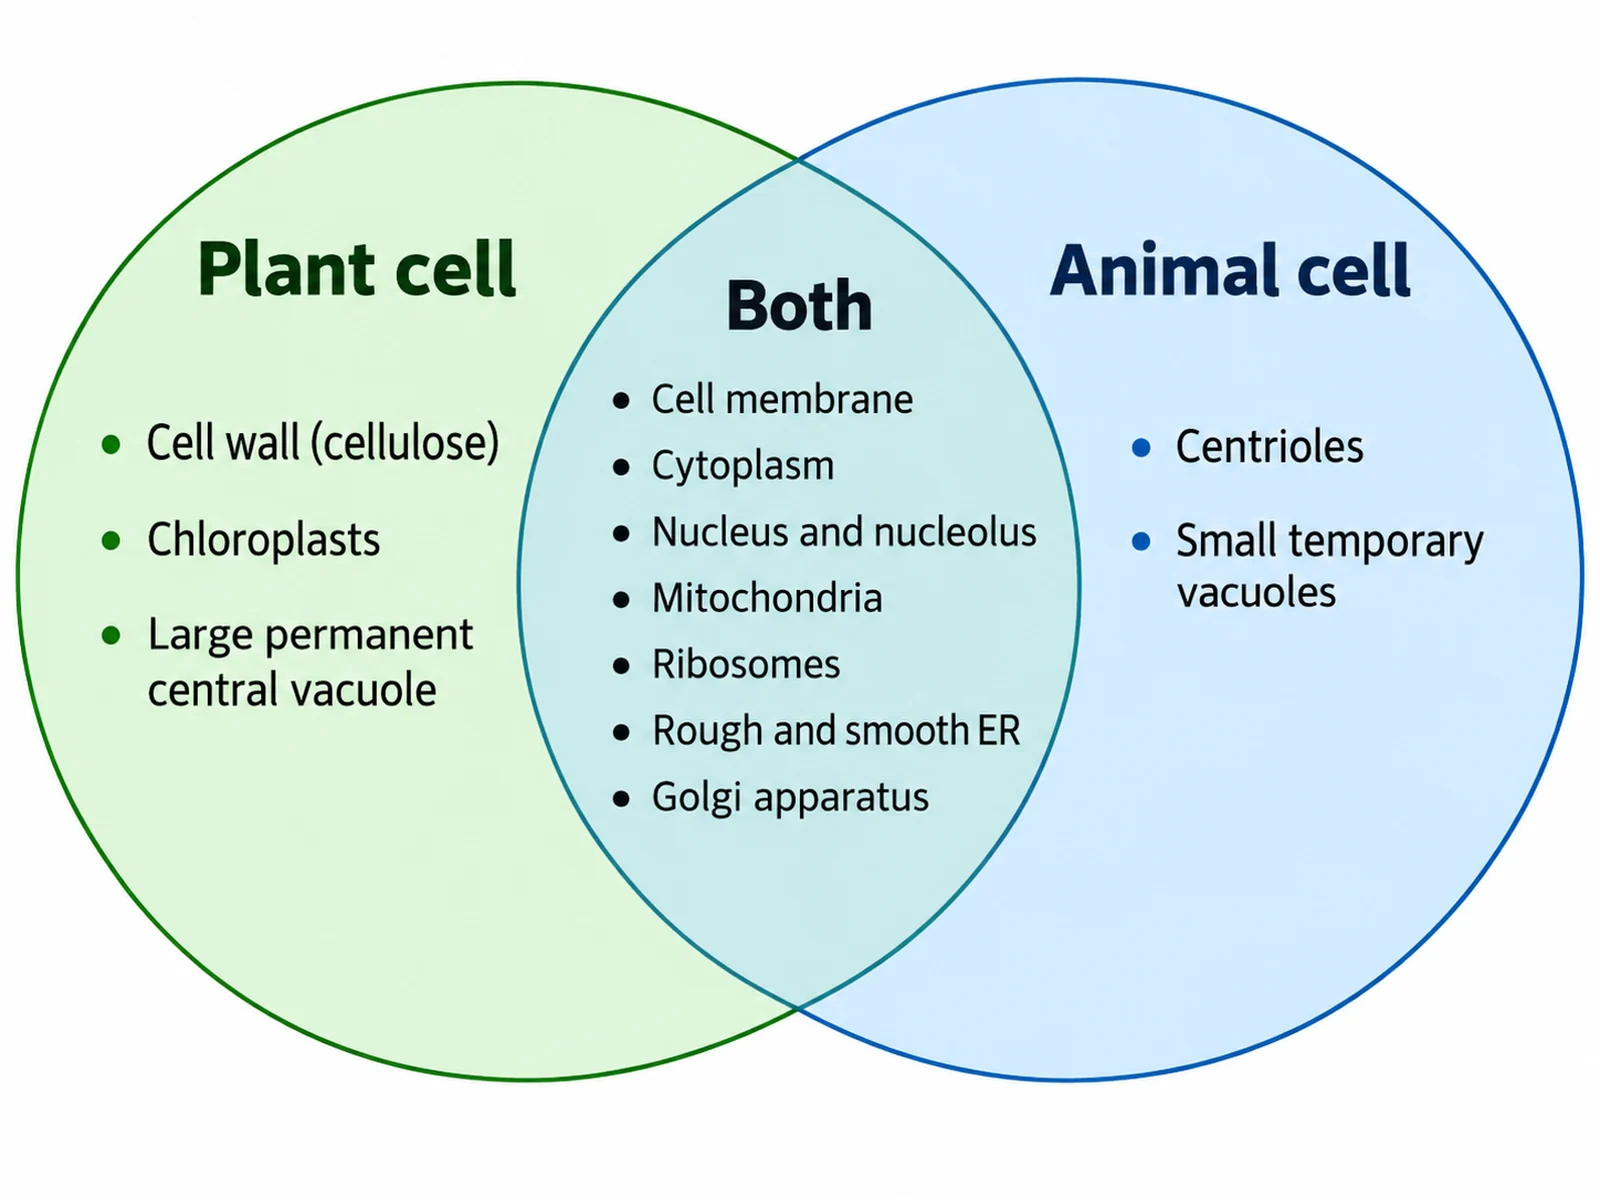
Plant vs Animal Cell Venn Diagram
An illustrated plant and animal cell comparison, labelled or blank, as a Venn diagram or side by side.
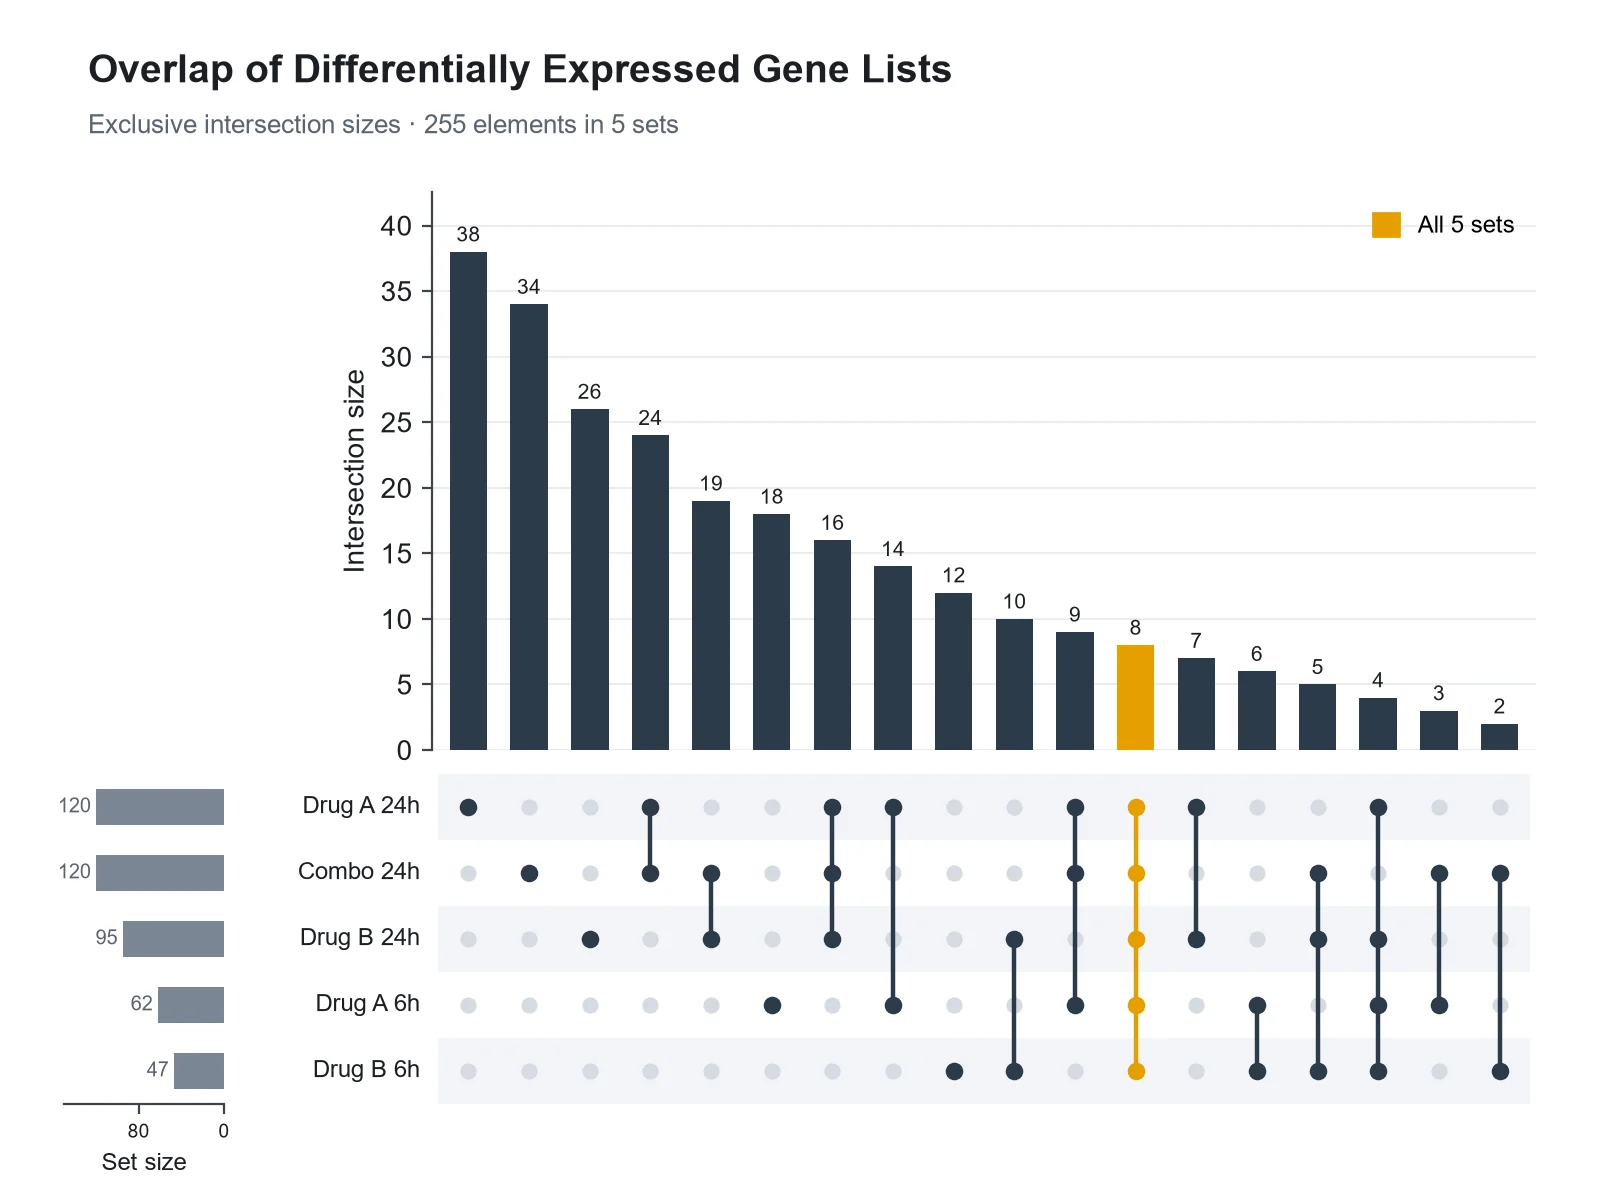
UpSet Plot Generator
For five or more sets: every intersection as a bar, sorted by size, from the same membership table.
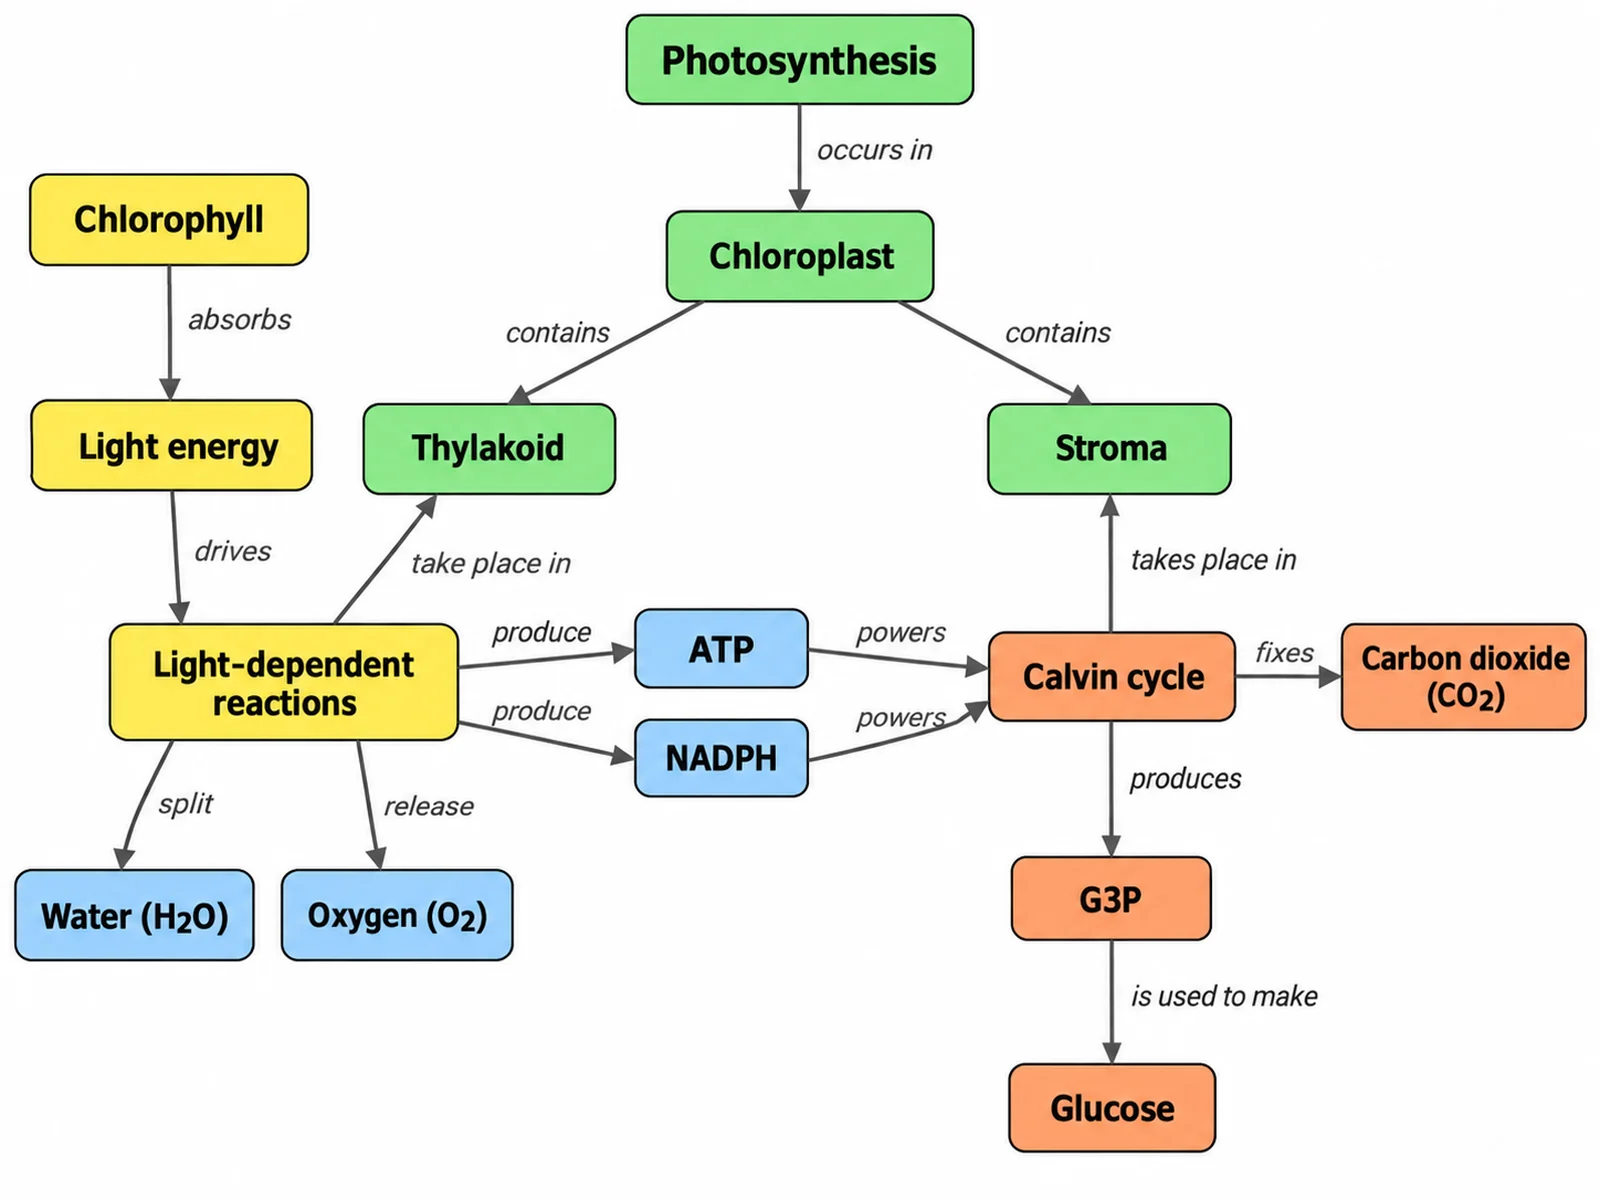
Concept Map Generator
Link ideas with labelled arrows when the relationships matter more than the overlaps.
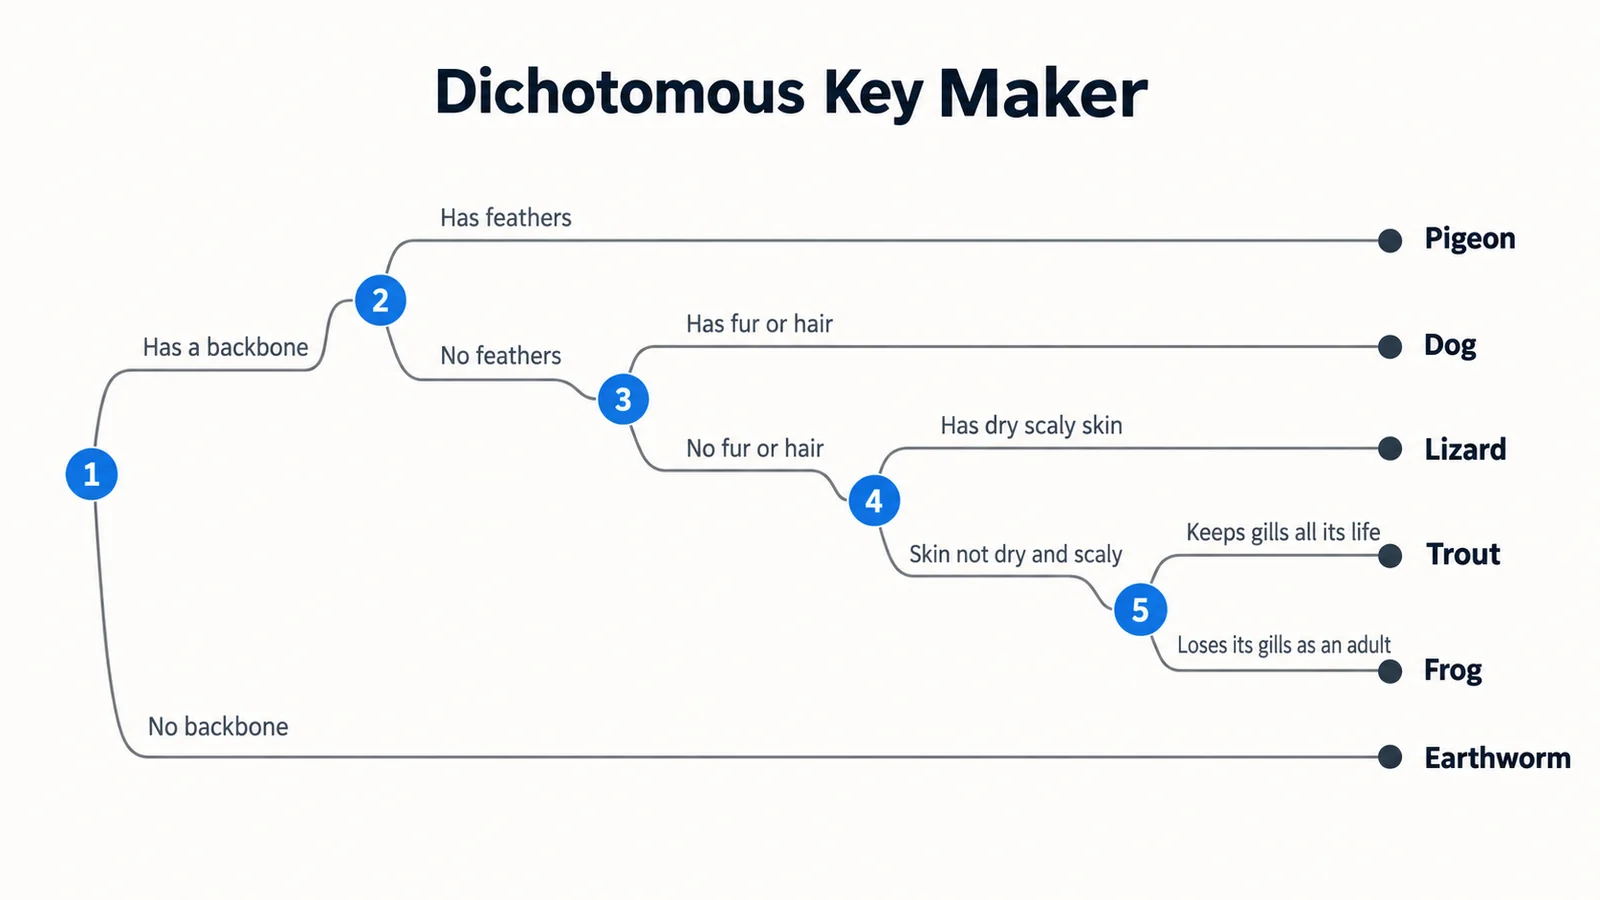
Dichotomous Key Maker
Sort organisms by yes-or-no traits into a branching identification key.
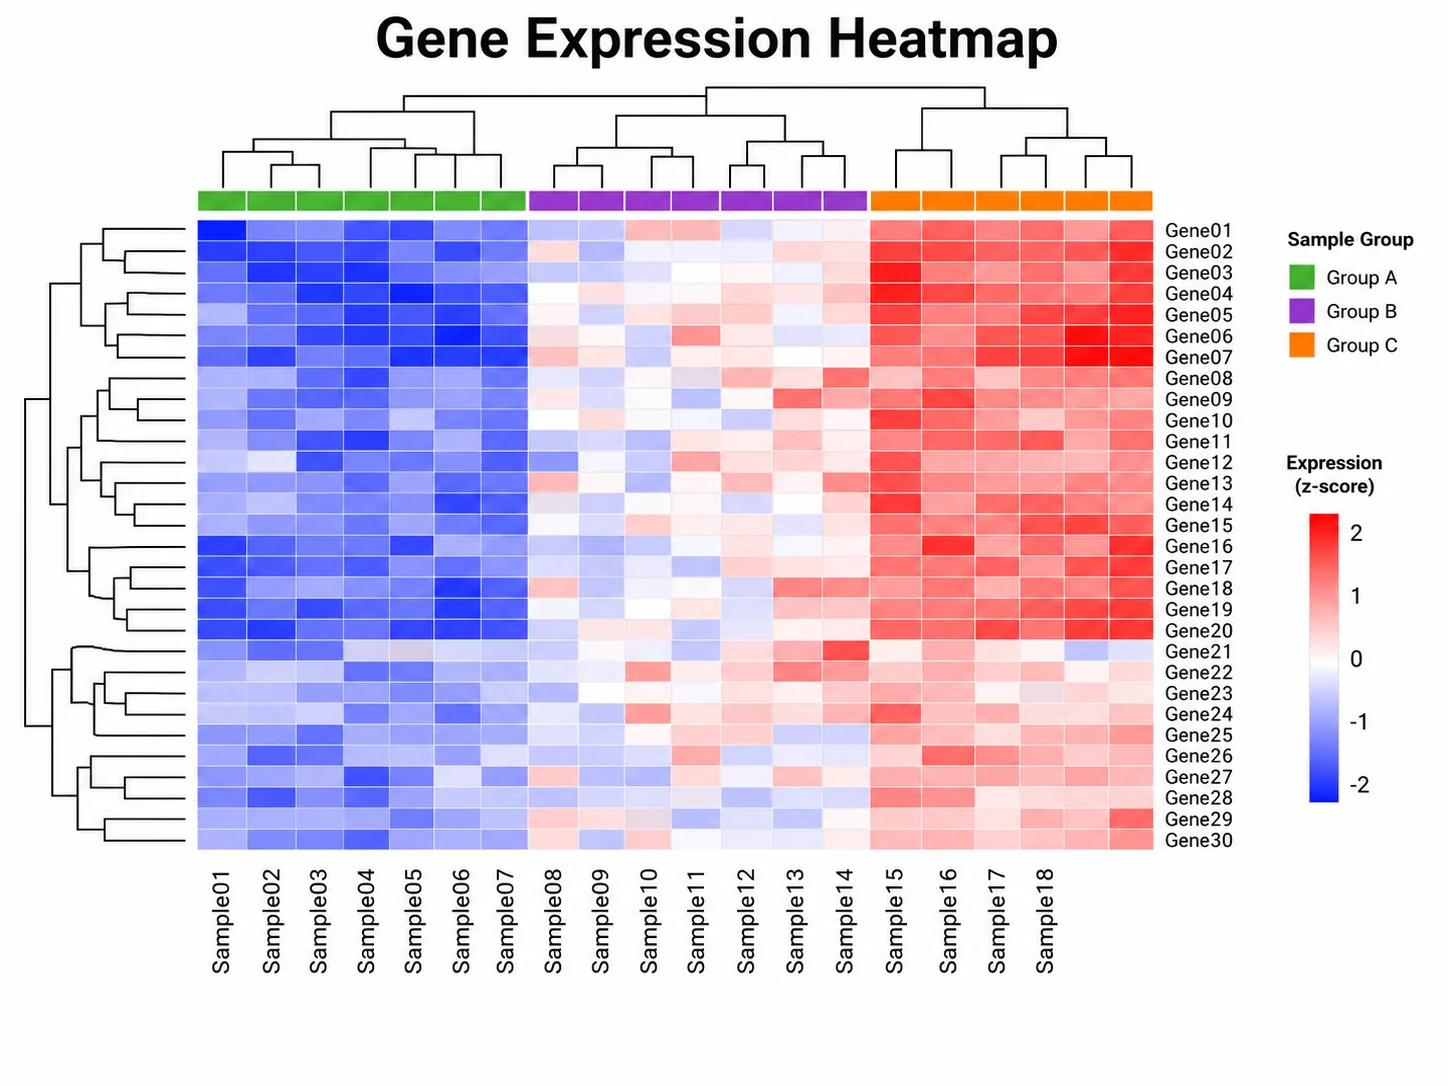
Heatmap Generator
Show how strongly many genes or samples overlap at once, as a clustered colour grid.
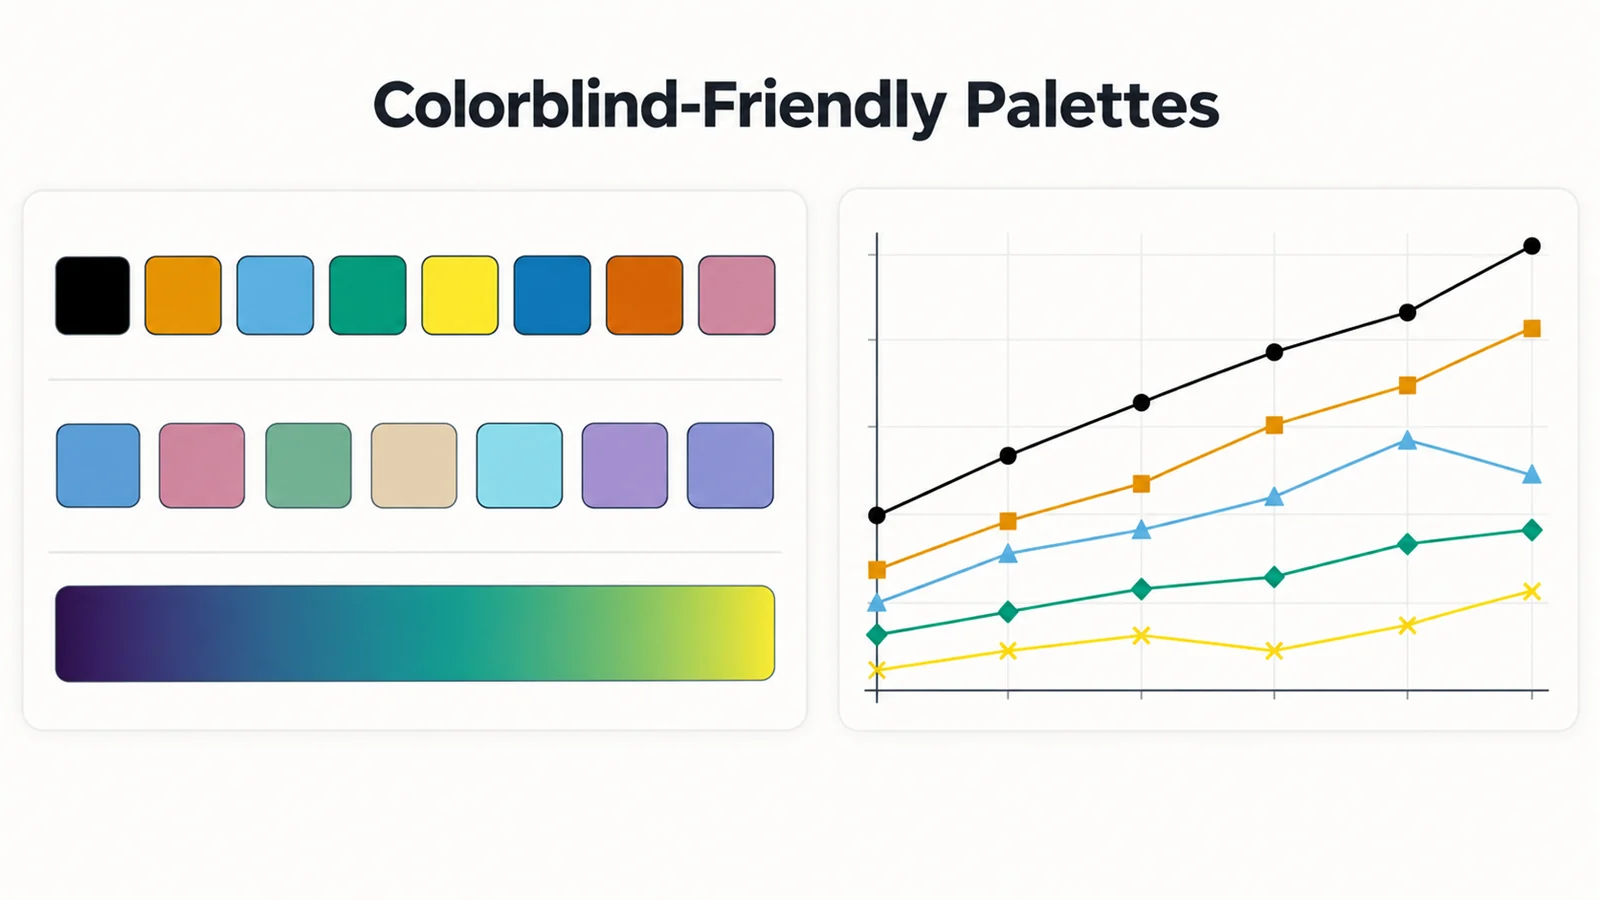
Colorblind-Friendly Palettes
The Okabe-Ito colours used here, with hex codes for R, Python and slides.
Need an illustrated diagram instead?
SciFigure AI draws labelled biology and science diagrams, from cell comparisons to pathways, ready for worksheets, slides and papers.
Browse the diagram toolsLast checked: November 8, 2026. Sources: Venn, On the Diagrammatic and Mechanical Representation of Propositions and Reasonings (1880); Ruskey & Weston, A Survey of Venn Diagrams; OpenStax Contemporary Mathematics: Understanding Venn Diagrams; OpenStax Introductory Statistics: Tree and Venn Diagrams; Wilkinson, Exact and Approximate Area-Proportional Circular Venn and Euler Diagrams (2012); Lex et al., UpSet: Visualization of Intersecting Sets (2014); Okabe & Ito, Color Universal Design.