
Free coordinate grid maker
Make your own coordinate plane, coordinate grid or graph paper
Set the axes, type points such as A(2, 3), and this coordinate plane generator draws them with segments, polygons and lines. Preview a reflection, rotation, translation or dilation with the image labelled A′B′C′, turn it all into plotting, coordinate and transformation worksheets with answer keys, or print graph paper at its true square size. Everything exports as a vector PDF, PNG or SVG.
Free, with no sign-up. Everything runs in your browser, and your last plane is kept on this device only. Undo with Ctrl+Z.
Worked example
One triangle, four transformations, checked by coordinates
Take triangle ABC with A(1, 2), B(5, 2) and C(1, 5). AB is horizontal, so its length is the difference of the x-coordinates, 5 − 1 = 4. AC is vertical: 5 − 2 = 3. BC is slanted, so it needs the distance formula, √(4² + 3²) = 5. That makes ABC a 3-4-5 right triangle with area ½ × 4 × 3 = 6 square units. Now apply each rule to every vertex.
| Transformation | Rule | Image | Sides | Area |
|---|---|---|---|---|
| Reflect across the y-axis | (x, y) → (−x, y) | A′(−1, 2) B′(−5, 2) C′(−1, 5) | 3, 4, 5 | 6 |
| Rotate 90° counterclockwise | (x, y) → (−y, x) | A′(−2, 1) B′(−2, 5) C′(−5, 1) | 3, 4, 5 | 6 |
| Translate 6 left, 5 down | (x, y) → (x − 6, y − 5) | A′(−5, −3) B′(−1, −3) C′(−5, 0) | 3, 4, 5 | 6 |
| Dilate by 2 from the origin | (x, y) → (2x, 2y) | A′(2, 4) B′(10, 4) C′(2, 10) | 6, 8, 10 | 24 |
The reflection, the rotation and the translation all keep the sides at 3, 4, 5 and the area at 6: they are rigid motions, which move a figure without changing its size or shape. The dilation by 2 doubles every side to 6, 8, 10 but multiplies the area by 2² = 4, to 24. Look at the reflected image too: going A → B → C runs counterclockwise around the original but A′ → B′ → C′ runs clockwise around the image, because a reflection reverses orientation while a rotation and a translation keep it.
The coordinate plane is two number lines crossed at zero; for a single line with fractions and inequalities, use the number line generator, and for younger students the rows and columns of a hundreds chart are the first grid they read. When the points are real measurements, plot them with the scatter plot generator or, for values over time, the line chart generator. Semi-log graph paper is what a Bode plot is drawn on, and physics students resolve forces into x and y components with the free body diagram generator.
The parts of a coordinate plane
A coordinate plane is two number lines crossed at right angles at zero. Every point on it is named by an ordered pair (x, y): how far to go across, then how far to go up or down. That order is fixed, so (2, 5) and (5, 2) are different points.
- The horizontal number line is the x-axis and the vertical one is the y-axis. They cross at the origin, (0, 0).
- The x-coordinate comes first and says how far right (positive) or left (negative) of the origin to go. The y-coordinate comes second: up for positive, down for negative.
- The axes cut the plane into four quadrants, numbered with Roman numerals starting at the upper right and going counterclockwise.
- Quadrant I holds points with x and y both positive, quadrant II has x negative and y positive, quadrant III both negative, and quadrant IV x positive and y negative.
- A point with a zero coordinate, such as (0, 4) or (−3, 0), lies on an axis and belongs to no quadrant.
How to make your own coordinate plane
The plane redraws as you type, and nothing leaves your browser.
- Pick a range under Axes: four quadrants from −10 to 10, −5 to 5 or −20 to 20 by twos, or a first-quadrant grid from 0 to 10, 0 to 20 or 0 to 100 by tens. Or type any smallest value, largest value and step for each axis.
- Set the grid: extra lines between grid lines, a darker line every 5 or 10, numbers every line or every few lines, arrowheads, axis names, quadrant numerals, and dots instead of lines.
- Type points and shapes under Plot, one per line, or click the grid in the Plane view to drop a point on the nearest intersection.
- Choose a transformation to preview its image in orange, with the coordinate rule and the image’s coordinates on the answer key.
- Under Worksheet, keep your own shapes or generate plotting, coordinate-reading or transformation questions; under Page, choose Letter or A4 and one to nine grids per sheet.
- Download the PDF with worksheets first and answer keys after, print it straight away, or save the plane as a PNG or SVG.
Plotting points, segments, polygons and lines
Each line of the Plot box is one figure. Name a point once and use its letter afterwards.
- A(2, 3) plots and labels the point A. (4, −1) on its own plots an unnamed point, and so does a bare 4, −1.
- segment A B joins two points; line A B draws the whole line through them, with arrowheads where it leaves the grid.
- polygon A B C closes the shape and shades it. triangle, quadrilateral, rectangle and parallelogram work as well, and the coordinates can go straight in: triangle P(1, 1) Q(4, 1) R(4, 3).
- Without a keyword, two points make a segment and three or more make a polygon. Decimals such as (2.5, −1) and fractions such as (1/2, 3) are fine.
- To graph a linear equation, plot two of its points as a line. For y = 2x + 1 that is line (0, 1) (1, 3).
- Mistakes are reported by line number, for example a point used before its coordinates are given, so nothing silently disappears.
Reflections, rotations, translations and dilations by coordinates
Each transformation is a rule applied to every vertex. The generator draws the image and prints the rule, so students can check both the picture and the arithmetic.
- Reflection across the x-axis: (x, y) → (x, −y). Across the y-axis: (x, y) → (−x, y).
- Reflection across y = x: (x, y) → (y, x). Across y = −x: (x, y) → (−y, −x).
- Rotation of 90° counterclockwise about the origin: (x, y) → (−y, x). 180°: (x, y) → (−x, −y). 90° clockwise, the same as 270° counterclockwise: (x, y) → (y, −x).
- Translation a units right and b units up: (x, y) → (x + a, y + b), with negative numbers for left and down.
- Dilation by a scale factor k from the origin: (x, y) → (kx, ky). Lengths multiply by k and areas by k².
- Reflections, rotations and translations keep every length and angle; only a dilation changes size. Arrows from each vertex to its image make a translation easy to see.
Coordinate plane activities by grade
In the US Common Core standards the coordinate plane arrives in grade 5 and is used in every grade after it.
- Grade 5, 5.G.A.1 and 5.G.A.2: use perpendicular axes to define a coordinate system and graph points in the first quadrant to solve problems. Print first-quadrant grids from 0 to 10 with the Plot the points worksheet.
- Grade 6, 6.NS.C.6: extend the axes to negative numbers, and see that points whose coordinates differ only in sign are reflections across one or both axes. Plot A(3, 2), then (−3, 2), (3, −2) and (−3, −2).
- Grade 6, 6.NS.C.8 and 6.G.A.3: graph points in all four quadrants, draw polygons from their vertices, and find the length of a side joining points with the same x or the same y.
- Grade 8, 8.G.A.3: describe the effect of dilations, translations, rotations and reflections using coordinates. The Transformations worksheet mixes all four.
- Grade 8, 8.G.B.8: use the Pythagorean theorem to find the distance between two points. Any slanted segment on the grid is the hypotenuse of a right triangle drawn along the grid lines.
- High school: the same grids carry slope, linear equations and coordinate proofs, where squares that stay square matter for every angle and distance.
Coordinate grid worksheets with answer keys
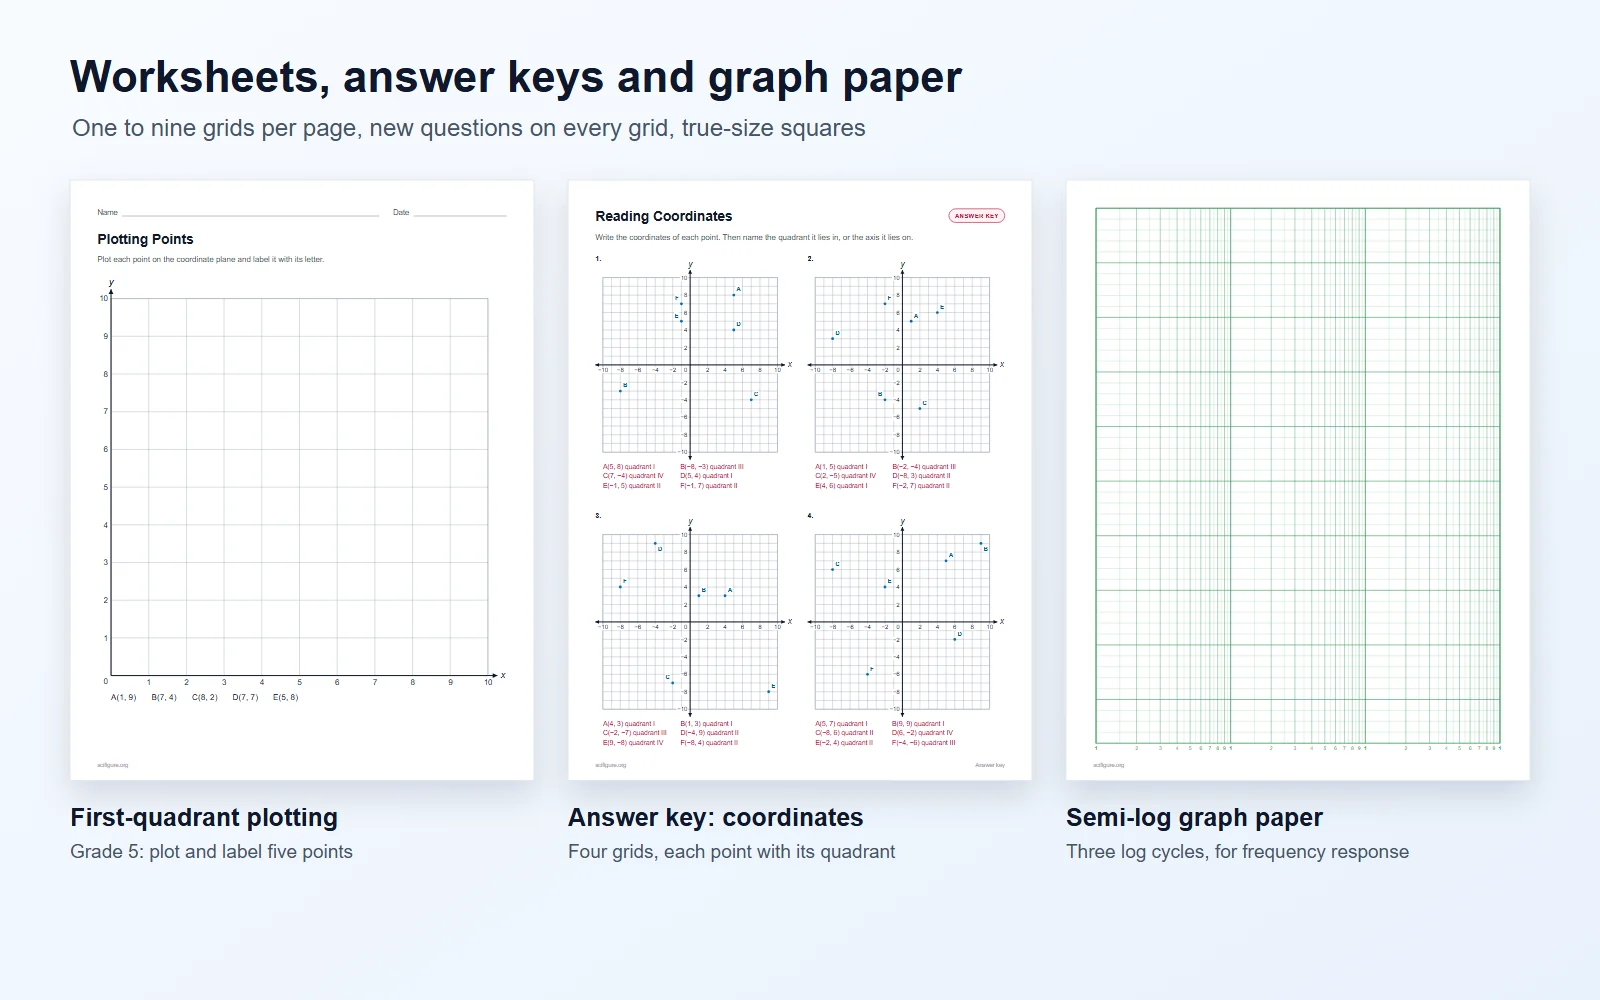
Three worksheet types generate their own questions, so every grid on a page can be different and a fresh set is one click away.
- Plot the points: a list of points under each grid for students to plot and label. The key shows them plotted.
- Name the coordinates: points already plotted for students to read, optionally with the quadrant or axis each lies on. The key gives every answer.
- Transformations: a triangle or quadrilateral with an instruction such as “Rotate triangle ABC 180° about the origin”. The key draws the image, prints the rule and lists the image’s coordinates.
- Generated points sit on grid intersections, at least two squares apart where they fit, away from the edges, and spread over every quadrant the grid has. Letters skip I and O, which read as 1 and 0, and are shuffled so A is not always in the same quadrant.
- Transformation figures are kept compact and, wherever possible, clear of their own image, so neither hides the other.
- Up to nine grids per page and 20 pages per PDF, each with its own questions; “New questions” makes another set.
Choosing the range and scale
- Four quadrants from −10 to 10 is the standard practice grid; −5 to 5 gives bigger squares for younger students.
- Use a first-quadrant grid when every value is positive, as in grade 5 and in most real-world data.
- Count by 2s, 5s or 10s when the numbers are large; label every second or fifth line to keep the axes readable.
- Each grid square is always square, even when the x and y steps differ, so shapes are not stretched and slopes look as steep as they are.
- If a range does not start or end on a whole step, the axis is widened to the next grid line and the tool says so.
Printable graph paper, dot paper and semi-log paper
Switch to Graph paper for a full page of grid at a true, measurable size.
- Square sizes: 1/4 inch (four squares per inch, the usual school graph paper), 1/5 inch, 1/8 inch, 1/2 inch, 1 cm, 5 mm and 2 mm.
- A darker line every 4, 5 or 10 squares makes counting faster; dot paper keeps only the intersections for a lighter page.
- Semi-log paper has a logarithmic horizontal axis of one to six cycles and a linear vertical axis. It is the frequency response graph paper used for Bode plots, and it straightens exponential growth and decay.
- Squares are laid out in whole units and centred on the page; print at 100% and a ruler will confirm the size.
Printing tips
- Print at 100% or “Actual size”, not “Fit to page”, whenever the square size matters.
- The Black grid colour survives photocopying; Ink saver uses light grey lines for everyday practice.
- Two grids per page suit a do-now and an exit ticket; four to nine give a full practice sheet.
- The PDF is vector, so lines stay sharp at any size and the text stays selectable. The SVG opens in Illustrator, Inkscape or PowerPoint for further editing.
A coordinate plane for slides and digital lessons
- Project the Plane view and click to plot points live; click a point again to remove it.
- Export a PNG for Google Slides, Seesaw or a learning platform, where students can drag markers onto the grid.
- The plane is drawn with equal squares and clean labels, so it also works as a figure in notes, tests and handouts.
Frequently asked questions
Is this coordinate plane generator free?
Yes. There is no sign-up and no limit on planes, pages or downloads, and the PDF, PNG and SVG exports are free. It runs entirely in your browser, and your last plane is saved on your own device.
How do I make a coordinate plane with only the first quadrant?
Set the smallest x and the smallest y to 0, or pick one of the 1st quadrant presets. The axes then start at the origin in the lower-left corner, with arrowheads only at the positive ends and a single 0 in the corner.
Which number comes first in an ordered pair?
The x-coordinate. In (3, −2) you move 3 right from the origin, then 2 down. A simple reminder: across first, then up or down, the way x comes before y in the alphabet.
How are the quadrants numbered?
With Roman numerals, starting at the upper right and going counterclockwise: I (x positive, y positive), II (x negative, y positive), III (both negative) and IV (x positive, y negative). Points on an axis are in no quadrant. Turn on Quadrant numbers I–IV to print them on the grid.
How do I reflect a shape across the x-axis or y-axis?
Change the sign of one coordinate. Across the x-axis, (x, y) becomes (x, −y); across the y-axis, (x, y) becomes (−x, y). Type the shape under Plot, choose the reflection, and the image appears in orange with its vertices labelled A′, B′, C′.
What is the rule for a 90° rotation about the origin?
Counterclockwise, (x, y) becomes (−y, x); clockwise, it becomes (y, −x). A 180° rotation either way gives (−x, −y). The answer key prints the rule beside the image coordinates.
How do I show a translation on a coordinate grid?
Choose Translate, enter how far to move right (x) and up (y), using negative numbers for left and down, and switch on the arrows from each point to its image. The rule appears in the form (x, y) → (x + a, y + b).
Can I make coordinate grid worksheets with answer keys?
Yes. Plot the points, Name the coordinates and Transformations generate their own questions for every grid, from one to nine per page, and the PDF ends with answer keys in red. Your own typed shapes with a transformation also make a worksheet, with the image on the key only.
Can I make blank graph paper?
Yes. Switch to Graph paper and pick squares, dots or semi-log, a square size from 2 mm to 1/2 inch, a darker line every few squares and a colour. Leave the title off for a full page of grid, and print at 100% to keep the size exact.
What is semi-log graph paper used for?
Data that spans several powers of ten on one axis, such as the frequency axis of a frequency response or Bode plot, or values that grow or decay exponentially, which plot as straight lines on it. Choose from one to six log cycles across the page.
Can I count by 2s, 5s or 10s on the axes?
Yes. Set the x step and y step, for example 0 to 100 by 10 for data, and choose how often the lines are numbered. The grid squares stay square either way.
Can I draw a line or graph an equation?
Draw the line through two of its points: for y = 2x + 1, type line (0, 1) (1, 3). The line runs to the edges of the grid with arrowheads. For data points with a trend line, the scatter plot generator is the better tool.
Can I put several coordinate planes on one page?
Yes: 1, 2, 4, 6 or 9 grids per page on US Letter or A4. The grids are numbered, the labels thin out automatically when the squares get small, and each grid can get its own questions.
Can I edit the coordinate plane after downloading it?
The PDF keeps its text as real text and opens in any PDF editor. For full editing, download the SVG, where every line, point and label is a separate object in Illustrator, Inkscape, Affinity Designer or PowerPoint.
Related tools
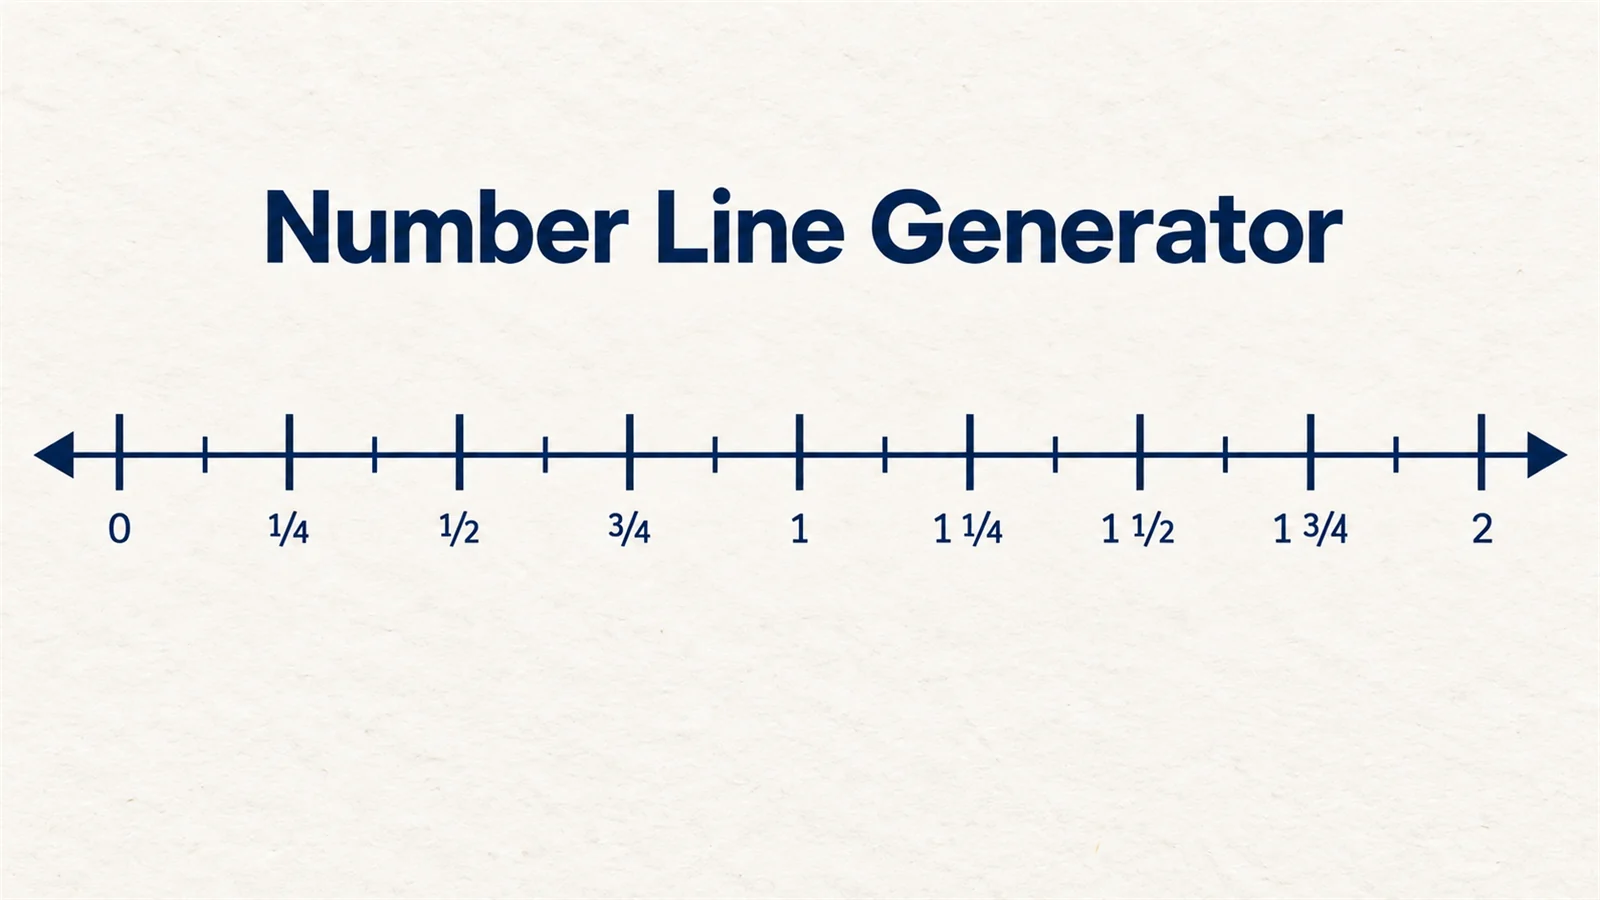
Number Line Generator
One axis at a time: fractions, marked points and shaded inequalities.
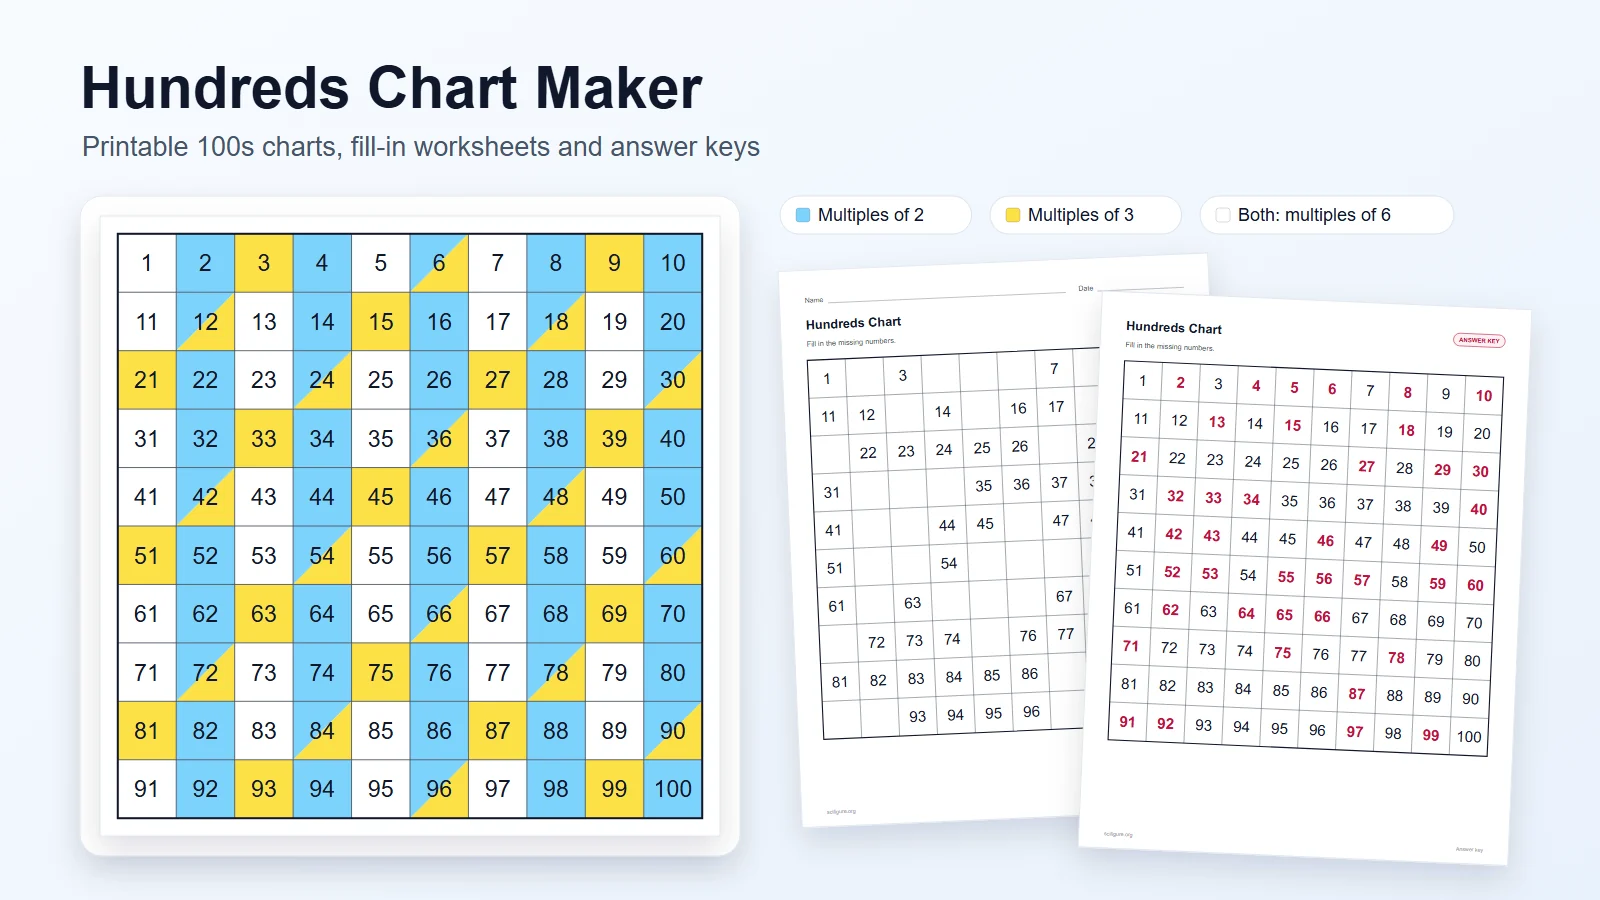
Hundreds Chart Maker
Printable 1–100 and 120 charts with missing numbers, patterns and answer keys.
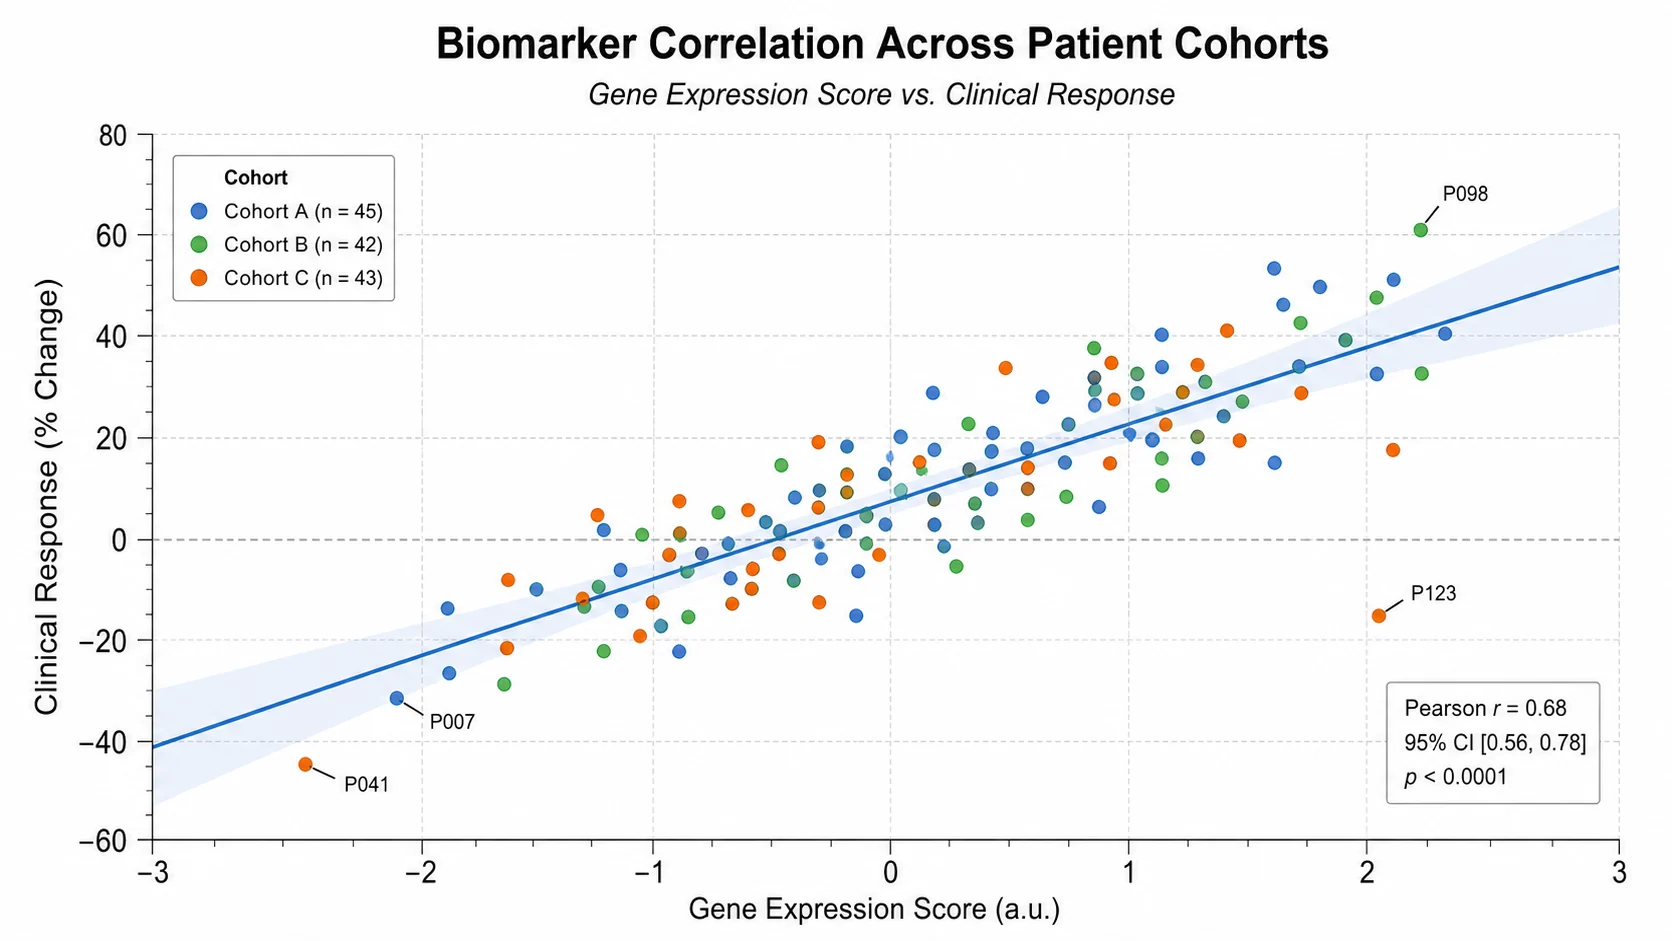
Scatter Plot Generator
Turn paired x, y measurements into a publication-ready scatter plot with trends and groups.
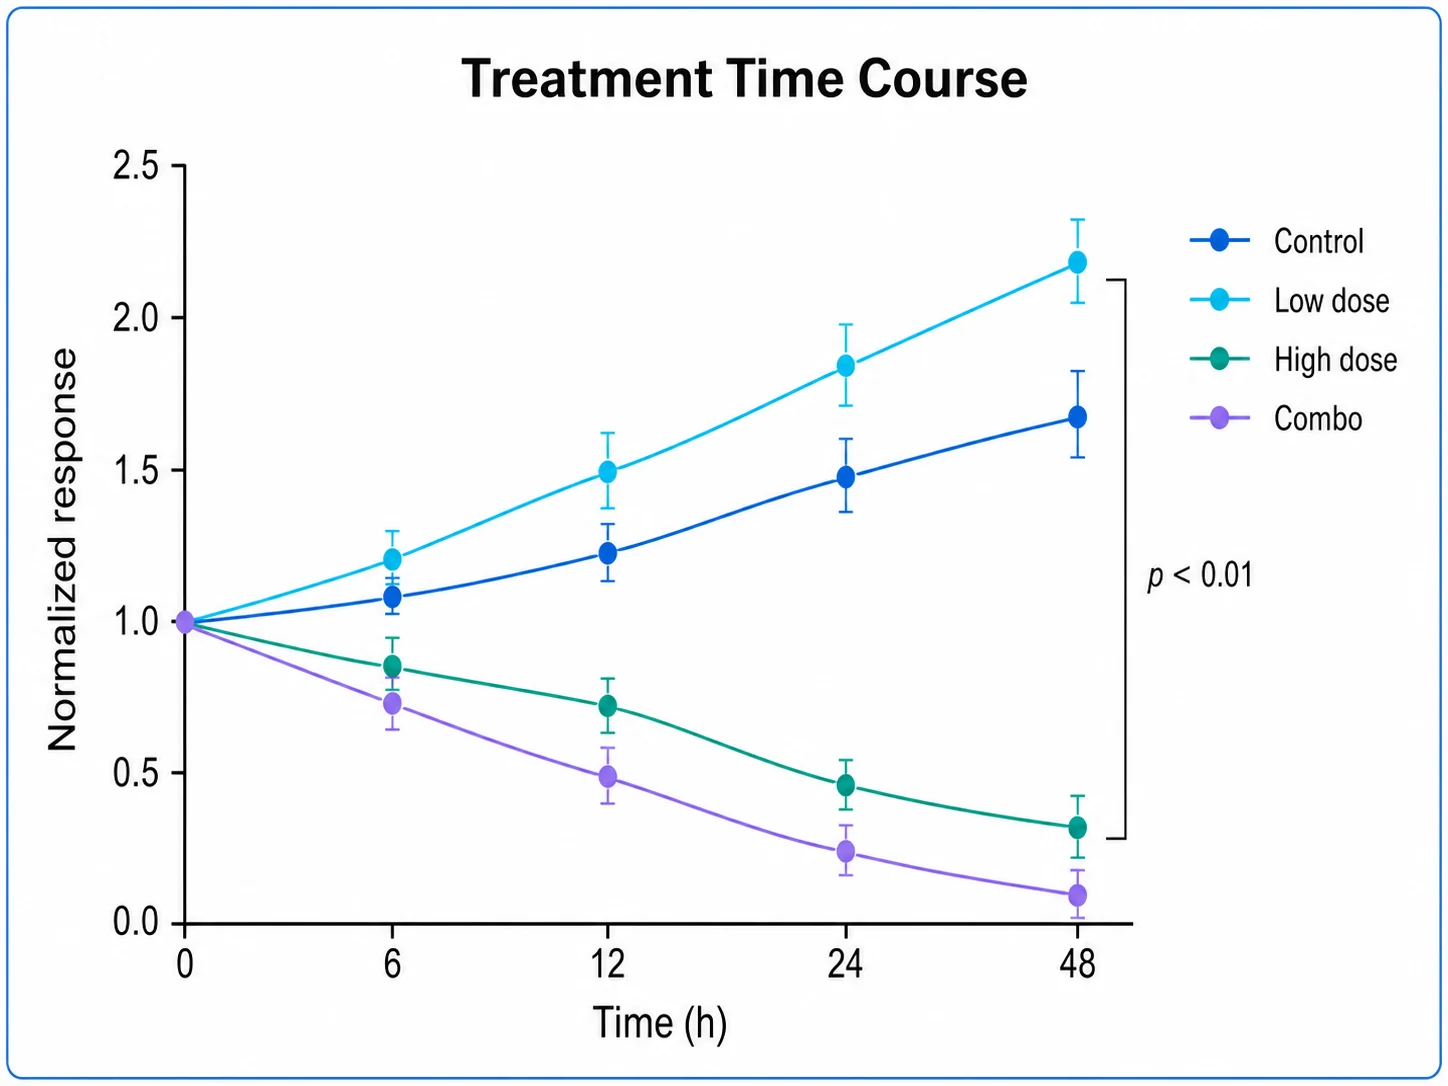
Line Chart Generator
Turn time courses and other ordered measurements into a clean line chart.
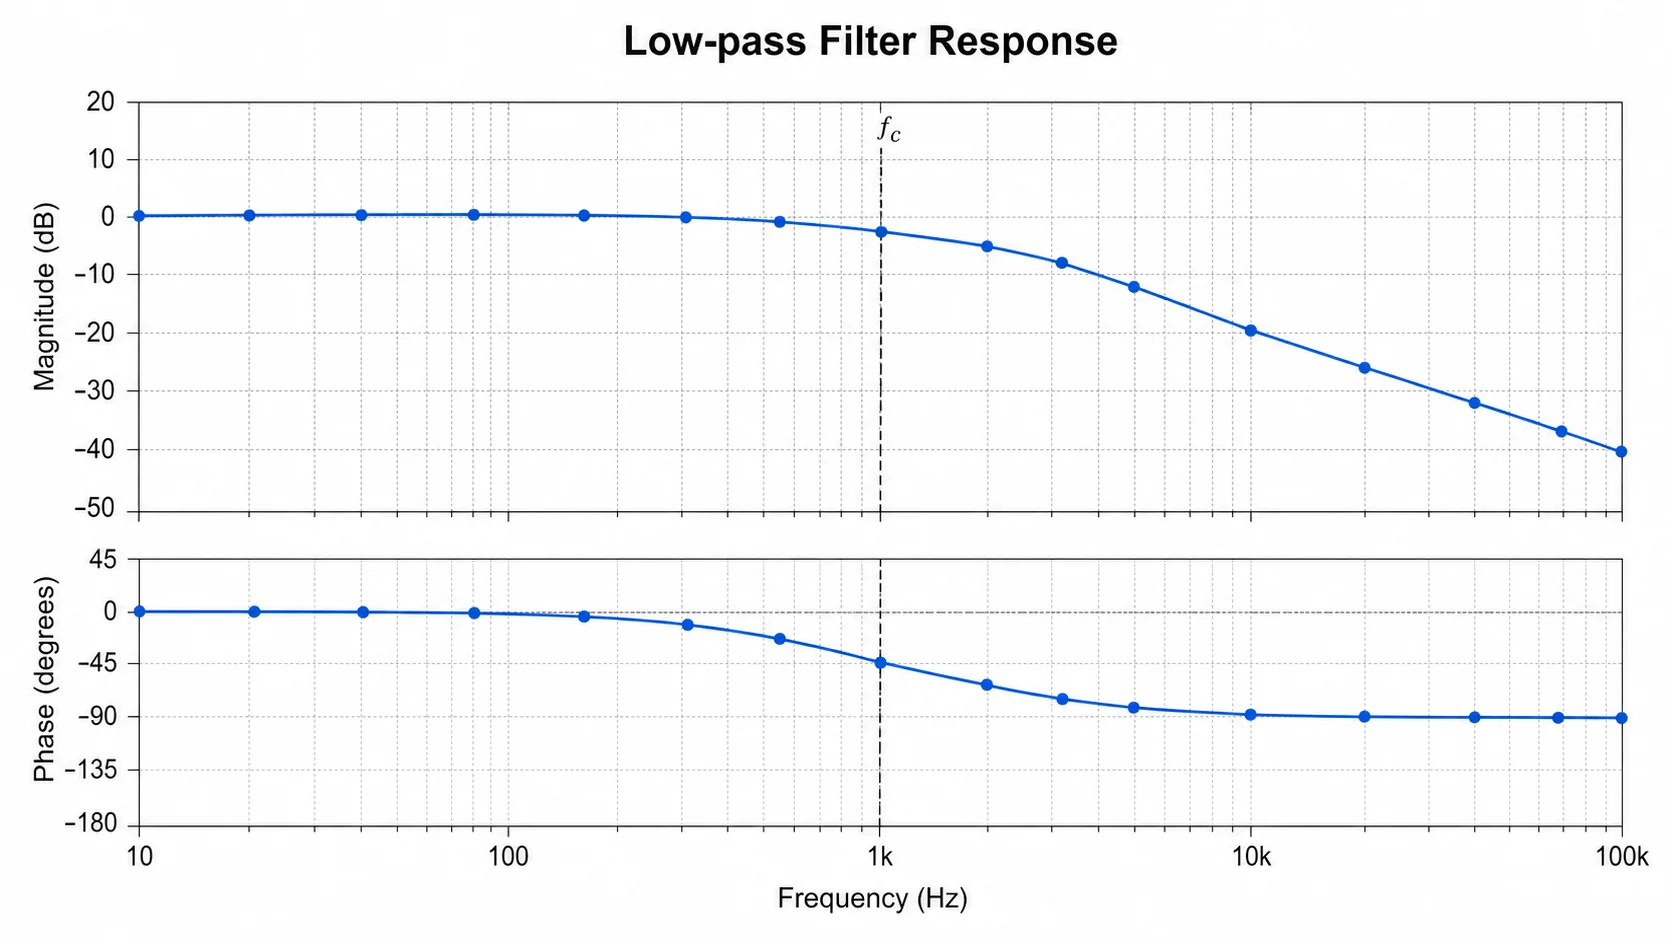
Bode Plot Generator
Frequency, magnitude and phase data drawn on log-scale axes, the plot semi-log paper is made for.
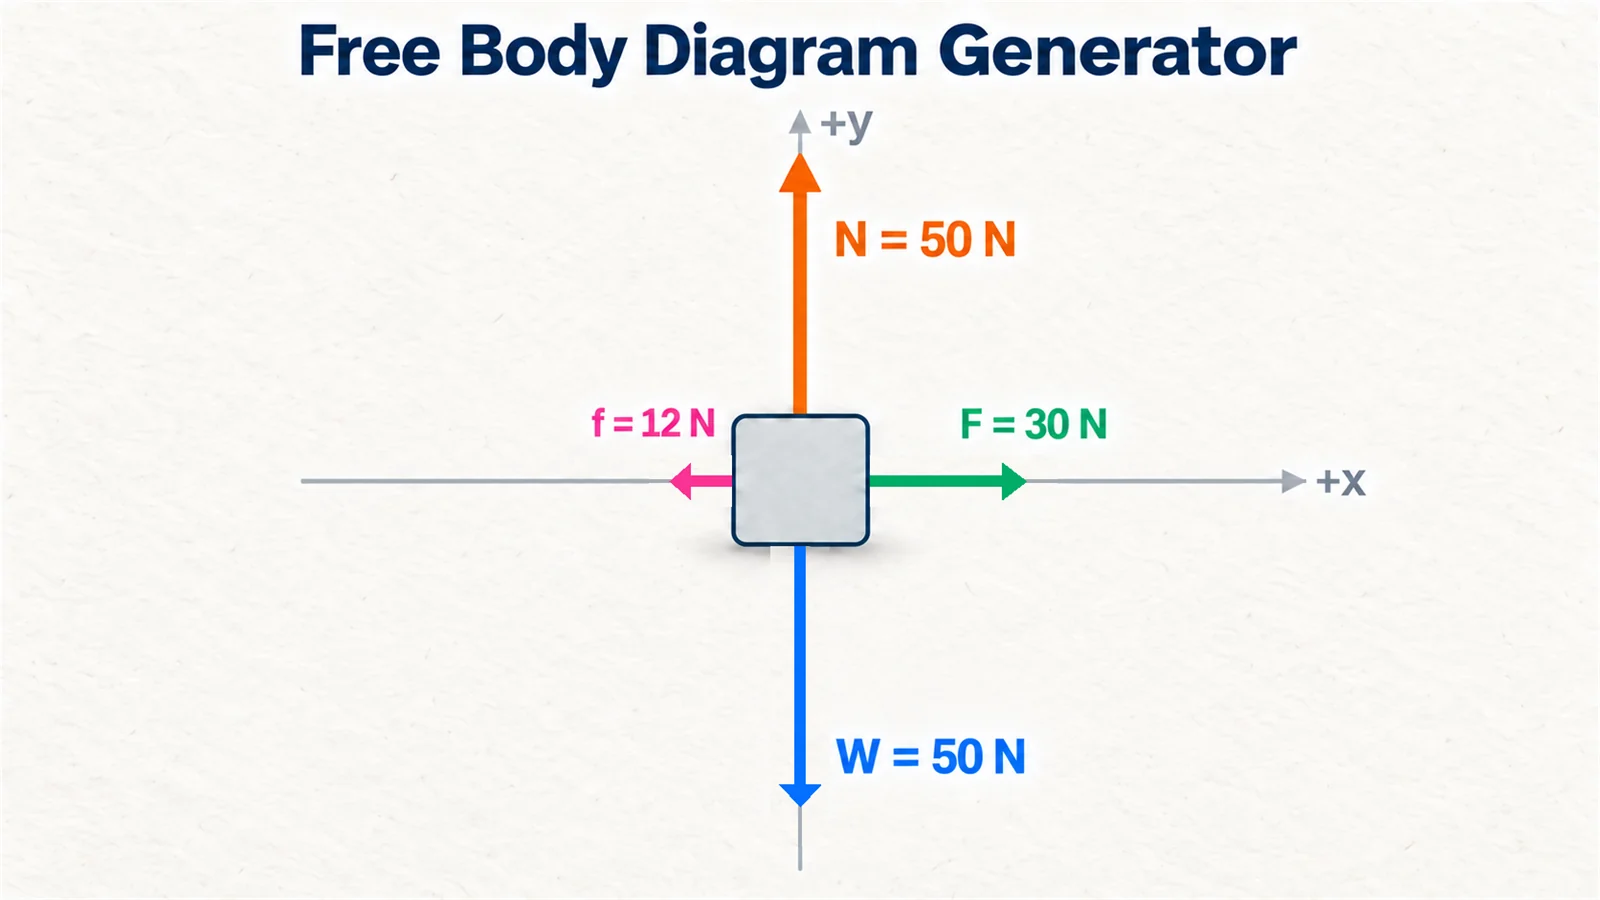
Free Body Diagram Generator
Forces drawn to scale on x and y axes, with their components.
More free tools for the classroom
Hundreds charts, number lines, Punnett squares, food webs and diagram makers, free to use and print.
Browse the free toolsLast checked: November 8, 2026. Sources: Common Core: Grade 5 Geometry; Grade 6 The Number System; Grade 6 Geometry; Grade 8 Geometry; OpenStax Prealgebra 2e, 11.1 Use the Rectangular Coordinate System.