Cell Cycle Diagram AI

Cell Cycle Diagram Generator

Draw the cell cycle as a labeled loop with G1, S, G2, and M phase, as a pie chart of phase durations, or as a blank version for students to complete.

Loop or pie chartCheckpoints includedLabeled or blank

AI Cell Cycle Diagram Generator

Describe the format and which phases or checkpoints to label.

Costs 5 credits345 / 2000 characters

Generate a publication-ready PNG from your description.

Preview

Cell Cycle Diagram Example Previews

Target aspect ratio: 1:1

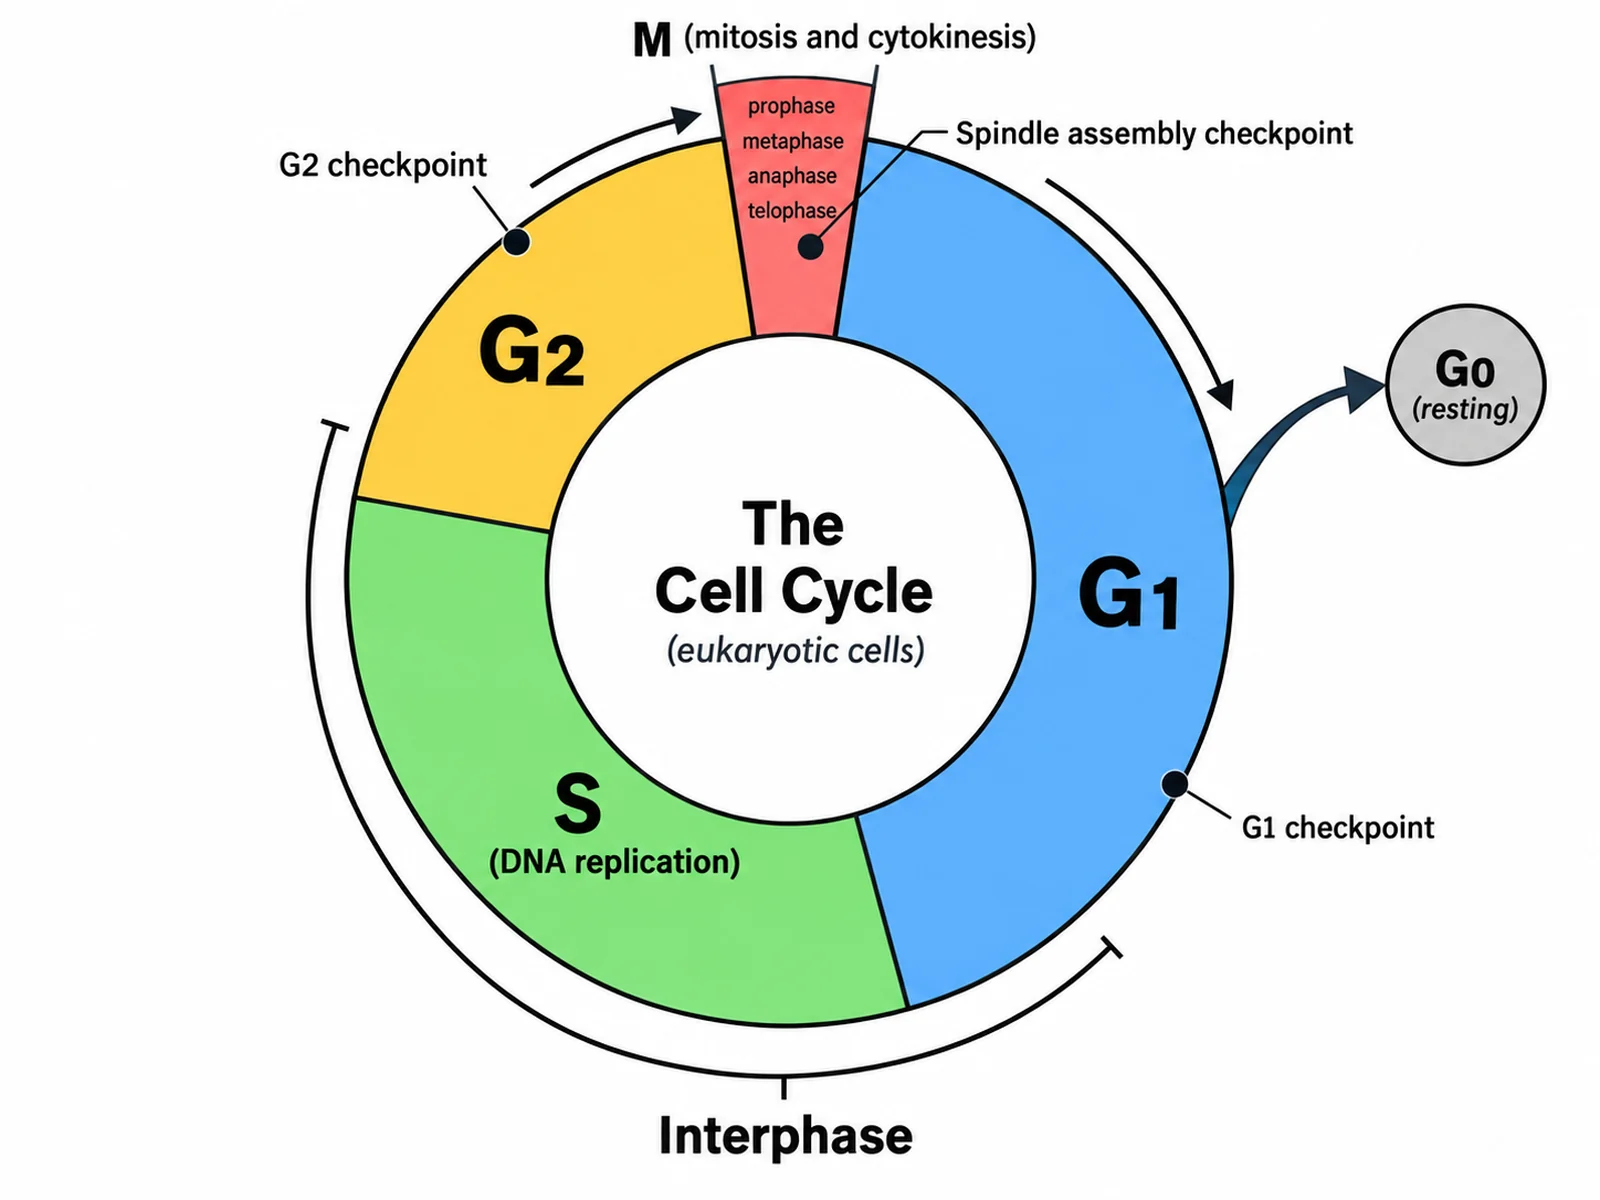
Labeled cell cycle diagram showing G1, S, G2, and M phase around a loop with interphase bracketed and checkpoints marked
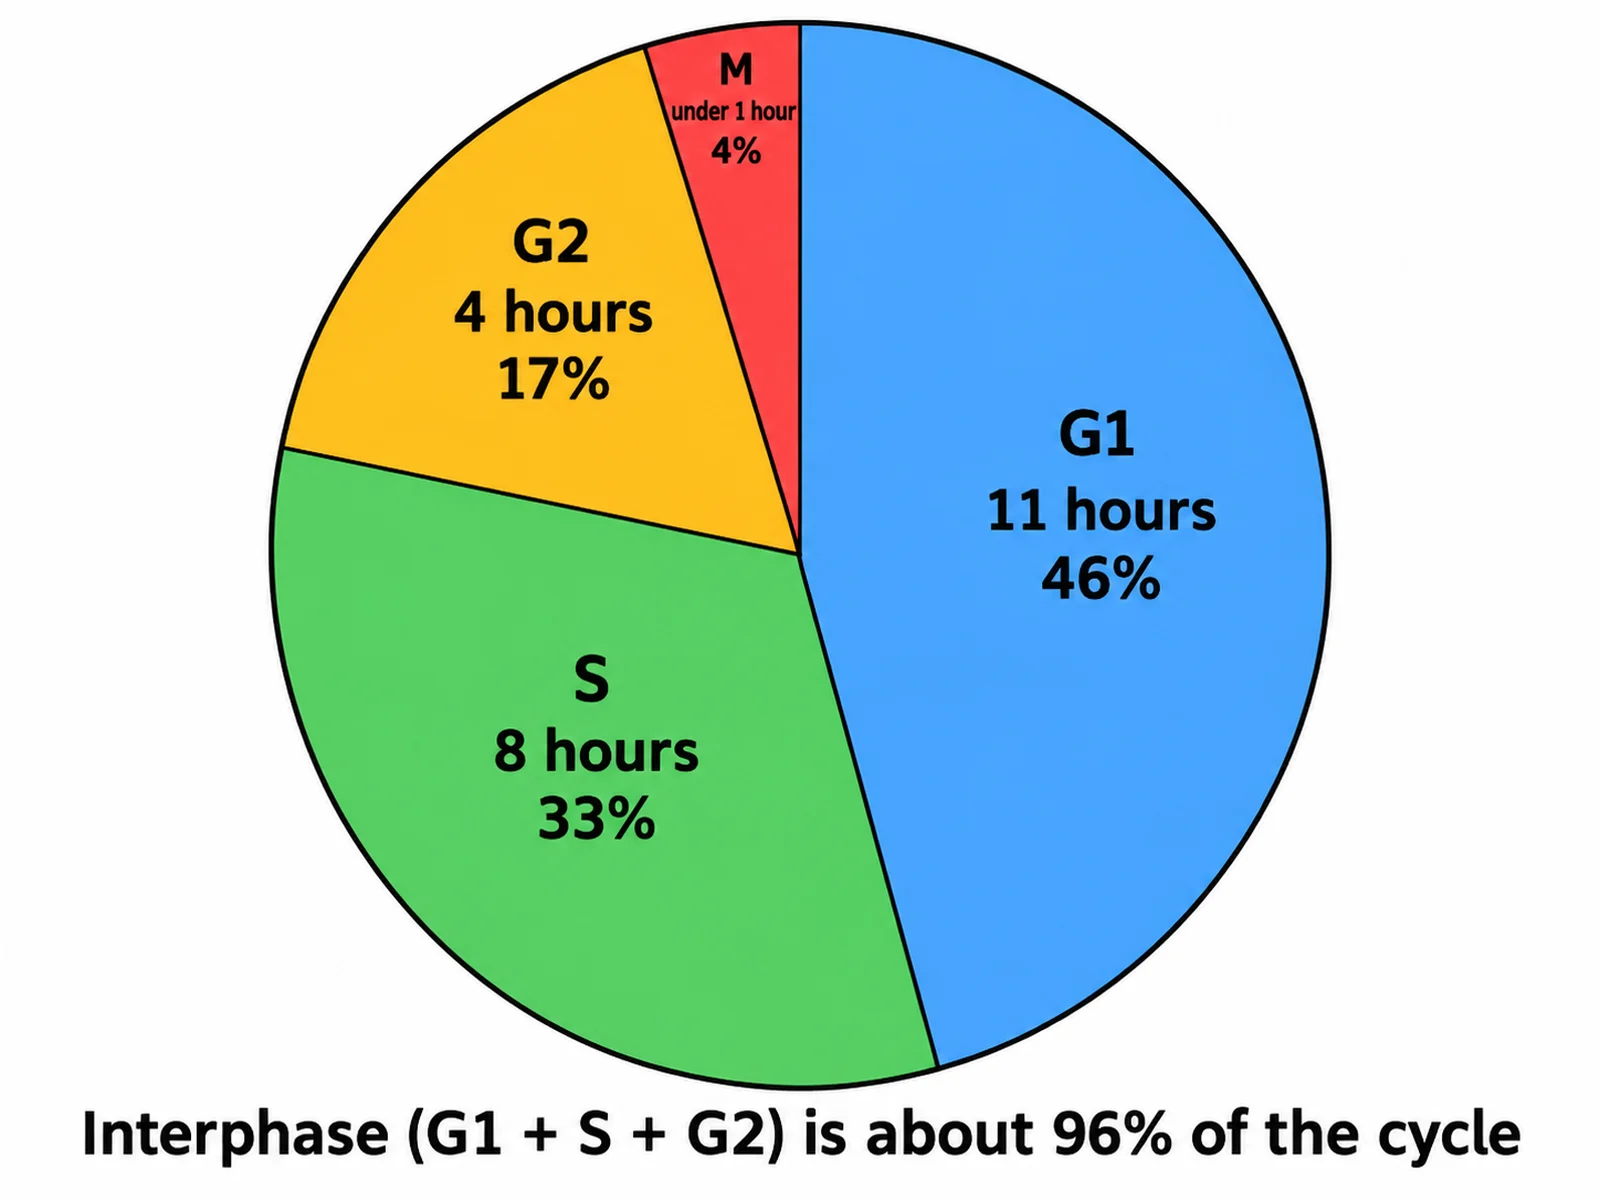
Pie chart of cell cycle phase durations showing G1 at 11 hours, S at 8 hours, G2 at 4 hours, and M under 1 hour
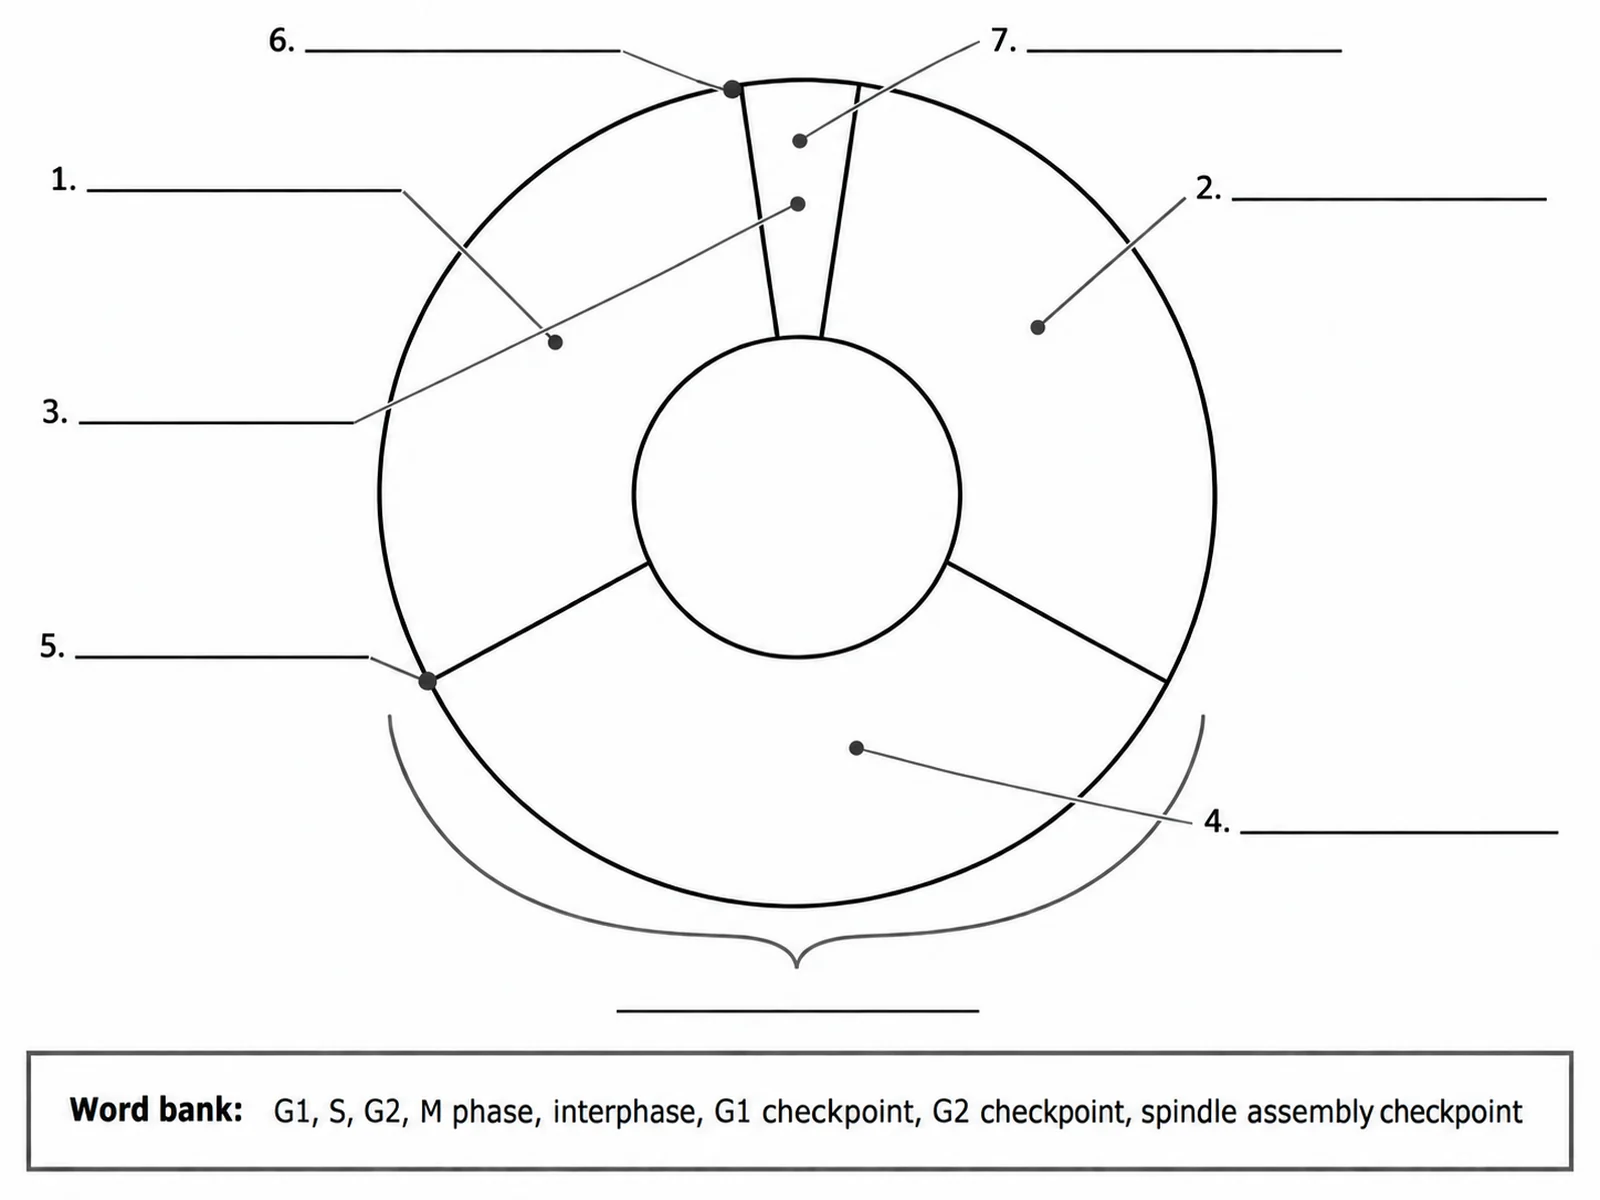
Blank cell cycle diagram with an empty divided ring and numbered lines for students to complete

Sample previews. Describe your diagram to generate your own cell cycle figure.

Cell Cycle Diagram Examples

Use these as visual directions for labeled loops, duration pie charts, checkpoint figures, chromosome-state diagrams, and blank worksheets.

Labeled cell cycle diagram showing G1, S, G2, and M phase around a loop with interphase bracketed and checkpoints marked

Prompt

Create a fully labeled cell cycle diagram on a white background. Draw a thick circular ring divided clockwise into four coloured sectors: a large blue "G1" sector, a green "S (DNA replication)" sector, an amber "G2" sector, and a thin red "M (mitosis and cytokinesis)" sector. Add a curved bracket outside the ring spanning G1, S, and G2 labeled "Interphase". Inside the M sector, print the four mitotic stages in small text: prophase, metaphase, anaphase, telophase. Mark three checkpoints as small dark dots with leader labels: "G1 checkpoint" at the end of G1, "G2 checkpoint" at the end of G2, "Spindle assembly checkpoint" within M. Draw a branch arrow leaving G1 outward to a grey node labeled "G0 (resting)". Add a clockwise direction arrow around the ring.
Labeled Cell Cycle

Pie chart of cell cycle phase durations showing G1 at 11 hours, S at 8 hours, G2 at 4 hours, and M under 1 hour

Prompt

Create a cell cycle pie chart on a white background showing phase durations for a typical 24-hour human cell cycle. Draw proportional sectors: "G1" at about 11 hours (165 degrees, blue), "S" at about 8 hours (120 degrees, green), "G2" at about 4 hours (60 degrees, amber), and "M" at under 1 hour (15 degrees, red). Label each sector with its name, its hours, and its percentage: G1 46%, S 33%, G2 17%, M 4%. Add a caption beneath reading "Interphase (G1 + S + G2) is about 96% of the cycle". Keep the M sector visibly thin.

Cell Cycle Pie Chart

Blank cell cycle diagram with an empty divided ring and numbered lines for students to complete

Prompt

Create a blank cell cycle worksheet. Draw the same divided ring in clean line art with pale uniform fills and no text inside any sector. Draw a leader line from each of the four sectors out to a short horizontal ruled blank line, numbered 1 to 4, and three more leader lines from the checkpoint positions to blanks numbered 5 to 7. Add an empty bracket outside the ring with a blank line above it. Include a word bank box reading "G1, S, G2, M phase, interphase, G1 checkpoint, G2 checkpoint, spindle assembly checkpoint". Generous white space, no answer key.

Blank Cell Cycle Worksheet

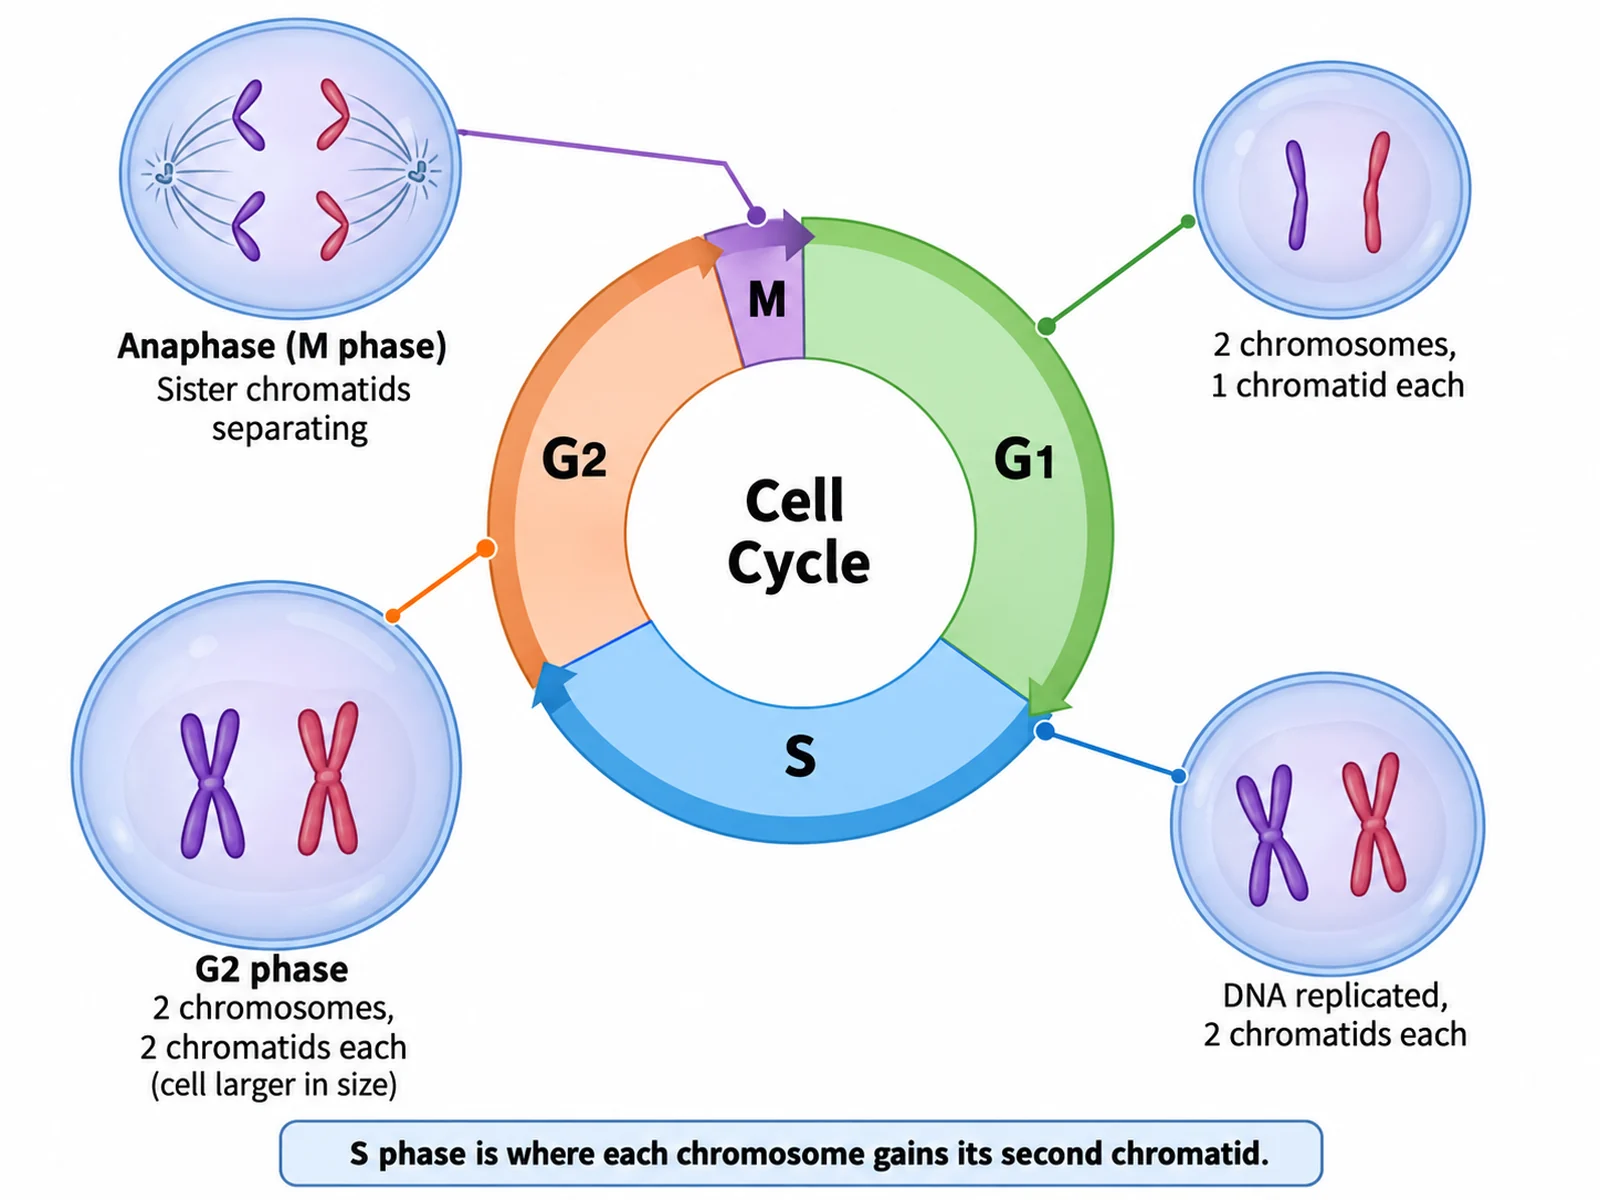
Cell cycle diagram showing chromosome state at each phase, with single chromatids before S phase and paired chromatids after

Prompt

Create a cell cycle diagram that shows chromosome state at each phase. Draw the four-sector ring, and around the outside place four small cell illustrations connected by leader lines: beside G1 a cell with two single-chromatid chromosomes labeled "2 chromosomes, 1 chromatid each"; beside the end of S a cell with two double-chromatid chromosomes labeled "DNA replicated, 2 chromatids each"; beside G2 the same but with the cell visibly larger; beside M a cell mid-anaphase with chromatids separating. Add a caption reading "S phase is where each chromosome gains its second chromatid".

Cell Cycle with Chromosomes

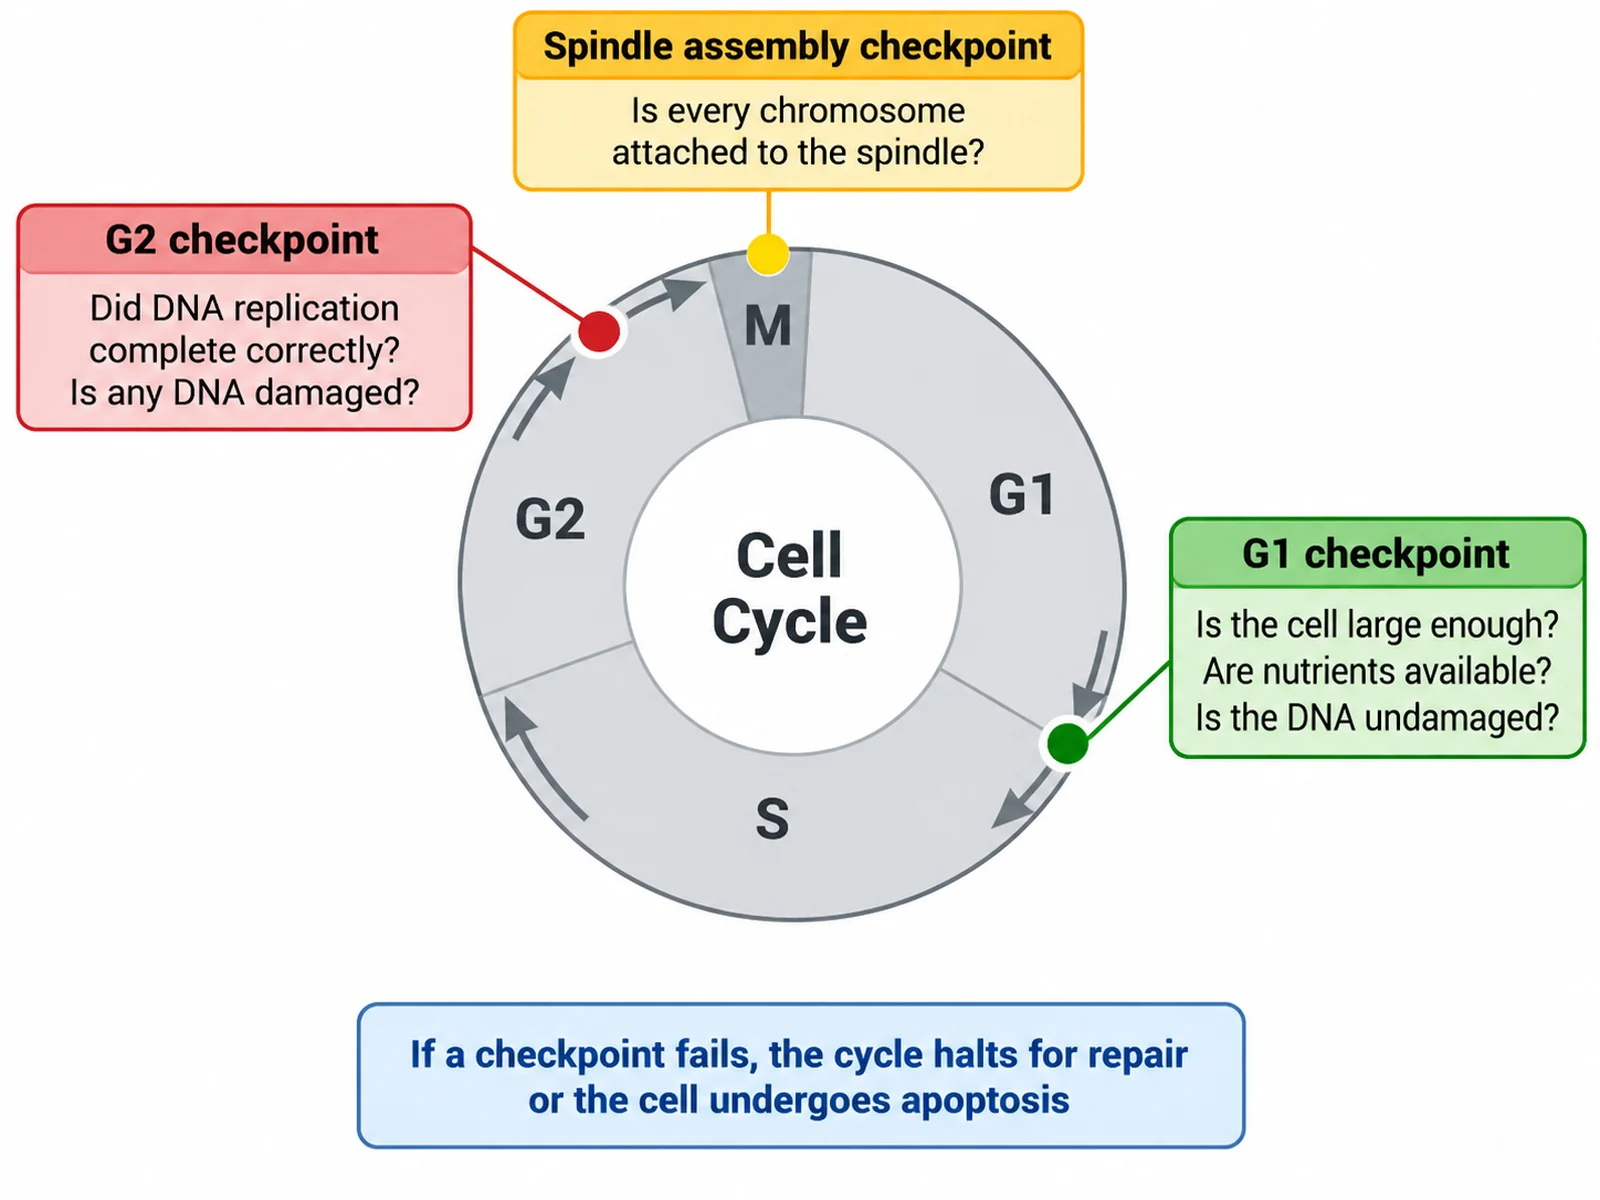
Cell cycle diagram focused on the G1, G2, and spindle assembly checkpoints and what each one tests

Prompt

Create a cell cycle checkpoint diagram on a white background. Draw the four-sector ring in muted grey, then highlight three checkpoint positions with bright markers and callout cards. The G1 checkpoint card reads "Is the cell large enough? Are nutrients available? Is the DNA undamaged?"; the G2 checkpoint card reads "Did DNA replication complete correctly? Is any DNA damaged?"; the spindle assembly checkpoint card reads "Is every chromosome attached to the spindle?". Add a short note under the diagram reading "If a checkpoint fails, the cycle halts for repair or the cell undergoes apoptosis".

Checkpoints and Control

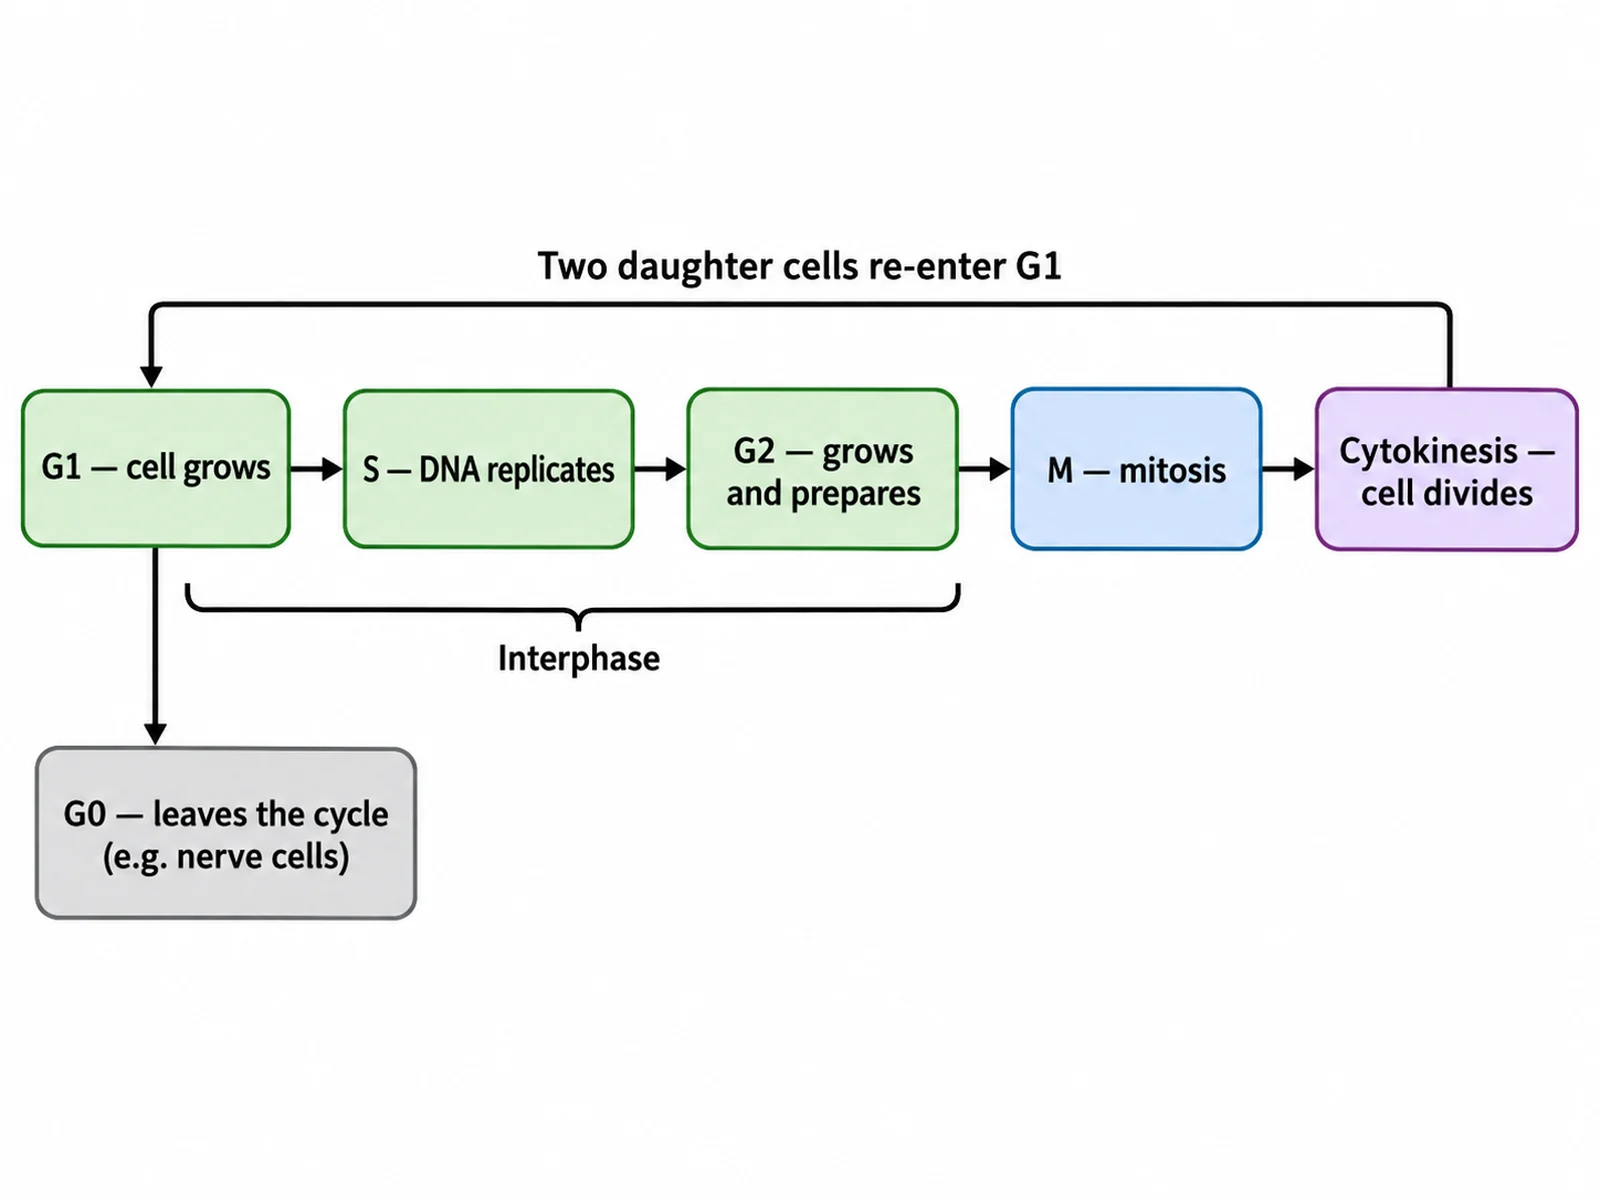
Cell cycle drawn as a linear flow chart of labeled boxes from G1 through M phase and back

Prompt

Create a cell cycle flow chart on a white background. Draw five rounded boxes left to right connected by arrows: "G1 — cell grows", "S — DNA replicates", "G2 — grows and prepares", "M — mitosis", "Cytokinesis — cell divides", with a long return arrow from the last box back to the first labeled "Two daughter cells re-enter G1". Add a downward branch from the G1 box to a grey box labeled "G0 — leaves the cycle (e.g. nerve cells)". Colour the first three boxes with a shared pale tint and bracket them beneath with "Interphase".

Cell Cycle Flow Chart

How to draw a cell cycle diagram

1

Choose the format

A labeled loop for the standard diagram, a pie chart when the point is how long each phase lasts, or a flow chart for revision notes.

2

Generate the diagram

The generator keeps the order G1, S, G2, M, brackets interphase, and places the three checkpoints correctly.

3

Check the order, then export

Confirm the phases run G1, S, G2, M and that M phase is a thin sector, then download the PNG for a worksheet, slide, or revision sheet.

What is a cell cycle diagram?

A cell cycle diagram shows the ordered sequence a cell passes through between one division and the next. It is drawn as a loop because the cycle repeats: two daughter cells each re-enter G1. The diagram carries two ideas at once — the order of the phases, and their very unequal durations, which is why a pie chart version is often clearer than the ring alone.

The phases and what happens in each

  • G1 (first gap): the cell grows, makes proteins and organelles, and carries out its normal function. Longest and most variable phase.
  • S (synthesis): DNA replicates, so every chromosome ends the phase with two identical sister chromatids joined at the centromere.
  • G2 (second gap): further growth, and the cell manufactures the proteins needed for division.
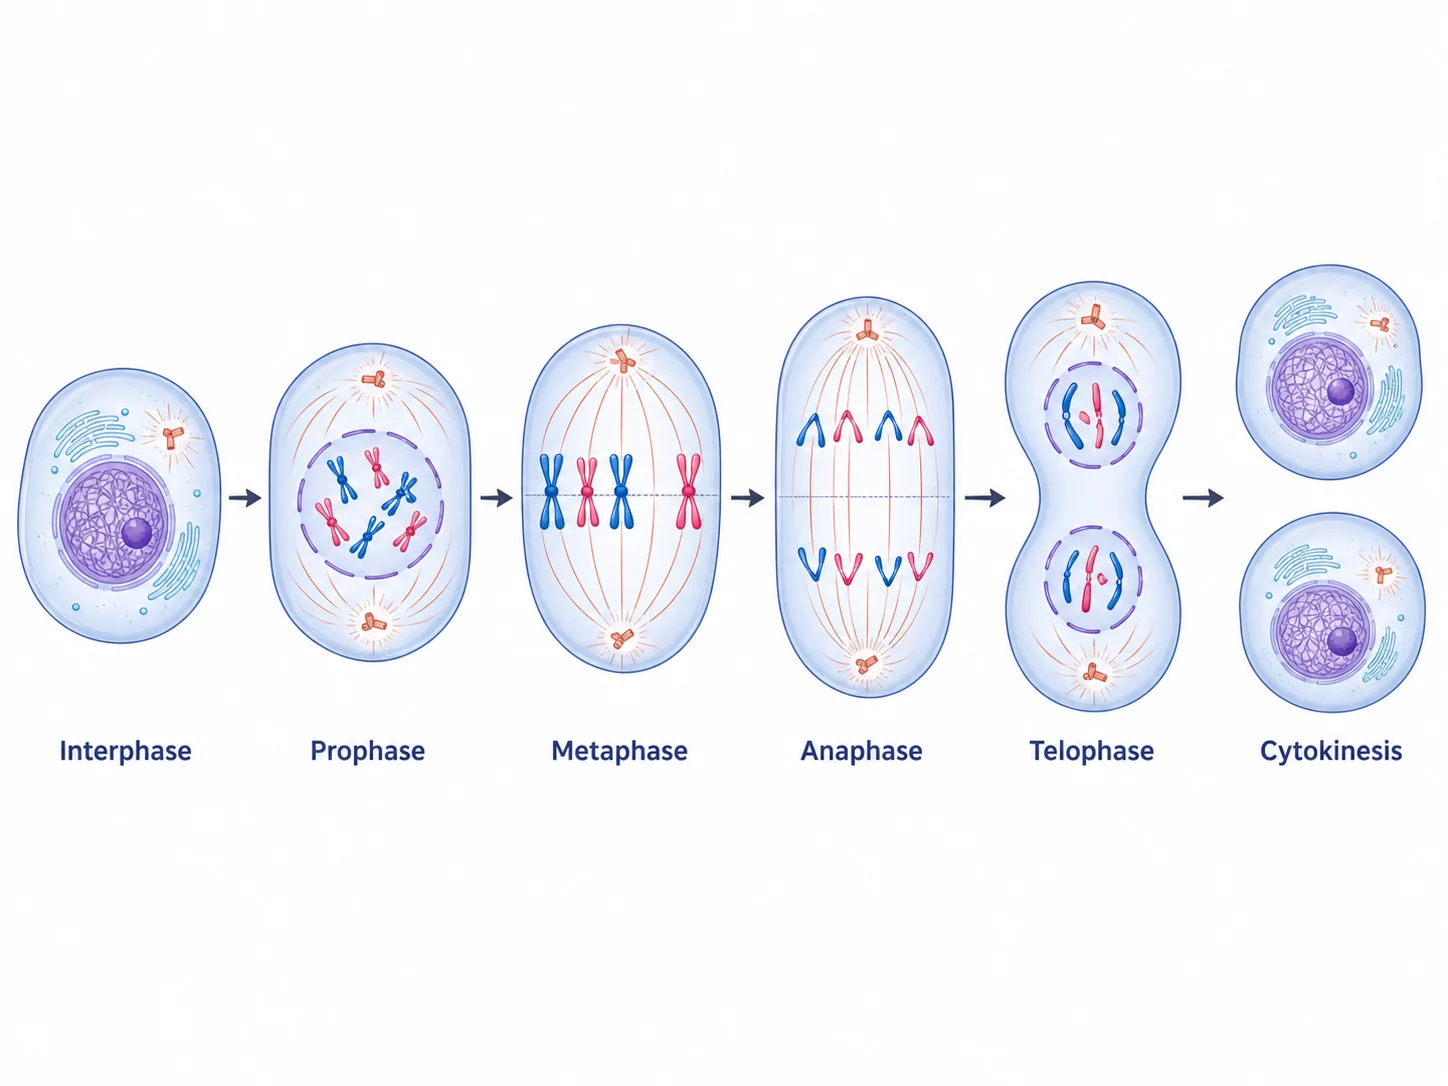
  • M (mitosis and cytokinesis): the nucleus divides through prophase, metaphase, anaphase, and telophase, then the cytoplasm splits.
  • G0 (resting): a branch out of the cycle. Nerve and muscle cells stay here permanently; liver cells can re-enter.

Checkpoints keep the cycle safe

  • G1 checkpoint: tests cell size, nutrient supply, growth signals, and DNA integrity before committing to replication.
  • G2 checkpoint: verifies that replication finished and no DNA damage remains before mitosis starts.
  • Spindle assembly checkpoint: at metaphase, confirms every chromosome is correctly attached before chromatids separate.
  • When checkpoint control fails, cells with damaged DNA keep dividing — the basic mechanism behind tumour formation.

Cell Cycle Diagram Generator FAQ

Interphase is made of G1 (cell growth and normal function), S (DNA replication, so each chromosome gains a second chromatid), and G2 (growth and preparation for division). M phase follows, comprising mitosis — prophase, metaphase, anaphase, telophase — and cytokinesis. Cells that stop dividing leave the cycle into G0.

Need other biology figures?

Generate cell division sequences, cell diagrams, DNA figures, and worksheet-ready illustrations with the same SciFigure AI workflow.