UpSet Plot Generator for Overlapping Sets

See every overlap between four, five, or twenty sets, sized exactly, where a Venn diagram runs out of room.

Upload a membership matrix, element-set pairs, or Venn region counts. SciFigure counts each set and each intersection, sorts them, and draws an UpSet plot with intersection bars, a dot matrix, and set size bars for gene lists, variant callers, peaks, comorbidities, or survey sites.

Three input formatsExclusive or inclusive sizesUp to 20 sets

AI UpSet Plot Generator

Upload set membership data and describe the plot.

Try sample data

Aspect ratio
287 / 2000 characters

Costs 5 credits. Set and intersection sizes are computed from your uploaded data, then drawn as a PNG.

Preview

UpSet Plot Examples

Aspect ratio: 16:9

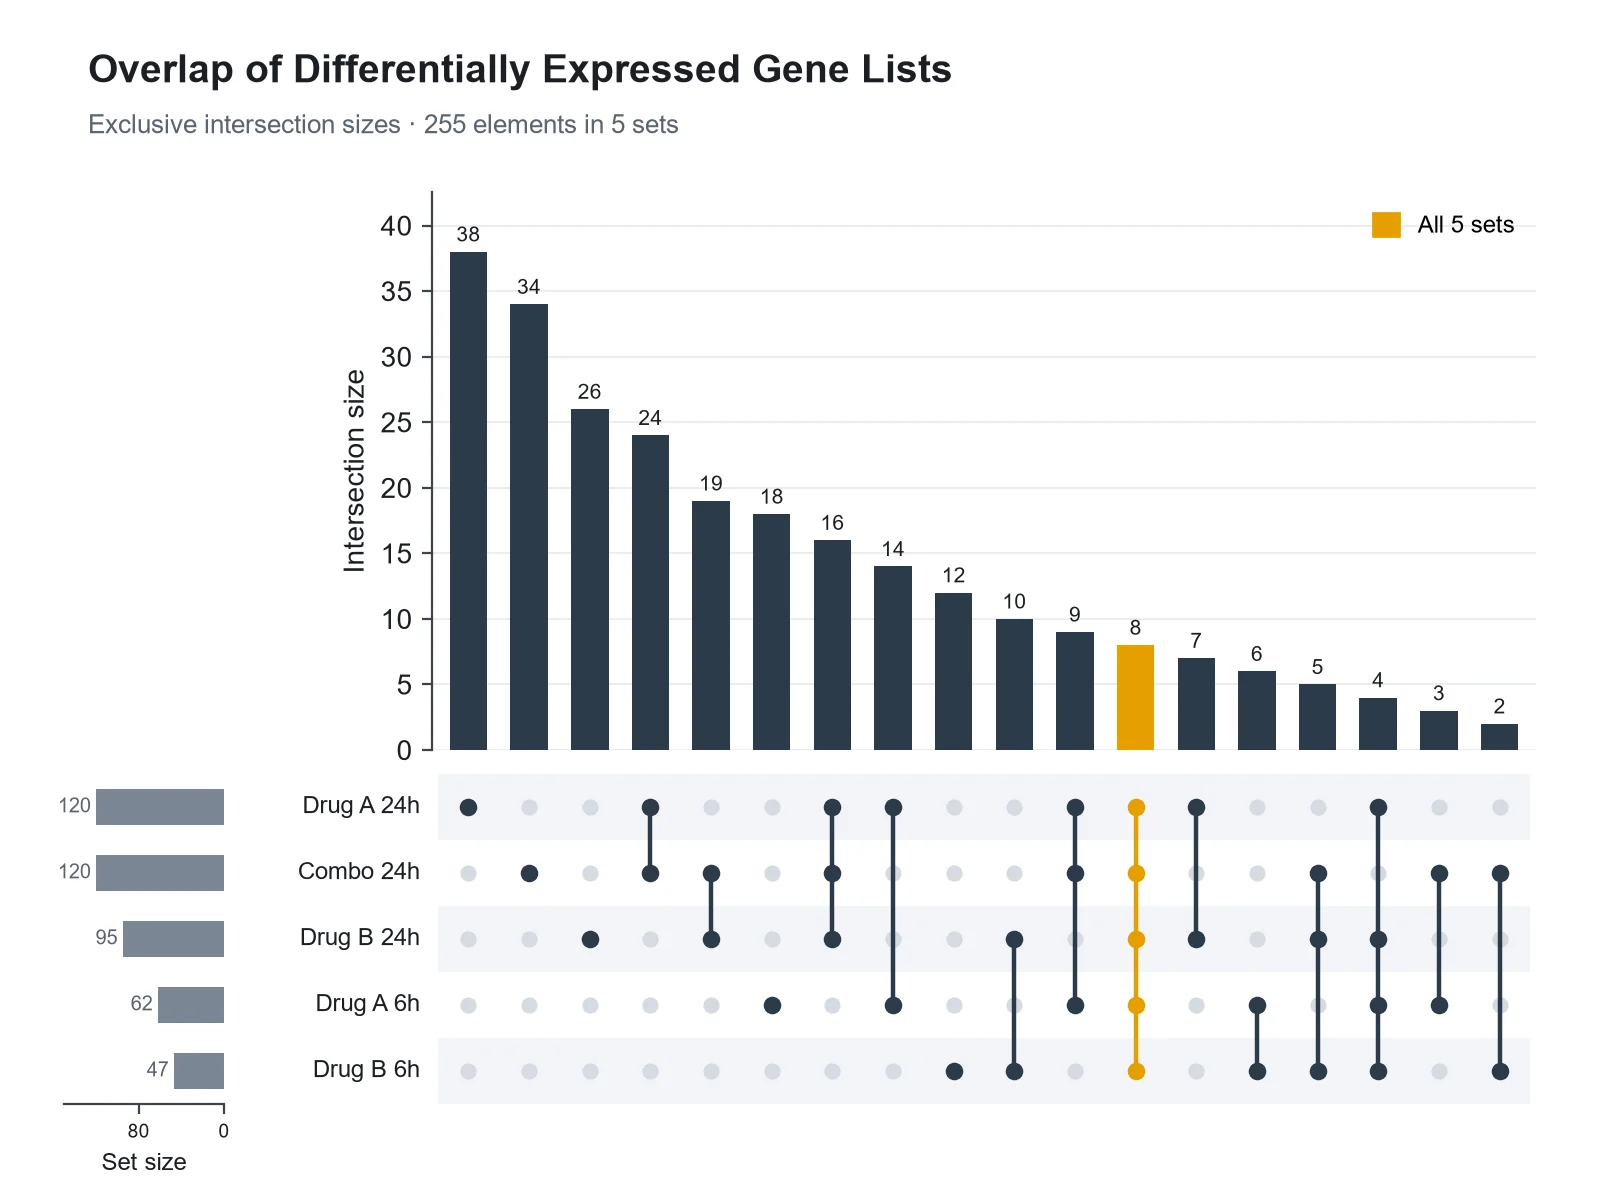
Differentially Expressed Gene Overlap UpSet plot example preview
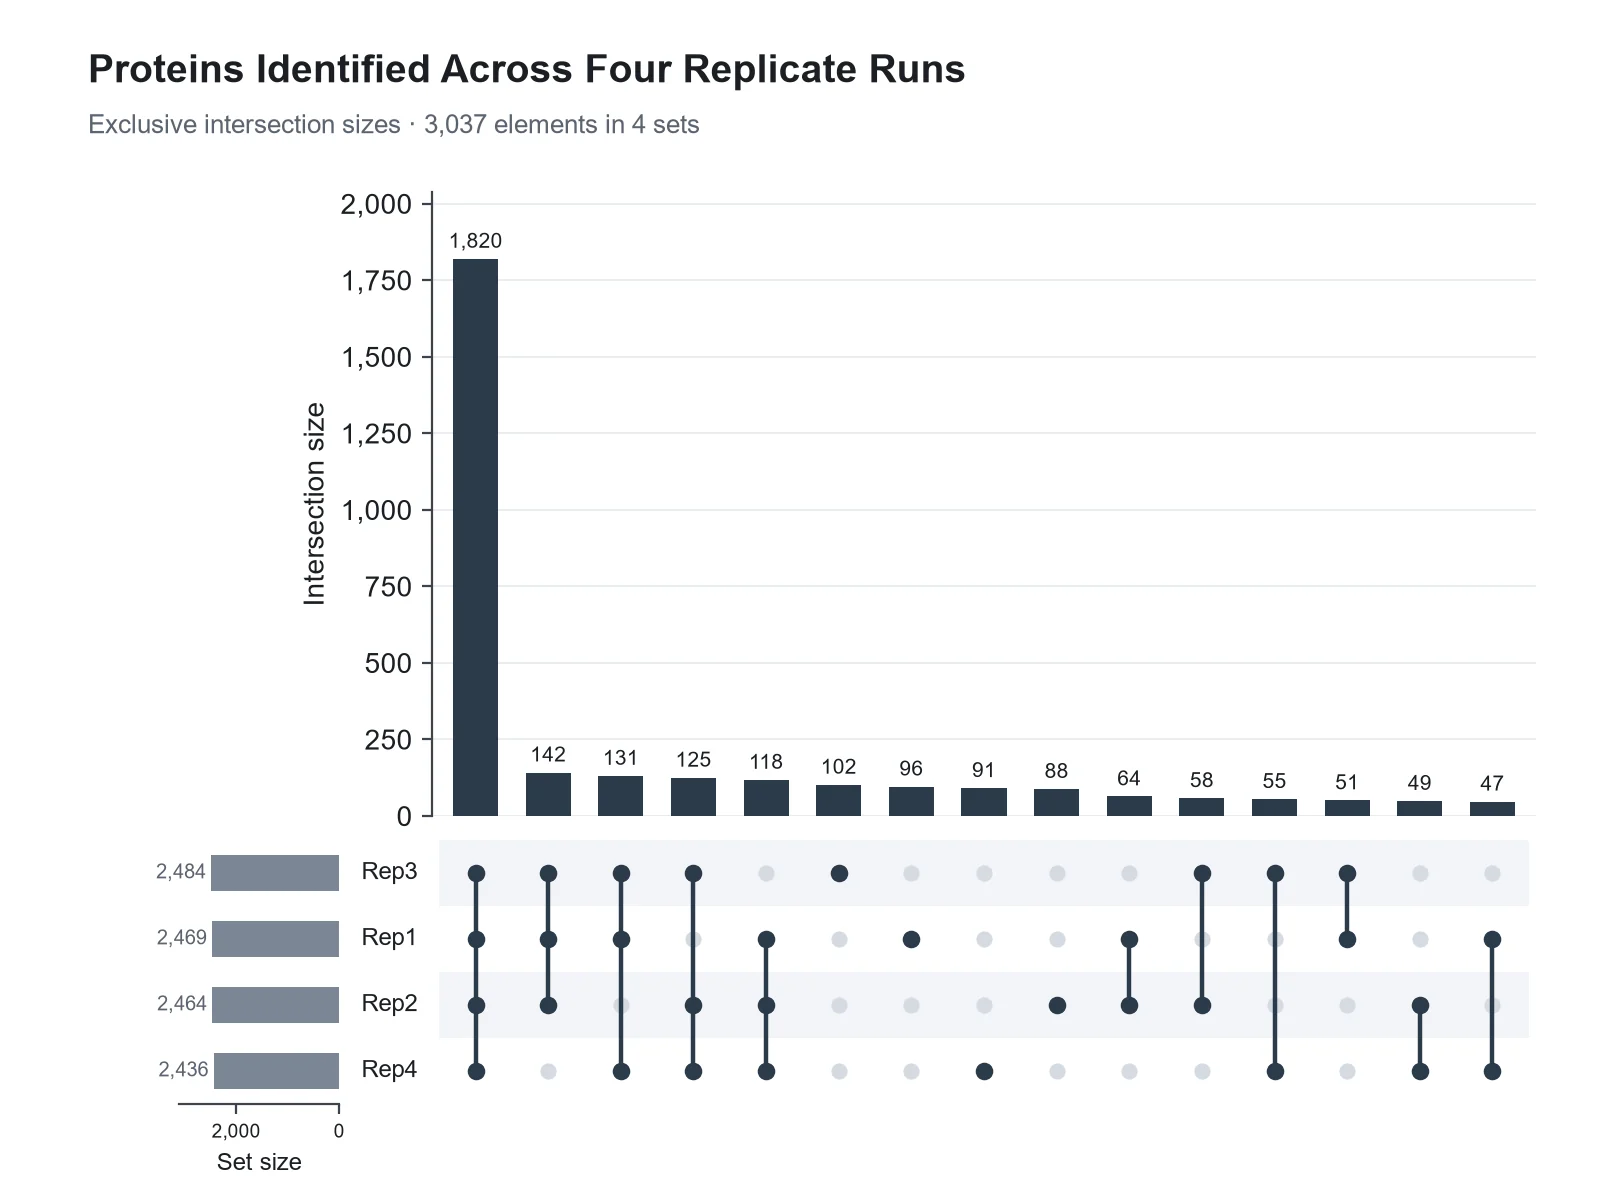
Proteins Identified Across Replicates UpSet plot example preview
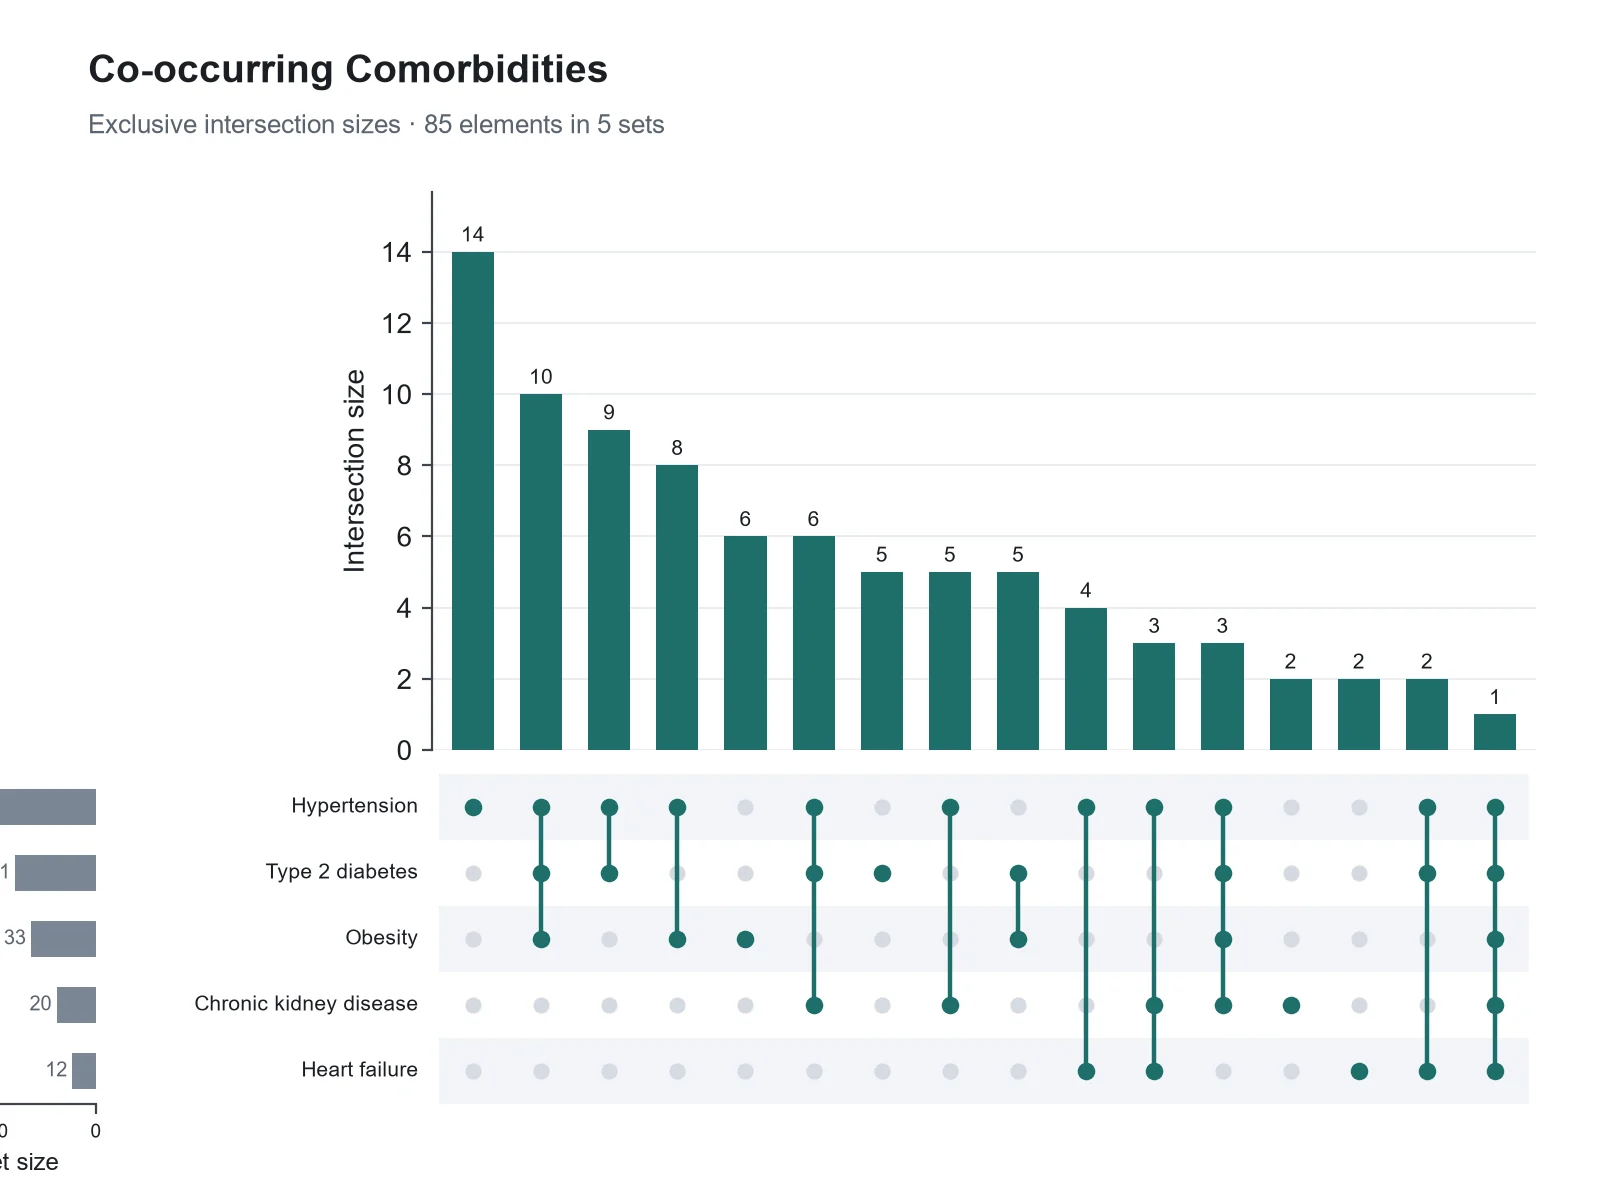
Patient Comorbidity Overlap UpSet plot example preview

These previews were drawn from the sample datasets. Load a sample or upload your own file to generate an UpSet plot.

UpSet plot examples

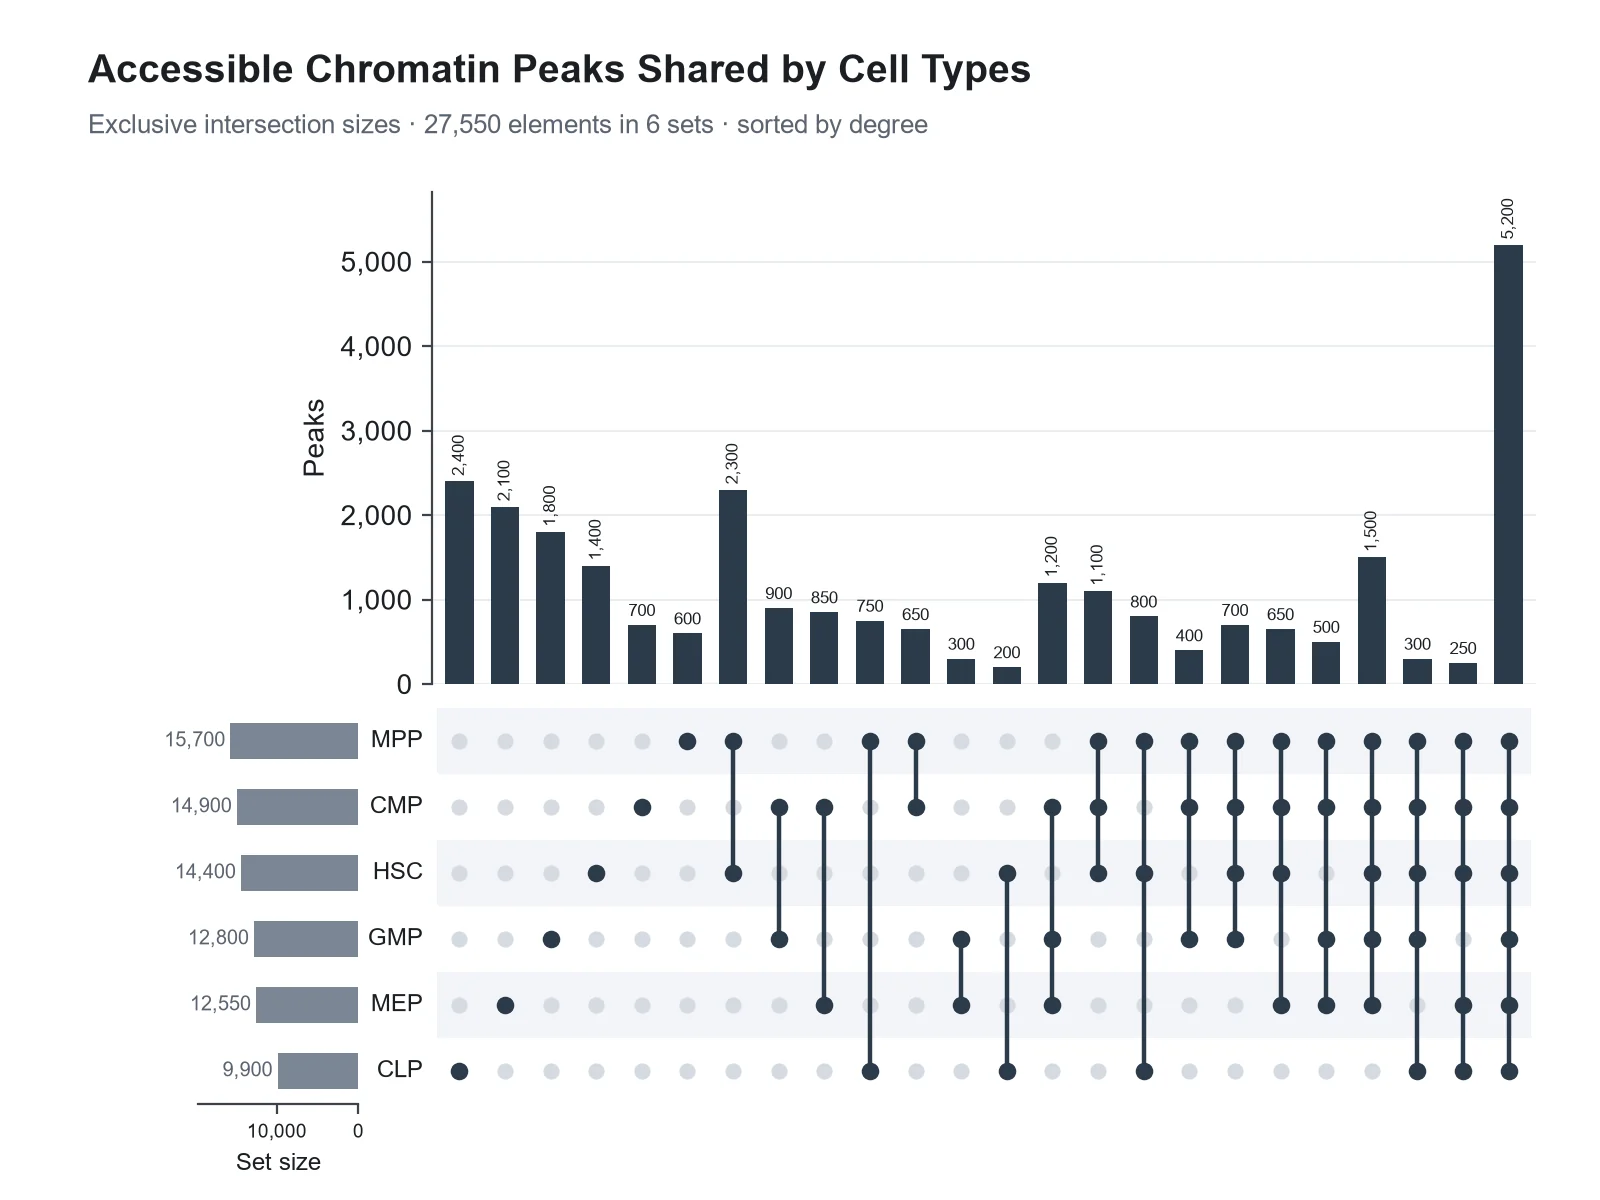
Each example was drawn from a sample dataset: overlapping gene lists, proteins identified across replicate runs, patient comorbidities, chromatin peaks sorted by degree, the same three sets as a Venn diagram and an UpSet plot, and taxa shared across body sites.

UpSet Plot Generator: Differentially Expressed Gene Overlap scientific chart example

Prompt

Based on the uploaded deg_membership.csv file, create an UpSet plot of five differentially expressed gene lists (two drugs at 6 h and 24 h, and the combination at 24 h). Sort intersections by size, print sizes above the bars, show set sizes on the left, and highlight the intersection shared by all five lists.
Differentially Expressed Gene Overlap

UpSet Plot Generator: Proteins Identified Across Replicates scientific chart example

Prompt

Based on the uploaded replicate_overlap_counts.csv file of exclusive intersection counts, create an UpSet plot of proteins identified in four LC-MS/MS replicate runs. Sort by size, print the size above every bar so the small intersections stay readable next to the proteins found in all four runs, and give the total number of proteins in the subtitle.

Proteins Identified Across Replicates

UpSet Plot Generator: Patient Comorbidity Overlap scientific chart example

Prompt

Based on the uploaded comorbidities_long.csv file (one row per patient and condition), create an UpSet plot of five comorbidities, intersections sorted by size, set sizes on the left, and dots colored dark teal.

Patient Comorbidity Overlap

UpSet Plot Generator: Chromatin Peaks Sorted by Degree scientific chart example

Prompt

Based on the uploaded atac_peak_overlap.csv file, create an UpSet plot of accessible chromatin peaks shared by six hematopoietic cell types. Sort intersections by degree (single cell types first), show the top 25 intersections, and shade the matrix background in alternating rows.

Chromatin Peaks Sorted by Degree

UpSet Plot Generator: Venn Diagram vs UpSet Plot scientific chart example

Prompt

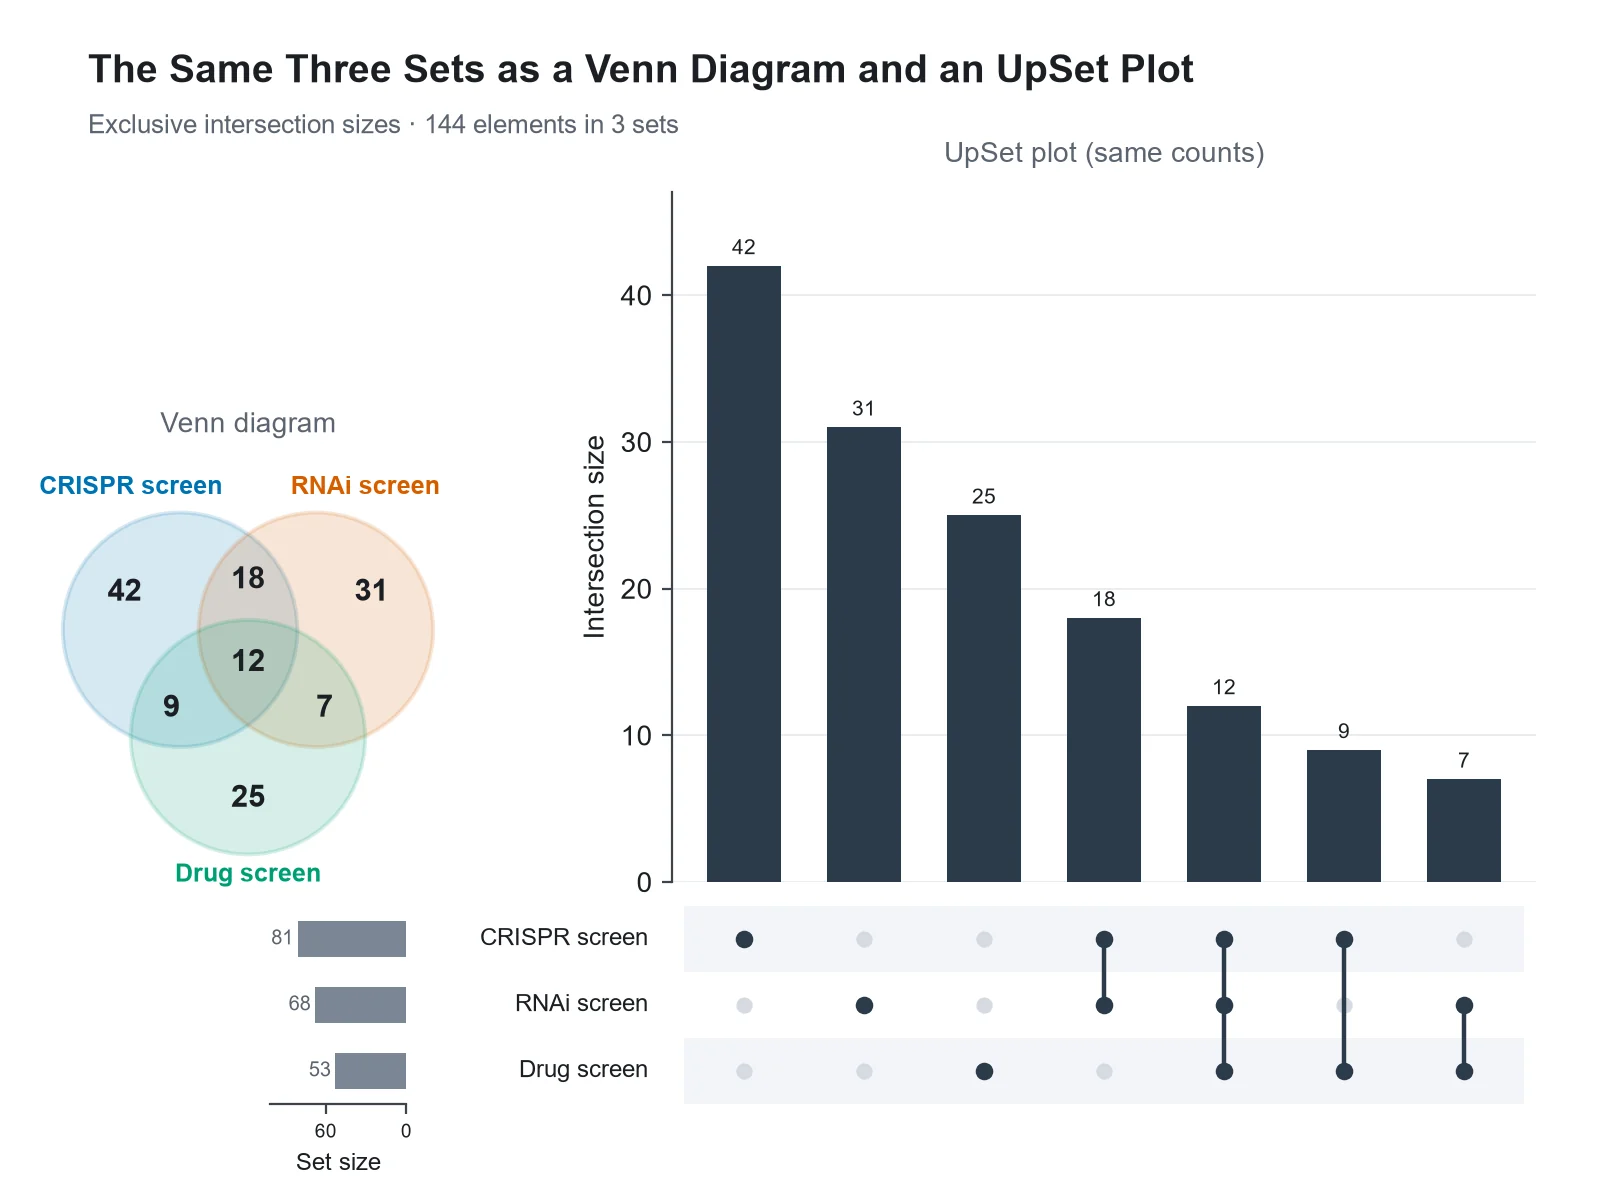
Based on the uploaded three_set_counts.csv file, create an UpSet plot of the three sets with a matching three-circle Venn diagram on the left, using the same exclusive region counts in both, so readers can see that each Venn region is one UpSet column.

Venn Diagram vs UpSet Plot

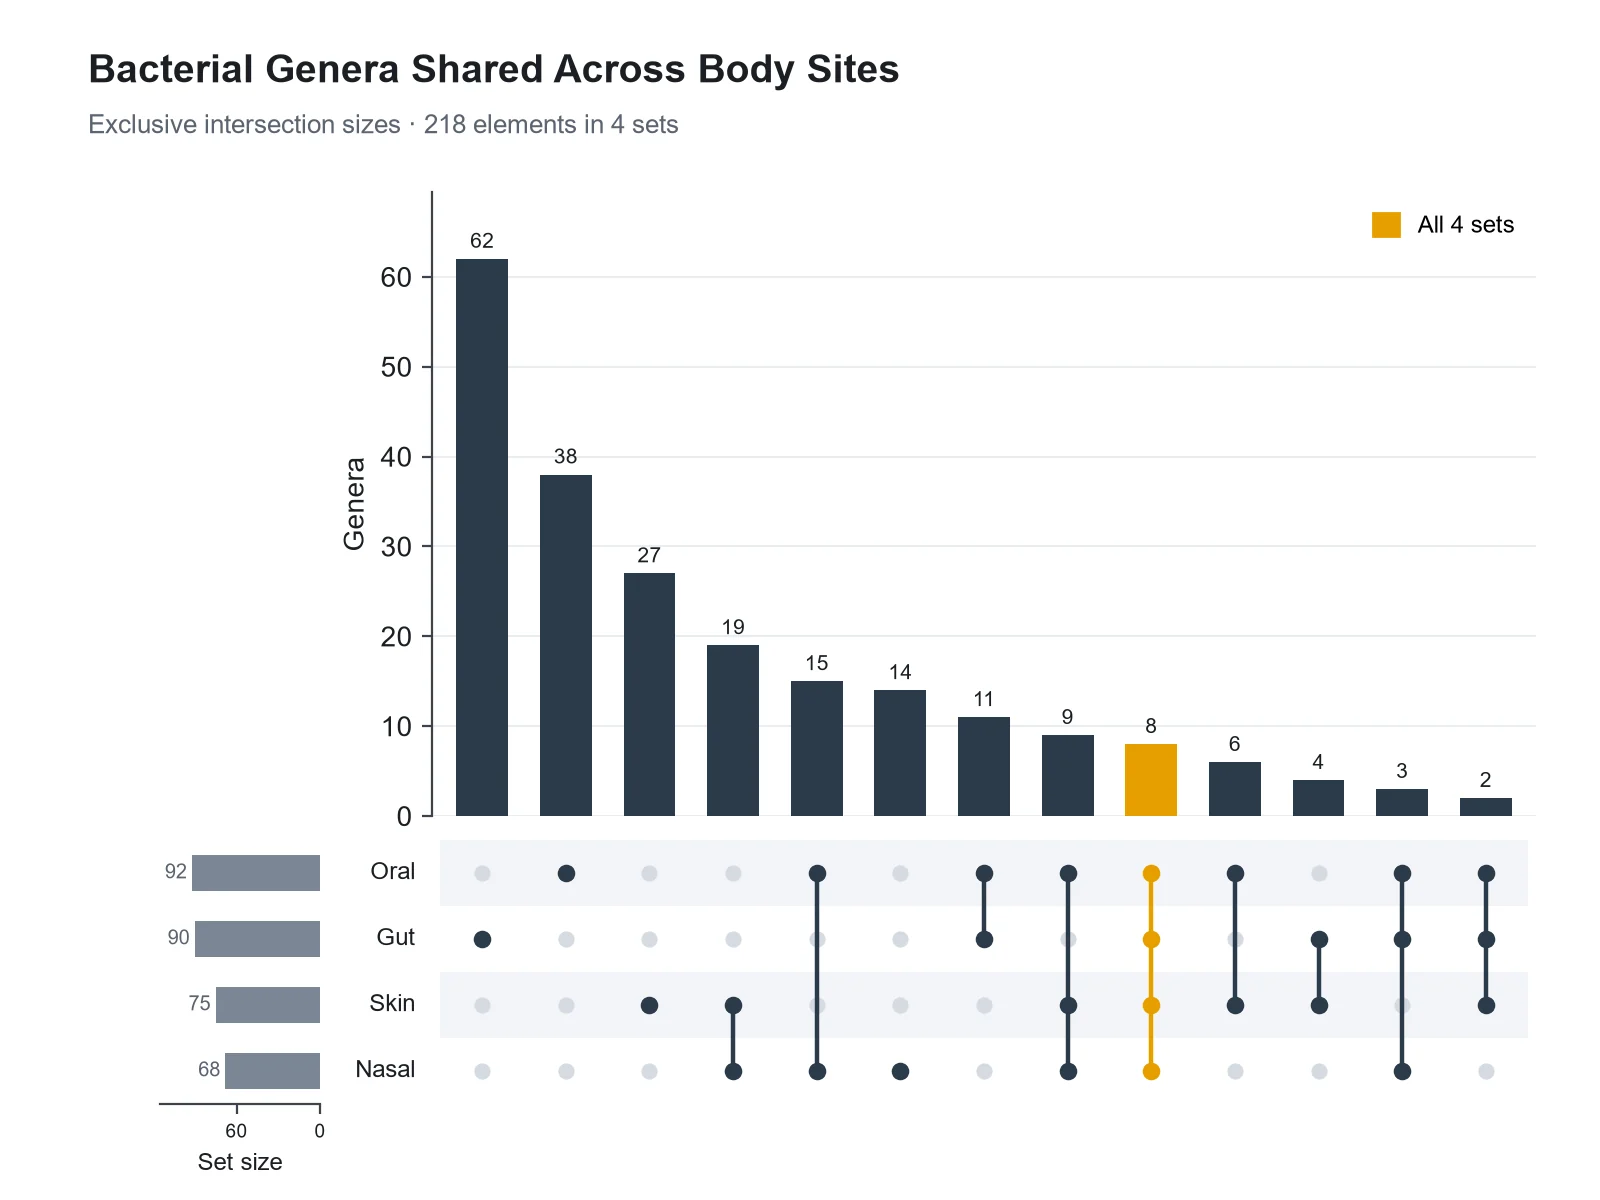
UpSet Plot Generator: Core Taxa Across Body Sites scientific chart example

Prompt

Based on the uploaded taxa_by_site.csv file, create an UpSet plot of bacterial genera detected at four body sites, intersections sorted by size, and the intersection of all four sites (the core taxa) highlighted in orange.

Core Taxa Across Body Sites

How to make an UpSet plot

1

Upload your sets

Add a CSV, TSV, or Excel file as 0/1 membership columns (one row per element), as element and set pairs, or as intersection names such as "A&B" with counts.

2

Describe the figure

Choose sorting (by size or degree), how many intersections to show, exclusive or inclusive sizes, highlights, and colors.

3

Generate, review & download

SciFigure counts every set and intersection, draws the UpSet plot, and lets you download a PNG for papers, posters, and slides.

UpSet plot key facts

Possible intersections
2ⁿ − 1 for n sets: 15 for 4 sets, 31 for 5, 63 for 6
Default bar height
Exclusive (distinct) count, as in a Venn region
Matrix
Rows are sets, columns are intersections
Introduced
Lex, Gehlenborg et al., IEEE TVCG, 2014
Sets in this generator
Up to 20
Intersections drawn
30 by default, up to 60

What is an UpSet plot?

An UpSet plot shows how several sets overlap. Instead of overlapping circles, it lists each intersection as a column: a dot matrix underneath marks which sets the intersection contains, and a bar on top shows how many elements fall into it. Horizontal bars beside the matrix give the size of each set. Because every intersection gets its own column, an UpSet plot stays readable for five, ten, or more sets, where a Venn diagram has to draw 31 regions for five sets and 63 for six. Alexander Lex, Nils Gehlenborg and colleagues introduced the technique in 2014, and it is now standard for comparing gene lists, variant callers, peak sets, database contents, and patient conditions.

How to read an UpSet plot

  • Each column is one intersection. The filled dots in that column, joined by a vertical line, are the sets it includes; gray dots are sets it excludes.
  • The bar above the column is the intersection size. By default it counts elements in exactly those sets and no others, the same number a Venn diagram prints in the matching region.
  • A column with a single dot holds the elements unique to that set.
  • The horizontal bars on the left are the set sizes: all elements in a set, summed over every intersection that contains it.
  • Columns are usually sorted by size, so the largest overlaps come first. Sorting by degree groups single sets, pairs, triples, and so on.
  • Intersections with no elements are not drawn, so the plot only shows the overlaps that exist.

UpSet plot vs Venn diagram

A Venn diagram is the most intuitive picture for two or three sets: the regions map directly onto the overlaps, and readers need no explanation. With four sets the circles must become ellipses to show all 15 regions, and with five or more the regions get too small to label or compare. An UpSet plot shows the same numbers as bars that share one baseline, so sizes are easy to compare and to sort, and any number of sets fits. A good rule: use a Venn diagram for up to three sets, and an UpSet plot from four sets on, or whenever the exact sizes matter. If you already have Venn region counts, enter them as intersection names with counts and the generator turns them into an UpSet plot.

Exclusive and inclusive intersection sizes

  • Exclusive (distinct) size: elements in exactly these sets and in none of the others. This is the default here, in UpSetR, and in the ComplexHeatmap "distinct" mode, and it matches Venn diagram regions. Exclusive sizes add up to the total number of elements.
  • Inclusive size: elements in at least these sets, whatever else they belong to (the ComplexHeatmap "intersect" mode). The inclusive size of A and B counts everything in both A and B, including elements also in C.
  • Inclusive sizes overlap, so they do not add up to the total, and the bar for a single set equals its set size.
  • Write "inclusive intersections" in your instructions to switch modes. The generator computes both and states which one is drawn.

What does this UpSet plot generator calculate?

The generator reads your file in one of three formats, removes duplicate element-set pairs, and builds the membership of every element. It counts each set, every observed combination of sets, and both the exclusive and inclusive size of each intersection. It then sorts the intersections (by size by default, or by degree or set order), keeps the top 30 (up to 60 on request, or only those above a minimum size), and reports how many intersections and elements were left out, so the plot never hides data silently. In membership-matrix files it also counts elements that belong to no set. The image model draws exactly these numbers. It does not test whether an overlap is larger than expected by chance and adds no p-values.

Three ways to format UpSet plot data

  • Membership matrix: one row per element, an optional ID column, and one column per set holding 1/0, TRUE/FALSE, or yes/no. Every such column is treated as a set. This is the format of UpSetR data frames and of from_indicators in the Python UpSetPlot package.
  • Element and set pairs (long format): one row per element and set, for example "PT001, Hypertension" and "PT001, Type 2 diabetes". Map the element column and the set column. This matches gene lists stacked into one table, like UpSetR’s fromList or UpSetPlot’s from_contents.
  • Intersection counts: one row per intersection with names such as "A&B&C" (also "A ∩ B", "A|B", "A;B") and an exclusive count. Map the intersection column and the count column. This is UpSetR’s fromExpression format, and the format to use for Venn region counts.
  • Up to 20 sets and 1,200 rows are read. Sets beyond 20 are listed in a warning.

Where UpSet plots are used

  • Differentially expressed genes shared across treatments, time points, or tissues, typically from DESeq2, edgeR, or limma results.
  • Variants or peaks called by several tools or found in several samples.
  • Proteins or metabolites identified across replicate runs or extraction methods.
  • Comorbidities, symptoms, or adverse events that co-occur in the same patients.
  • Species or taxa shared across sites, seasons, or hosts.

UpSet plot vs Venn diagram

Both show the same overlaps. They differ in how many sets stay readable and how precisely sizes can be compared.

UpSet plotVenn diagram
Sets that stay readableDozens2 or 3; 4 with ellipses
How an intersection is shownA column in a dot matrixAn overlapping region
How size is shownBar height on a shared axisA number in a region (area is not proportional)
SortingBy size, degree, or set orderFixed by the layout
Empty intersectionsLeft outStill drawn as regions
Best forFour or more sets, exact comparisonsTwo or three sets, quick intuition, teaching

Common UpSet plot mistakes

Most wrong UpSet plots come from the input, not the drawing.

  1. MistakeMixing exclusive and inclusive counts, or not saying which one is shown.

    CorrectState the mode in the caption. Exclusive sizes match Venn regions and sum to the total; inclusive sizes overlap.

  2. MistakeTyping set sizes into the intersection counts table.

    CorrectEnter only exclusive region counts (each element counted once); set sizes are calculated from them.

  3. MistakeCounting a gene twice because it appears twice in one list.

    CorrectDeduplicate IDs within each set. This generator drops repeated element-set pairs and reports how many it found.

  4. MistakePlotting only the five largest sets without noticing.

    CorrectUpSetR draws 5 sets by default (nsets = 5). Check that every set you meant to compare is in the matrix.

  5. MistakeReading a tall intersection bar as a significant overlap.

    CorrectLarge sets overlap a lot by chance. Test enrichment separately against a stated universe, for example with a hypergeometric test.

  6. MistakeHiding small intersections without saying so.

    CorrectReport how many intersections and elements were left out, as this generator does.

UpSet Plot Generator FAQ

What is an UpSet plot?

An UpSet plot is a chart of set intersections. A dot matrix shows which sets each intersection contains, bars above show the intersection sizes, and bars beside the matrix show the set sizes. It replaces a Venn diagram when there are more than three or four sets.

When should I use an UpSet plot instead of a Venn diagram?

Use a Venn diagram for two or three sets, when intuition matters more than precise sizes. Use an UpSet plot from four sets on, or whenever you need to compare or rank the intersection sizes, because bars on a shared axis are easier to compare than numbers in regions.

How do I read the dots and bars in an UpSet plot?

Read one column at a time. The filled, connected dots tell you which sets the intersection includes, and the bar above tells you how many elements are in exactly that combination. The horizontal bars on the side are the total size of each set.

What is the difference between exclusive and inclusive intersections?

An exclusive intersection counts elements in exactly those sets and no others; it equals the Venn diagram region and all exclusive sizes add up to the total. An inclusive intersection counts elements in at least those sets, so it can include elements of other sets too. This generator draws exclusive sizes unless you ask for inclusive ones.

Can I turn Venn diagram counts into an UpSet plot?

Yes. Make one row per Venn region with a name like "A&B" and its count, map those two columns, and generate. Region counts are exclusive counts, so the bars match the Venn diagram exactly and the set sizes are added up for you.

What input format does the UpSet plot generator accept?

Three formats: a 0/1 membership matrix with one row per element, a long table with one row per element and set, or intersection names with counts. CSV, TSV, TXT, and Excel files up to 1,200 rows work.

How many sets can an UpSet plot show?

This generator reads up to 20 sets and draws the 30 largest intersections by default (up to 60 on request). With many sets, ask for a minimum intersection size or the top 20 intersections to keep the plot focused.

Why don’t the intersection bars add up to my set size?

A set size is the sum of every intersection that contains that set, not only the single-set column. With exclusive sizes, all intersection bars together add up to the number of elements in at least one set.

Does the generator test whether an overlap is significant?

No. It counts and draws intersections exactly but does not run enrichment tests or add p-values. Whether an overlap is larger than chance depends on the set sizes and the universe of possible elements, so test that separately.

What are UpSetR and UpSetPlot?

UpSetR is the R package for UpSet plots (Conway, Lex and Gehlenborg, 2017); ComplexHeatmap and ComplexUpset are other R options. UpSetPlot is the Python package, with from_indicators, from_memberships, and from_contents helpers for the three data formats. This generator accepts the same formats without code.

Can I highlight one intersection or color the sets?

Yes. Describe it, for example "highlight the intersection of all five sets in orange" or "color each set bar by set". Highlights only change colors; the sizes stay as computed.

Ready to compare your sets?

Generate UpSet plots, volcano plots, heatmaps, and other research figures from your own data with SciFigure AI.