Generate a biogeochemical cycles diagram that shows how water, carbon, nitrogen, and phosphorus move between the air, the oceans, the rocks and soil, and living things — four labeled cycles side by side, or one cycle on its own. Draw a simple phosphorus cycle diagram from rock to soil to plants and back through the ocean floor, with no gas phase, an easy drawing for younger classes, or a blank worksheet with its matching answer key.
Water, carbon, nitrogen, phosphorusPhosphorus with no gas phaseLabeled, easy, or blank
Checked against OpenStax Biology 2e
Phosphorus with no gas phase
Labeled, numbered, or blank
Print-ready PNG
AI Biogeochemical Cycles Diagram Generator
Describe the cycle or cycles, the processes to label, and the level you need, or ask for a blank worksheet.
740 / 2000 characters
Generate a publication-ready PNG from your description.
Preview
Biogeochemical Cycles Diagram Example Previews
Target aspect ratio: 4:3
Sample previews. Describe your diagram to generate your own biogeochemical cycles figure.
Biogeochemical Cycles Diagram Examples
Use these as visual directions for the four main cycles side by side, a labeled phosphorus cycle, a simple phosphorus cycle to copy, an easy drawing of all the cycles in one scene, phosphorus runoff and dead zones, and a blank worksheet.
Prompt
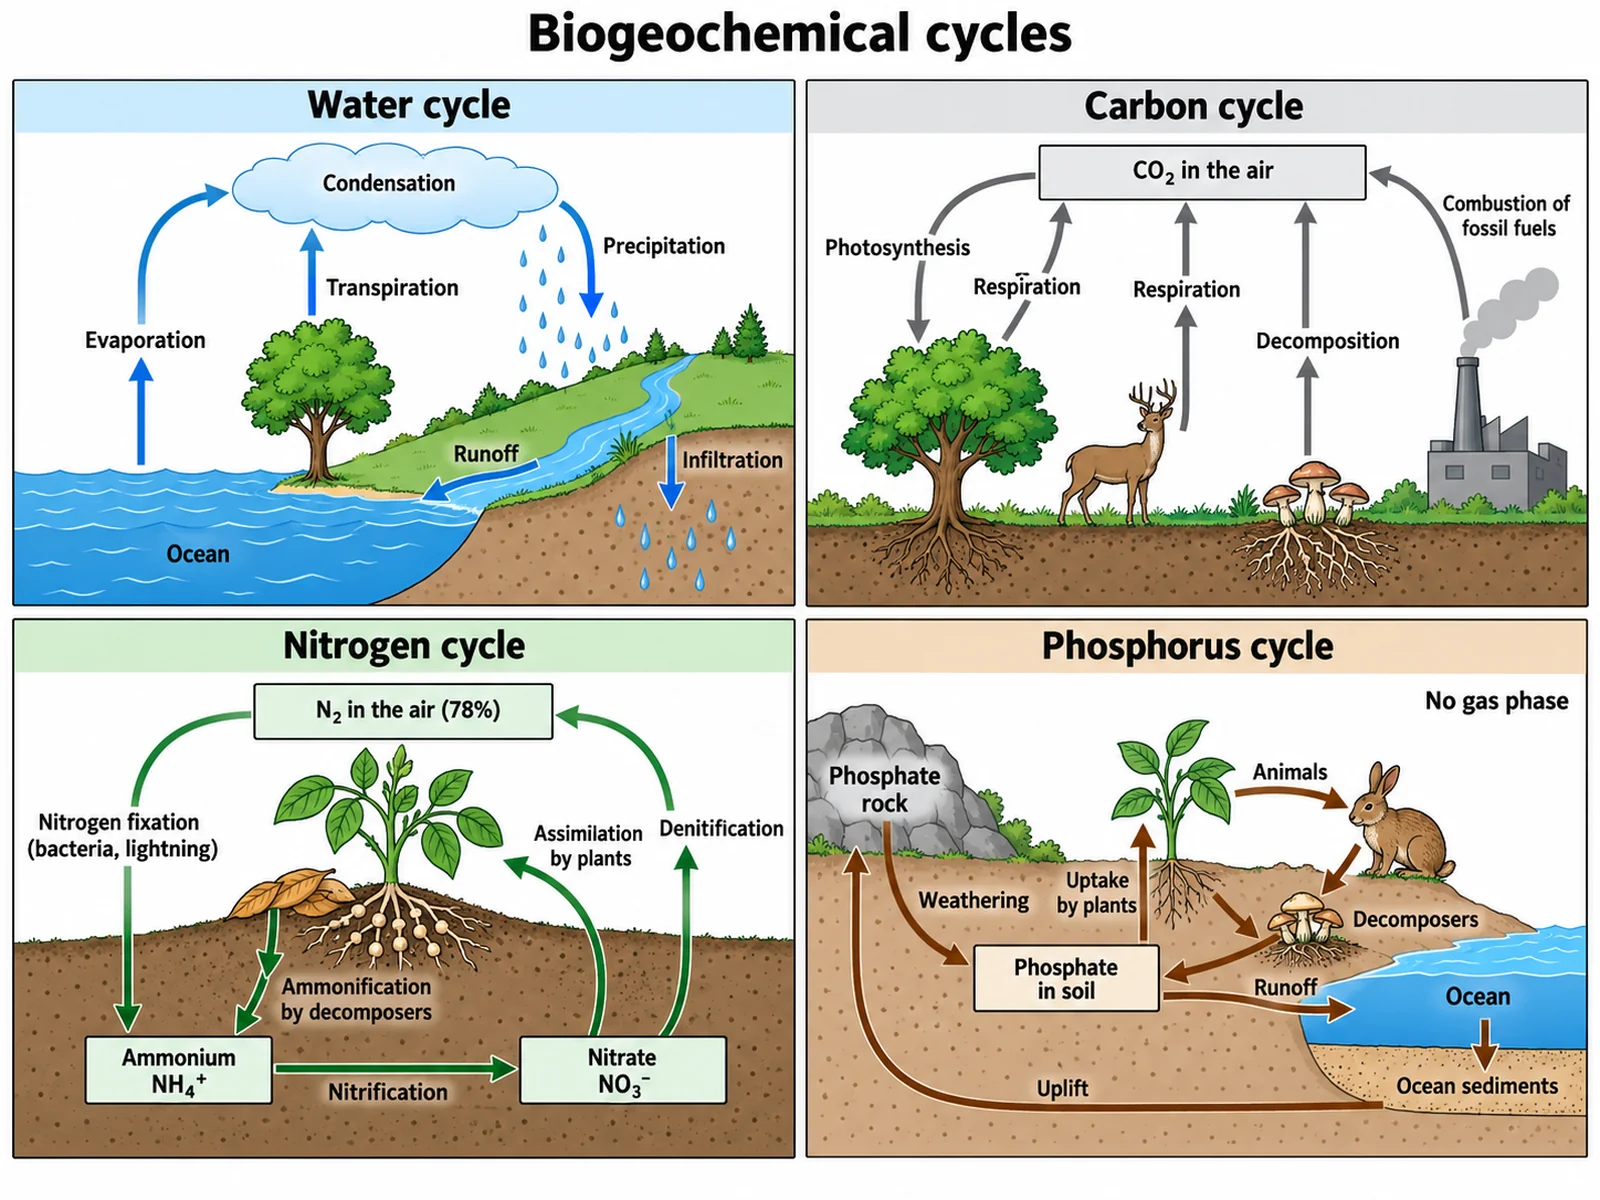
Create a labeled biogeochemical cycles diagram on a white background in clean science textbook style, titled "Biogeochemical cycles", with four panels in a two-by-two grid, each with its own colour. Top left "Water cycle" (blue): ocean, cloud, rain, tree, river; arrows "Evaporation", "Transpiration", "Condensation", "Precipitation", "Runoff", "Infiltration". Top right "Carbon cycle" (grey): "CO2 in the air", a tree, an animal, a factory; arrows "Photosynthesis" from air to tree, "Respiration" from tree and from animal to air, "Decomposition", "Combustion of fossil fuels". Bottom left "Nitrogen cycle" (green): "N2 in the air (78%)"; arrows "Nitrogen fixation (bacteria, lightning)", "Ammonium NH4+", "Nitrification", "Nitrate NO3-", "Assimilation by plants", "Ammonification by decomposers", "Denitrification" from nitrate back to N2. Bottom right "Phosphorus cycle" (brown): "Phosphate rock", "Weathering", "Phosphate in soil", "Uptake by plants", "Animals", "Decomposers", "Runoff", "Ocean sediments", "Uplift"; caption "No gas phase".
Use this example
Prompt
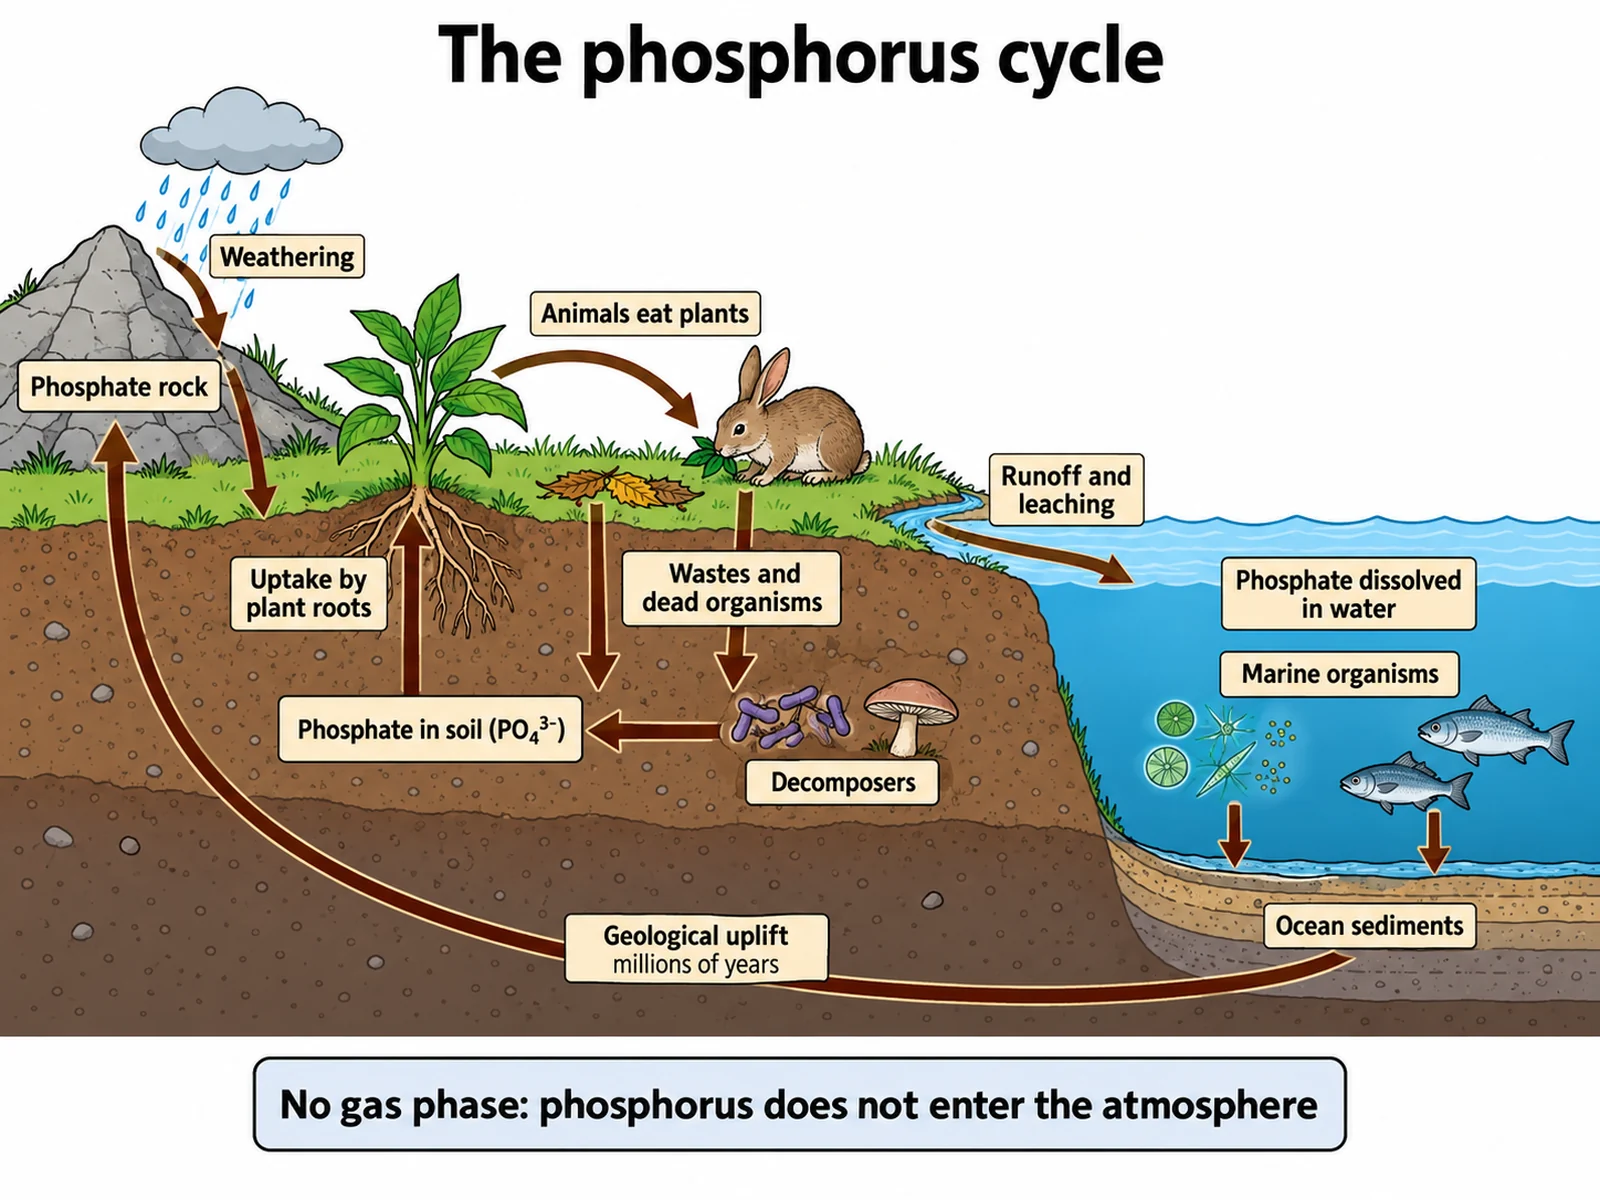
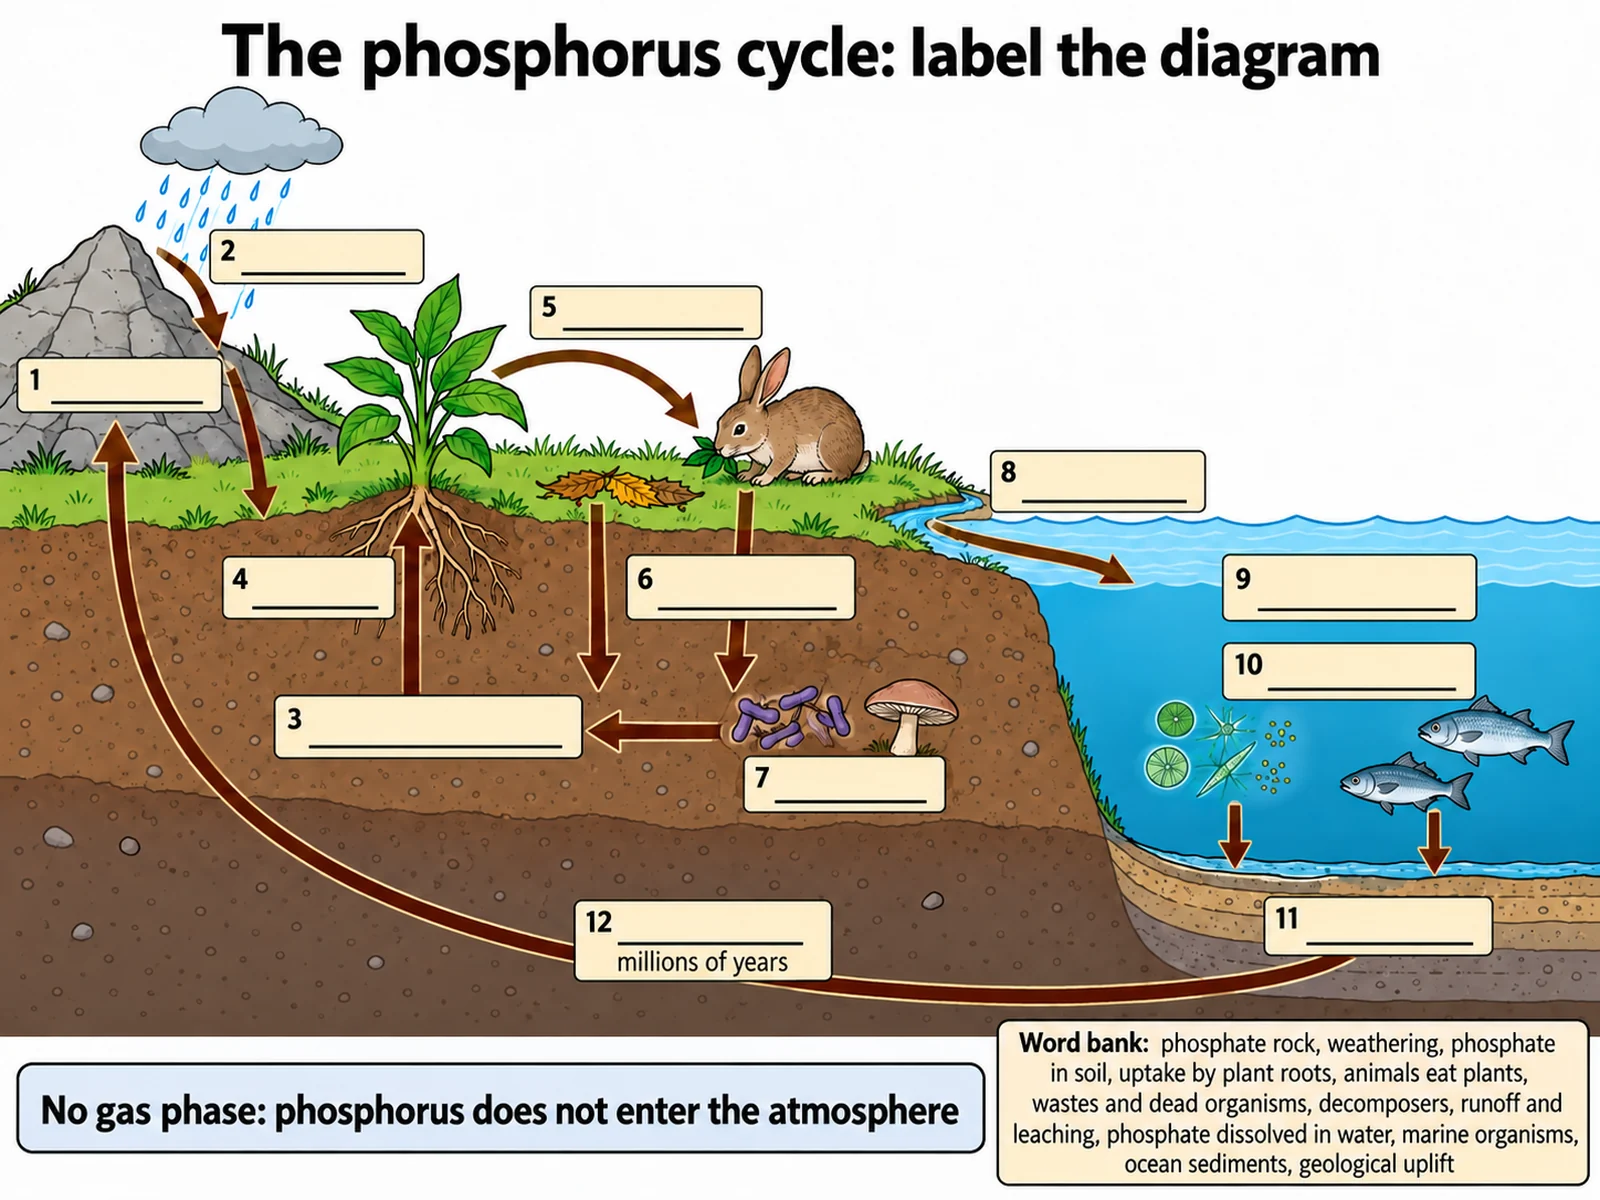
Create a labeled phosphorus cycle diagram as a landscape cross-section on a white background, land on the left and ocean on the right, with an empty sky. Label exactly these twelve parts with arrows running from source to destination: "Phosphate rock" on a rocky hill at the left; "Weathering" on rain hitting the rock; "Phosphate in soil (PO4 3-)" in the soil below; "Uptake by plant roots" from soil into a plant; "Animals eat plants" from the plant to a grazing animal; "Wastes and dead organisms" from the plant and animal down to the soil; "Decomposers" (bacteria and fungi) in the soil, returning phosphate to the soil; "Runoff and leaching" down a river into the sea; "Phosphate dissolved in water" in the sea; "Marine organisms" (plankton and fish); "Ocean sediments" on the sea floor; "Geological uplift" from the sediments back up to the rock on land. Caption: "No gas phase: phosphorus does not enter the atmosphere".
Use this example
Prompt
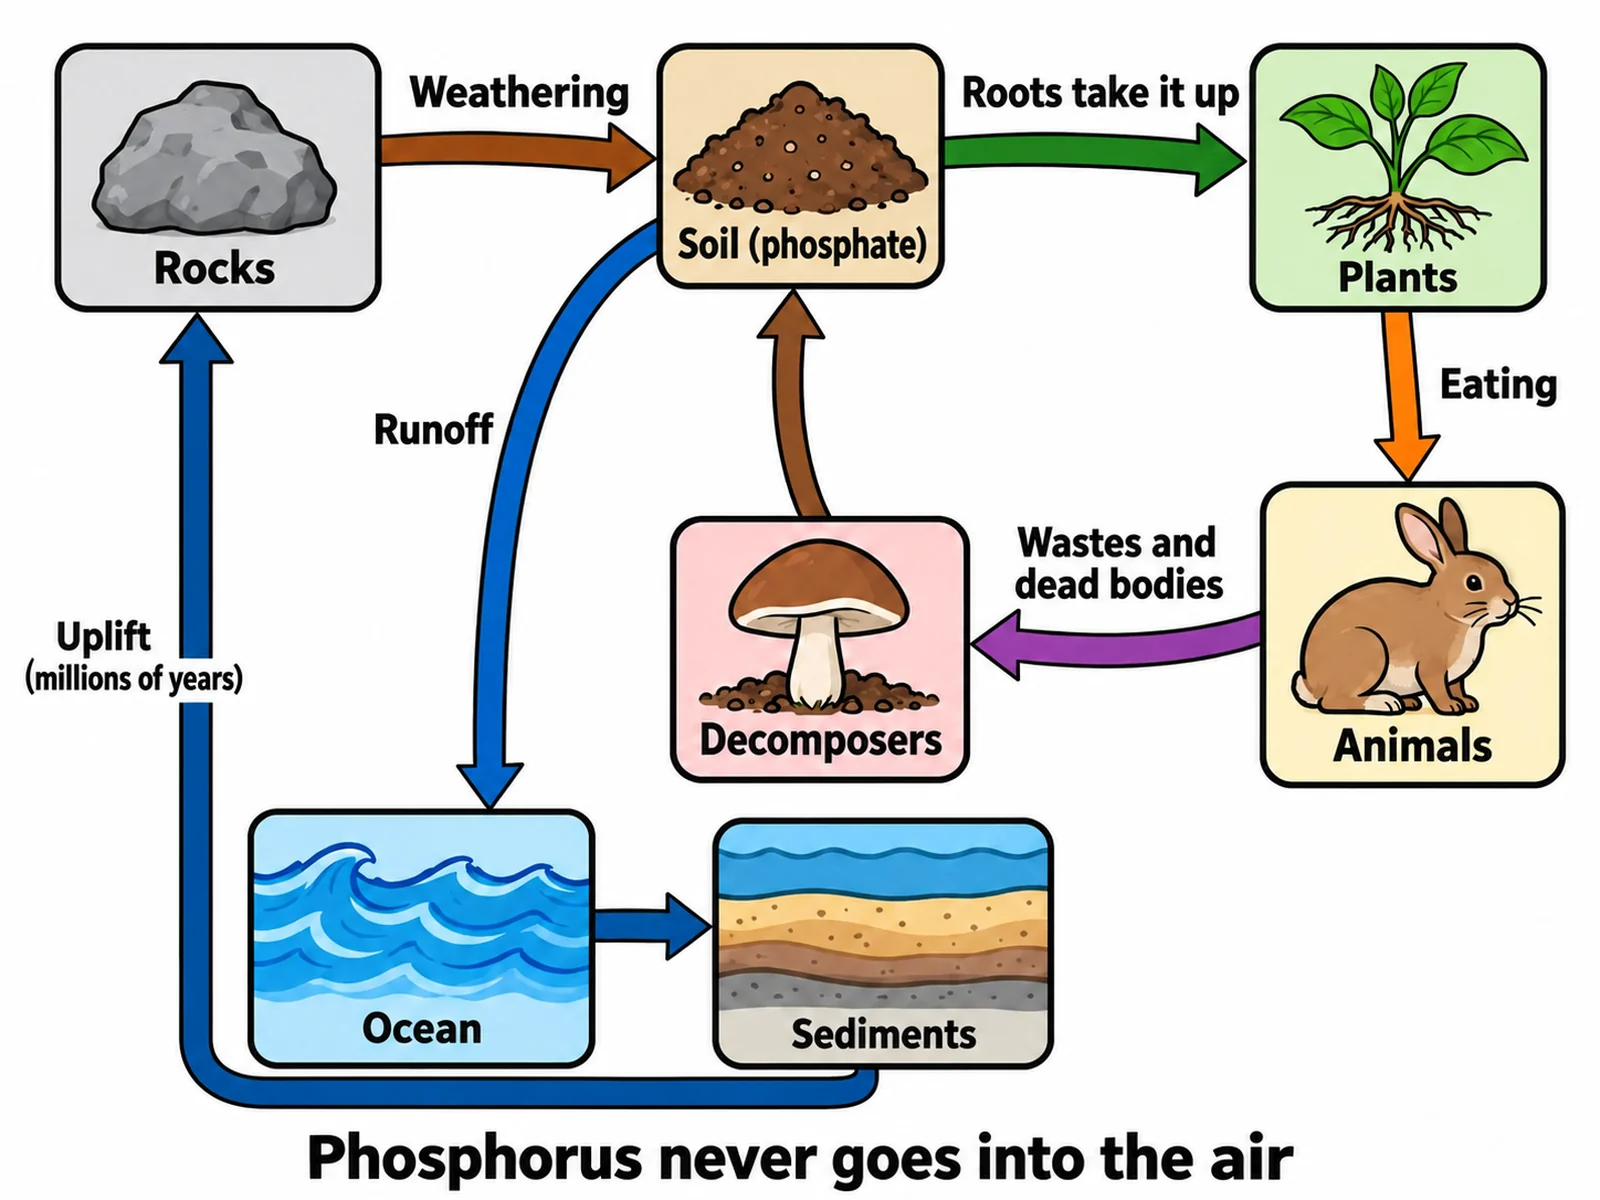
Create a simple phosphorus cycle diagram that is easy to copy by hand, on a white background, with bold flat colours, thick dark outlines, large text, and plenty of white space. Draw six rounded boxes with a small picture in each, joined by thick arrows in a loop: "Rocks" to "Soil (phosphate)" with the arrow labeled "Weathering", then "Plants" with the arrow labeled "Roots take it up", then "Animals" with the arrow labeled "Eating", then "Decomposers" with the arrow labeled "Wastes and dead bodies", then back to "Soil (phosphate)". Add one side branch from the soil: "Runoff" to "Ocean", then "Sediments", then an arrow back to "Rocks" labeled "Uplift (millions of years)". Caption: "Phosphorus never goes into the air".
Use this example
Prompt
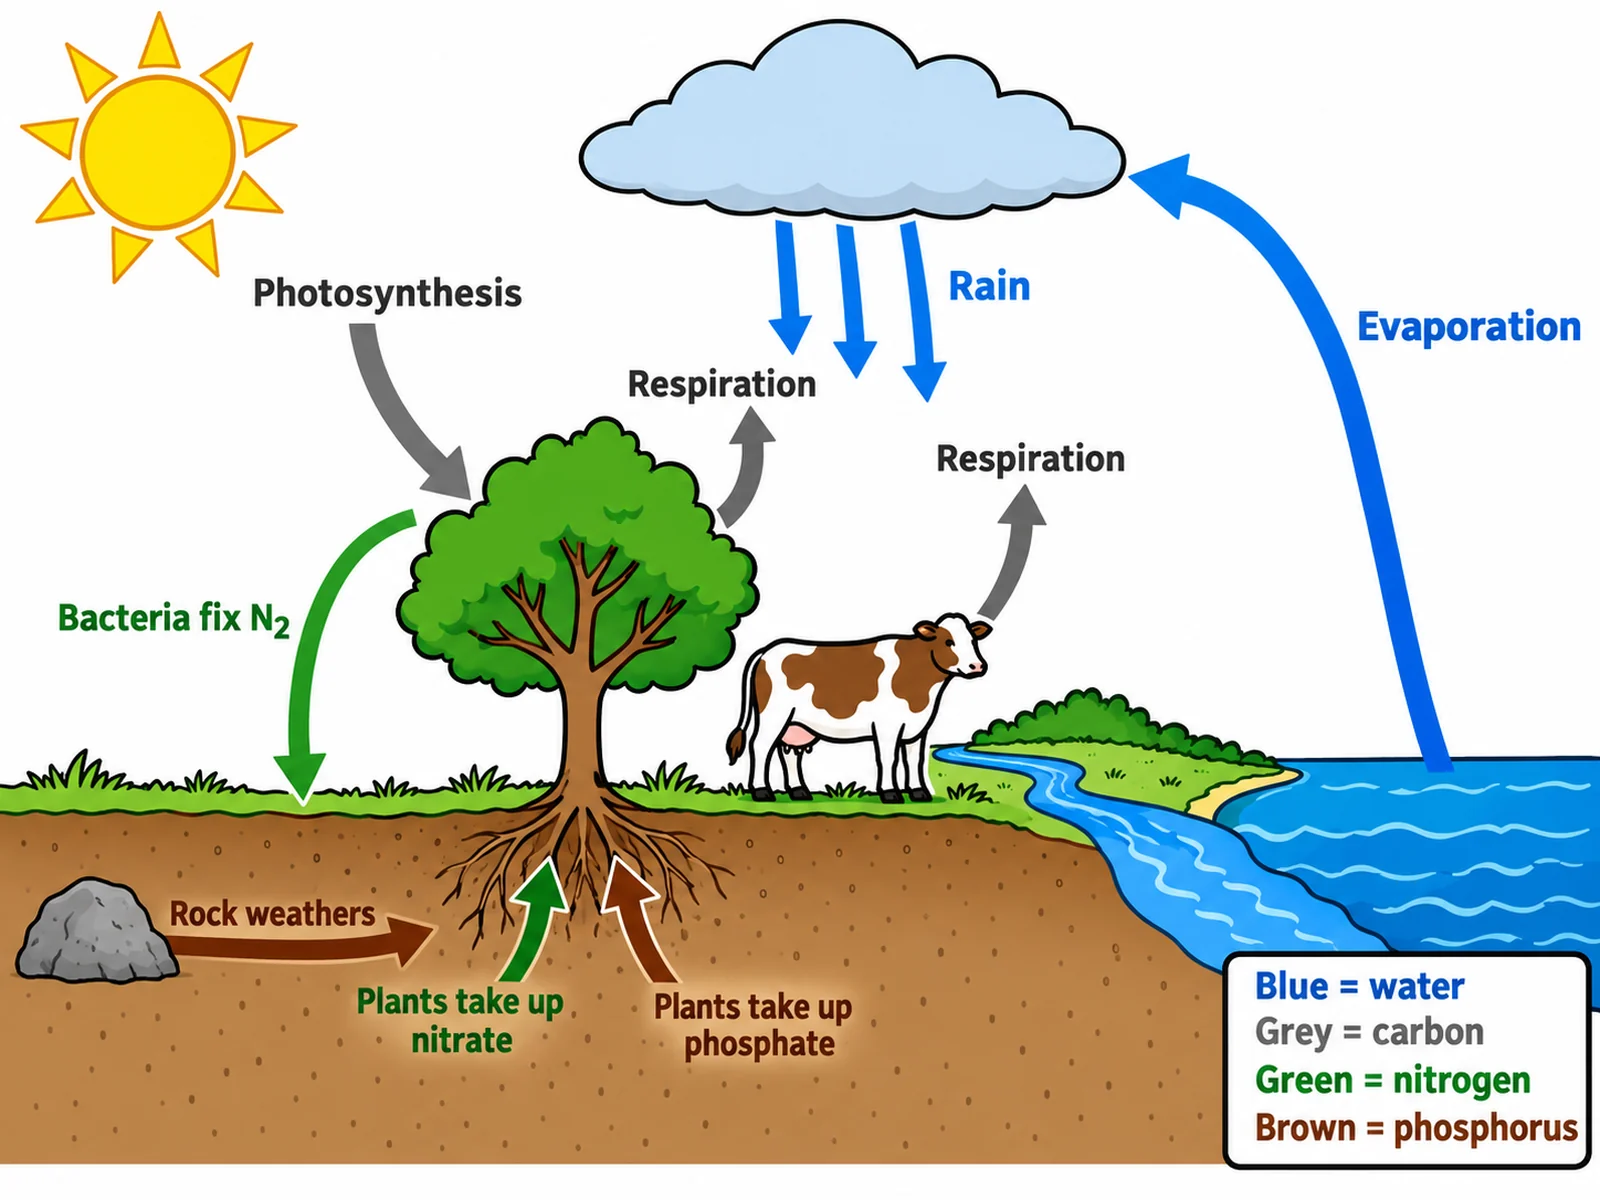
Create an easy biogeochemical cycles drawing for students to copy: one simple landscape on a white background with a sun, one cloud, one tree, one cow, a strip of soil, a river, and the ocean, in bold flat colours with thick outlines and large text. Draw each cycle as its own colour of arrows with only two or three short labels, plus a colour key: blue "Water" — "Evaporation" from the ocean up to the cloud, "Rain" from the cloud down; grey "Carbon" — "Photosynthesis" from the air into the tree, "Respiration" from the tree and the cow back to the air; green "Nitrogen" — "Bacteria fix N2" in the soil at the tree roots, "Plants take up nitrate"; brown "Phosphorus" — "Rock weathers" from a rock into the soil, "Plants take up phosphate". Keep every brown arrow at ground level or below, never in the sky.
Use this example
Prompt
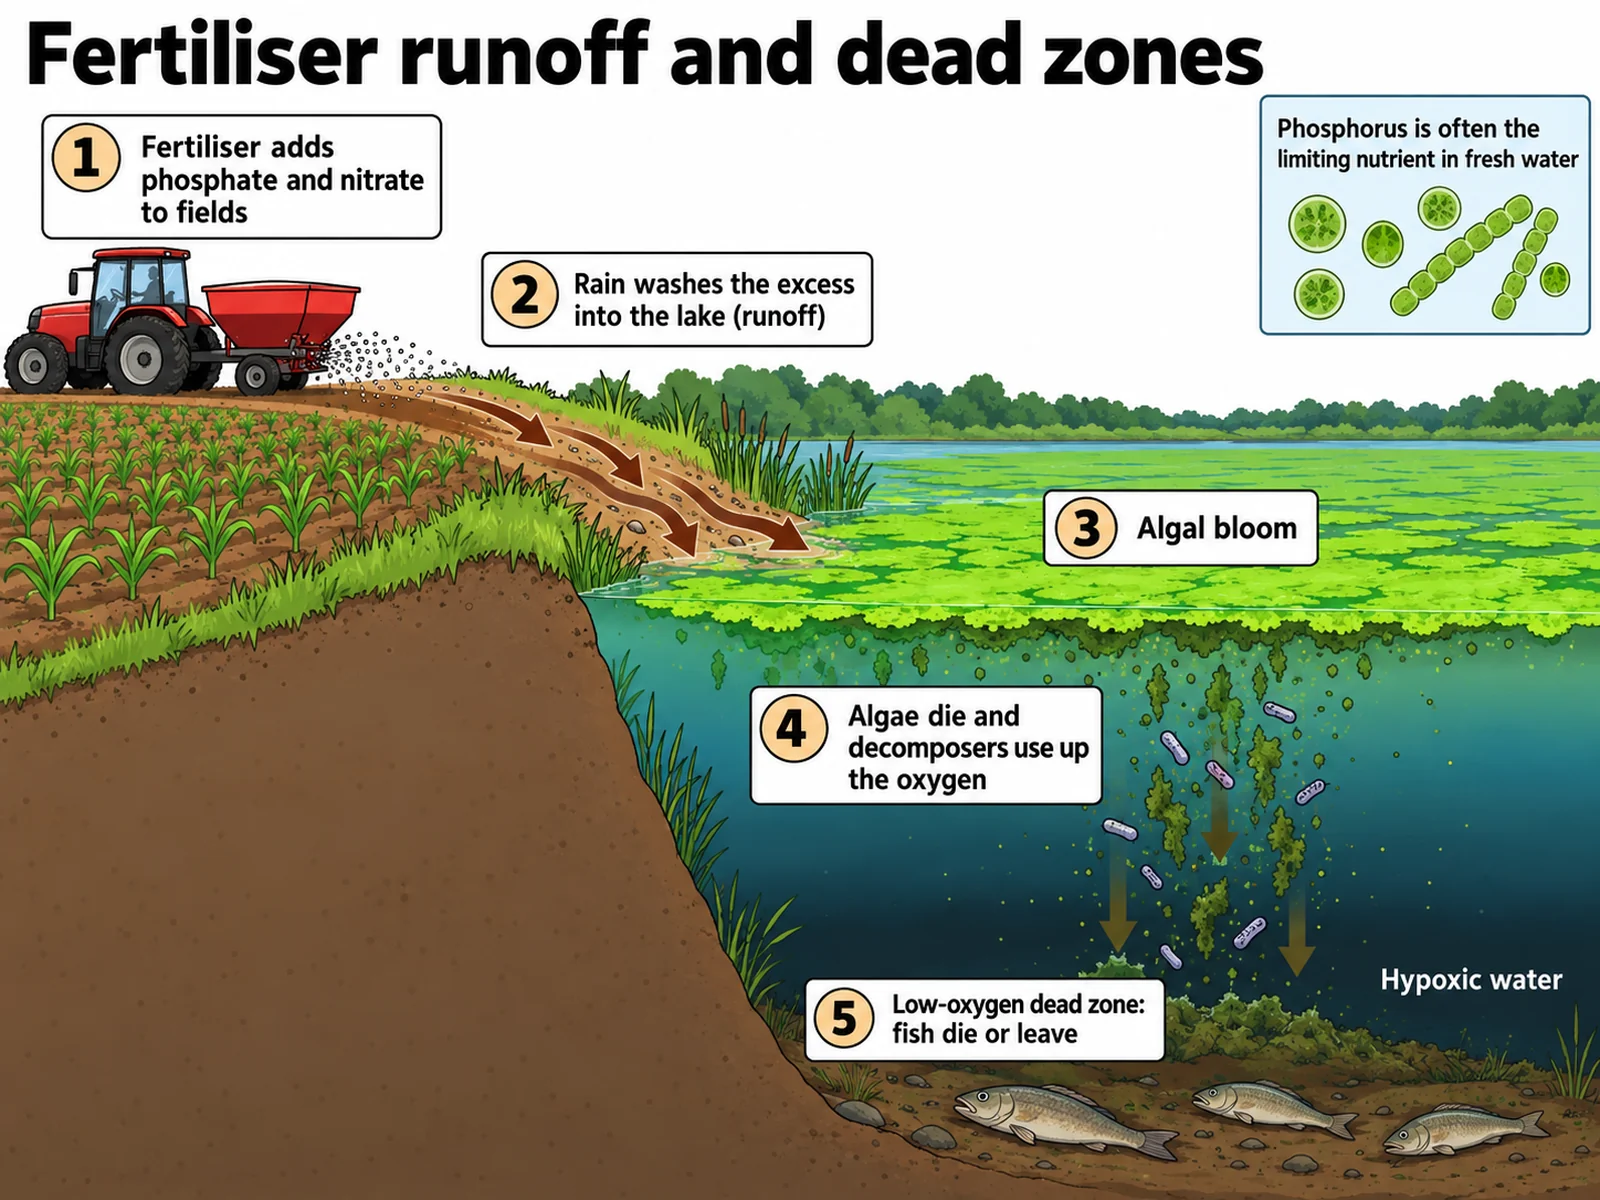
Create a labeled eutrophication diagram on a white background as five numbered steps from left to right across a farm and a lake. Step 1 "Fertiliser adds phosphate and nitrate to fields" with a tractor spreading fertiliser. Step 2 "Rain washes the excess into the lake (runoff)" with arrows from the field into the water. Step 3 "Algal bloom" with a thick green layer on the lake surface. Step 4 "Algae die and decomposers use up the oxygen" with bacteria and falling dead algae. Step 5 "Low-oxygen dead zone: fish die or leave" with a few fish lying on the lake bed and the label "Hypoxic water". Add a small inset reading "Phosphorus is often the limiting nutrient in fresh water". No arrows into the air.
Use this example
Prompt
Create a blank phosphorus cycle worksheet that is the same drawing as a labeled phosphorus cycle landscape with the names removed: land on the left, ocean on the right, an empty sky, a rocky hill, rain, soil, a plant, a grazing animal, bacteria and fungi in the soil, a river, plankton and fish in the sea, and a sea floor, with the same arrows. Replace the twelve names with numbered empty answer lines: 1 the rocky hill (phosphate rock), 2 rain on the rock (weathering), 3 the soil (phosphate in soil), 4 soil to plant (uptake by plant roots), 5 plant to animal (animals eat plants), 6 down to the soil (wastes and dead organisms), 7 bacteria and fungi (decomposers), 8 the river (runoff and leaching), 9 the sea water (phosphate dissolved in water), 10 plankton and fish (marine organisms), 11 the sea floor (ocean sediments), 12 sea floor back to the hill (geological uplift). Keep the caption "No gas phase: phosphorus does not enter the atmosphere". Word bank: "phosphate rock, weathering, phosphate in soil, uptake by plant roots, animals eat plants, wastes and dead organisms, decomposers, runoff and leaching, phosphate dissolved in water, marine organisms, ocean sediments, geological uplift".
Blank worksheet
Use this example
How to make a biogeochemical cycles diagram
1
Pick the cycle and the labels
Choose all four main cycles or one cycle on its own — phosphorus, carbon, nitrogen, water, or sulfur — then the level and whether you want it labeled, numbered with a key, or a blank worksheet.
2
Generate the diagram
The generator draws each reservoir as a picture and each process as a labeled arrow from source to destination, keeps phosphorus out of the air, and gives every cycle its own panel or colour.
3
Check it, then export
Follow every arrow, check that plants respire, that N₂ is fixed by bacteria rather than absorbed, and that no phosphorus rises into the sky. Then download the PNG or make the matching worksheet or answer key from the same image.
Biogeochemical cycles key facts
Definition
Recycling of inorganic matter between living things and their environment
Main cycles
Water, carbon, nitrogen, phosphorus (plus sulfur)
Phosphorus form
Phosphate ion, PO₄³⁻
Phosphorus gas phase
None significant — a sedimentary cycle
Phosphate in the ocean
Stays 20,000–100,000 years on average
Atmospheric nitrogen
About 78% of the air, as N₂
Earth’s water
97.5% is salt water
Carbon in the ocean
More than 90% as bicarbonate ions
What is a biogeochemical cycles diagram?
A biogeochemical cycles diagram is a picture of how a chemical element or compound moves between living things and the non-living Earth. OpenStax Biology defines a biogeochemical cycle as the recycling of inorganic matter between living organisms and their environment, and the word itself breaks into three parts: “bio” for the organisms, “geo” for the rocks, soil, water, and air, and “chemical” for the element being followed. Matter on Earth is not used up and replaced — the same carbon, nitrogen, and phosphorus atoms have been passed around for billions of years — so every one of these diagrams is a loop.
Every diagram of a biogeochemical cycle is built from two kinds of thing. Reservoirs are where the element is stored: the atmosphere, the oceans, fresh water, rock and sediment, soil, and living organisms. Processes are what move it from one reservoir to another, drawn as labeled arrows: evaporation and precipitation for water, photosynthesis and respiration for carbon, fixation and denitrification for nitrogen, weathering and uplift for phosphorus. A biogeochemical diagram that names the reservoirs, labels each arrow with its process, and points each arrow the right way already does most of what a teacher or an exam asks for.
Biogeochemical cycles diagram: what each cycle shows
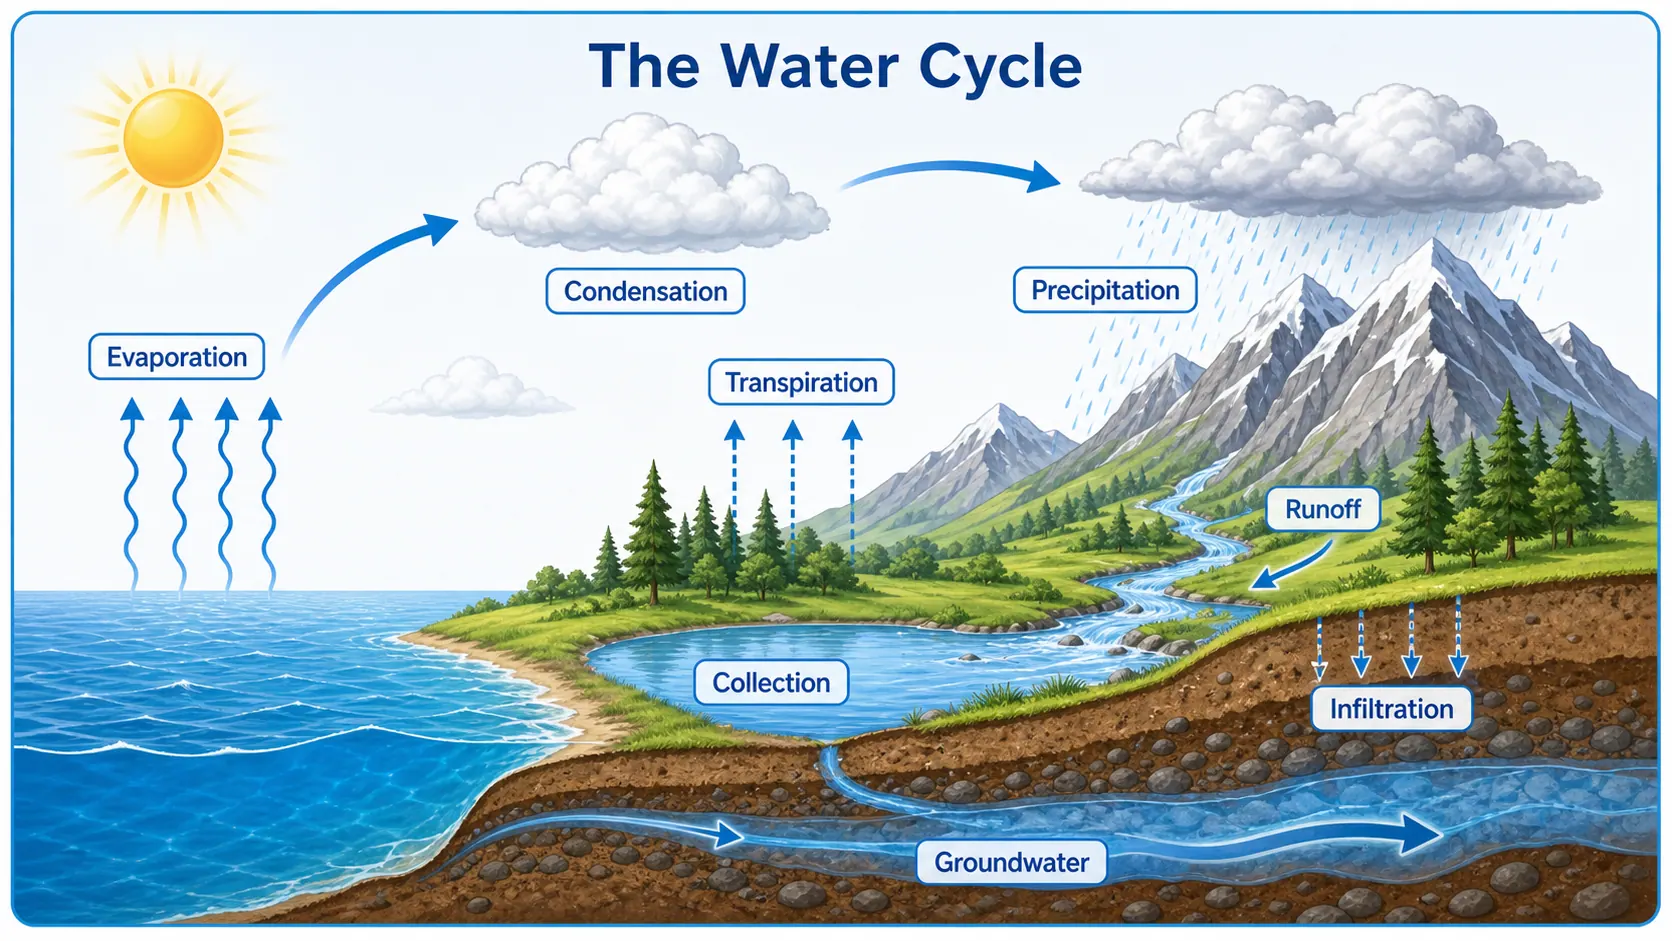
Water cycle: evaporation from oceans and lakes, transpiration from leaves, condensation into clouds, precipitation, runoff into rivers, infiltration into the ground, and groundwater flow back to the sea. The ocean is the main reservoir; OpenStax notes that 97.5 percent of Earth’s water is salt water.
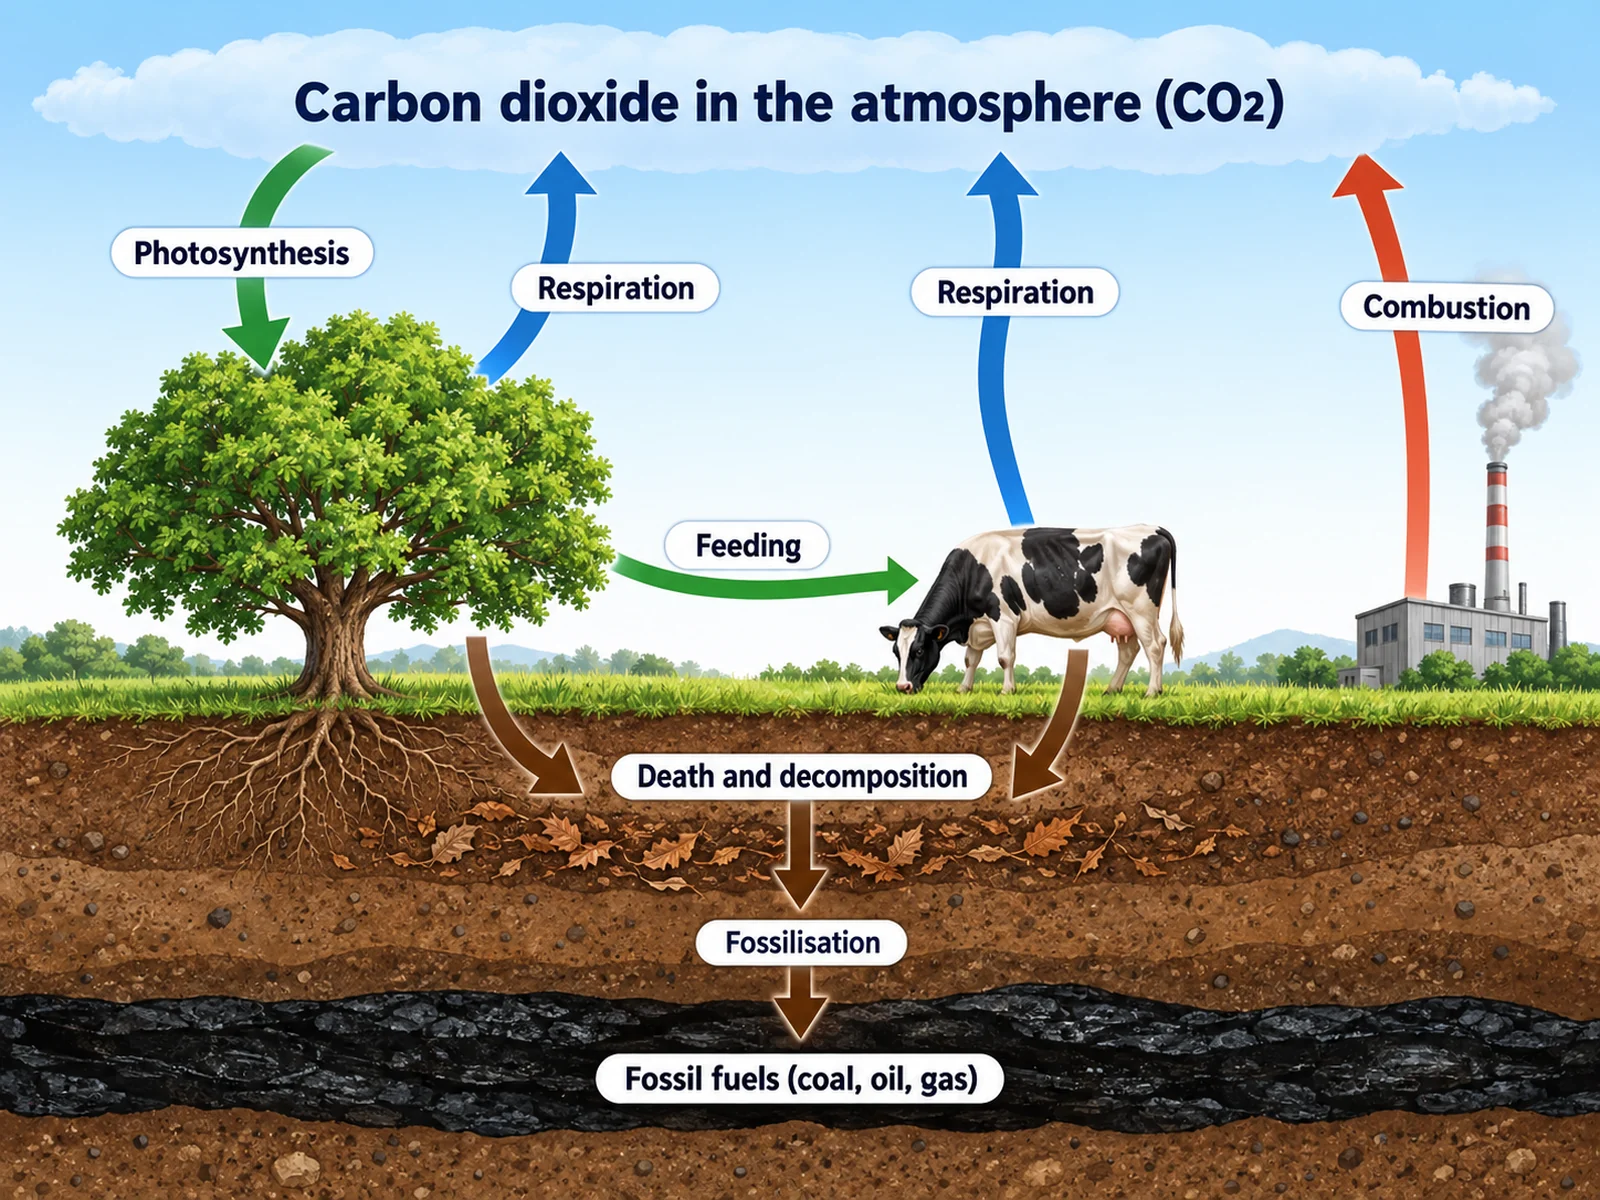
Carbon cycle: photosynthesis pulls CO₂ out of the air into plants; respiration by plants, animals, and decomposers puts it back; burning fossil fuels and wood adds more; the ocean exchanges CO₂ with the air and holds most of its carbon as bicarbonate; limestone, sediments, and fossil fuels store carbon for millions of years.
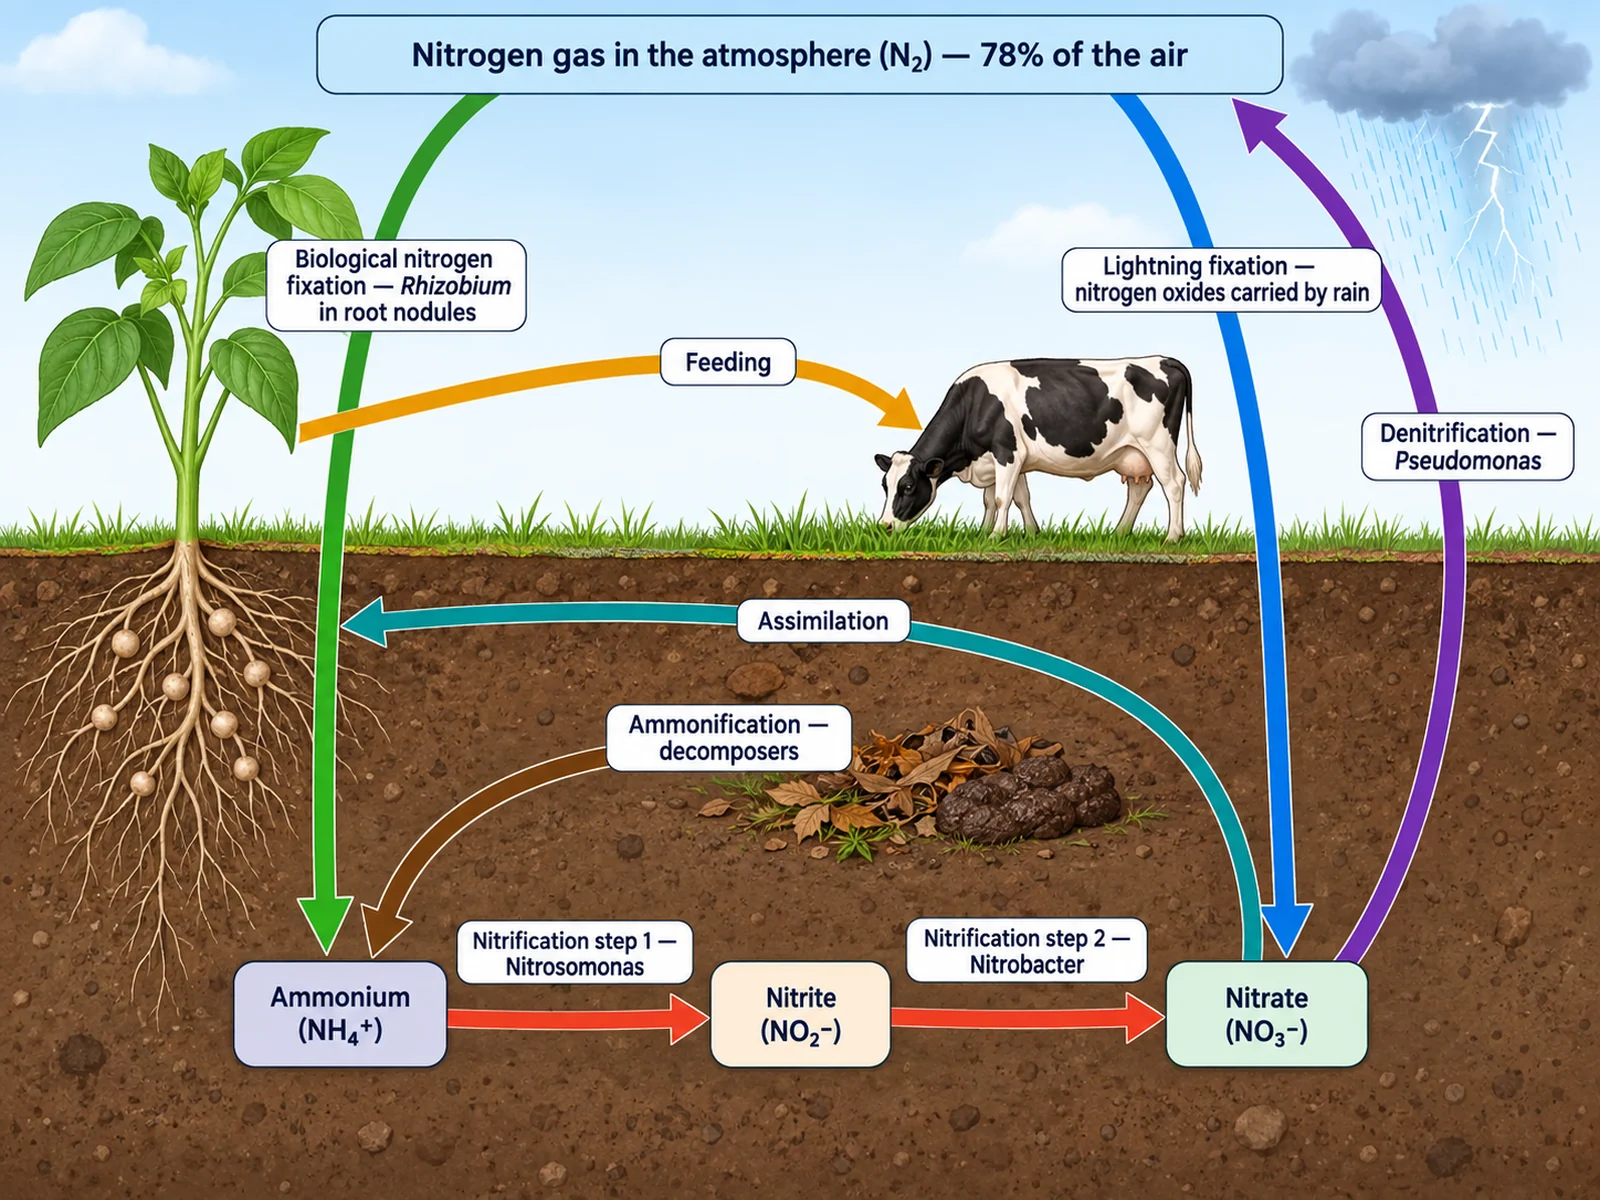
Nitrogen cycle: N₂ makes up about 78 percent of the air but cannot be used directly by plants or animals. Bacteria and lightning fix it into ammonium, nitrifying bacteria turn ammonium into nitrite and then nitrate, plants take up nitrate and ammonium, decomposers return ammonium from dead matter, and denitrifying bacteria send nitrate back to the air as N₂.
Phosphorus cycle: weathering releases phosphate from rock into soil and water, plants take it up through their roots, animals eat the plants, decomposers return it to the soil, runoff carries it to the ocean, it settles into sediments, and uplift returns it to land as rock over millions of years — with no gas phase at any point.
Sulfur cycle, often added as a fifth: SO₂ from volcanoes, decomposition, and fossil fuels enters the air, returns in rain, and is taken up by plants as sulfate for building amino acids such as cysteine.
The phosphorus cycle, step by step
The phosphorus cycle starts in rock. Phosphate minerals such as apatite are locked in rocks on land, and as rain, frost, and roots break the rock down — weathering — phosphate ions (PO₄³⁻) are released into the soil and into the water running through it. This is the only way new phosphorus enters the part of the cycle that living things can reach, which is why weathering is the first arrow on every phosphorus cycle diagram.
From the soil, phosphate enters the food web through plants. Roots absorb dissolved phosphate from the soil water, and most plants get help from mycorrhizal fungi, whose fine threads reach far further into the soil than root hairs can. Animals obtain phosphorus by eating plants or by eating other animals. When plants and animals excrete wastes, shed leaves, or die, decomposers — bacteria and fungi — break down the organic matter and release the phosphate back into the soil, a step called mineralisation. On land, this short loop of soil, plants, animals, and decomposers can turn over many times.
Some phosphate escapes the land loop. Runoff and leaching carry it into streams, rivers, and lakes and eventually to the ocean, where it is taken up by phytoplankton and passed along the marine food web. When marine organisms die, their remains, and the phosphate in them, sink and settle on the sea floor as sediment. Over millions of years those sediments are compacted into sedimentary rock and raised above sea level by geological uplift, and weathering starts the cycle again. OpenStax gives the average time phosphate spends dissolved in the ocean before it reaches the sediments as 20,000 to 100,000 years.
How to draw a simple diagram of the phosphorus cycle
If the task is to draw a simple diagram of the phosphorus cycle, six boxes and one side branch are enough. Draw the boxes in a loop and join them with arrows in this order: rocks, soil (phosphate), plants, animals, decomposers, and back to soil. Label the arrows weathering (rocks to soil), absorbed by roots (soil to plants), eating (plants to animals), and wastes and dead bodies (plants and animals to decomposers). Then add the long, slow branch: runoff from the soil to the ocean, ocean to sediments, and an arrow from the sediments back to rocks labeled uplift, over millions of years.
Two details make a simple phosphorus cycle look like it was drawn by someone who understands it. First, leave the sky empty — no arrow should carry phosphorus up into the air or down in the rain, because phosphorus has no gas phase. Second, write the time scale on the uplift arrow, because the contrast between the fast loop through living things and the very slow return through rock is the most important idea in the whole cycle. For a younger class, use pictures instead of words in the boxes — a rock, a patch of soil, a plant, a rabbit, a mushroom, and a wave.
Why the phosphorus cycle has no gas phase, and why it is the slowest
Water, carbon, nitrogen, and sulfur all form gases at the temperatures and pressures found at the Earth’s surface — water vapour, CO₂ and methane, N₂, SO₂ and hydrogen sulfide — so each of their cycles includes the atmosphere as a reservoir, and atoms can travel around the planet in a matter of days or weeks. Phosphorus does not form a stable gas under those conditions. It stays in rock, soil, water, and living things, mostly as phosphate. Windblown dust, volcanic ash, and sea-spray aerosols can carry small amounts through the air, and OpenStax notes these can be significant phosphate sources in remote regions, but that is particles drifting, not a gas phase, and it is left off standard diagrams.
Without an atmospheric shortcut, phosphorus that reaches the ocean has only one way home: through the rock cycle. It must settle into sediments, be compressed into rock, and be lifted above sea level by tectonic forces before weathering can release it again. That is why the phosphorus cycle is the slowest of the major biogeochemical cycles, and why phosphorus is so often the limiting nutrient in ecosystems — at any given moment, very little of it is dissolved where plants and algae can use it.
Biogeochemical cycles easy drawing: one scene, four colours
A biogeochemical cycles easy drawing does not need four separate diagrams. Draw one simple landscape — a sun, a cloud, a tree, an animal, a strip of soil, a river, and the ocean — and then draw each cycle on top of it as its own colour of arrows. Blue for water: evaporation from the ocean up to the cloud, and rain falling back down. Grey for carbon: photosynthesis from the air into the tree, respiration from the tree and the animal back into the air. Green for nitrogen: bacteria fixing N₂ near the tree roots, and the roots taking up nitrate. Brown for phosphorus: a rock weathering into the soil, and the roots taking up phosphate.
Two or three labels per cycle keeps the drawing easy to copy, and a small colour key in the corner keeps the cycles apart. The one rule worth repeating to students is that every brown arrow stays at ground level or below. If the drawing is for an elementary or middle-school class, ask for large text and everyday words; for high school, add the chemical forms, such as CO₂, N₂, and NO₃⁻.
If the drawing is going to be marked, it is worth sketching it in pencil first in this order: the landscape, then the blue water arrows, then grey, green, and brown. Drawing the water cycle first fixes where the cloud, the river, and the ocean sit, and the other three cycles then hang off the same tree, animal, and soil. Finish by writing the colour key, so a reader can tell the four cycles apart without reading a single arrow label.
Carbon: CO₂ in the air, plants, animals, decomposers, fossil fuels, ocean, limestone; photosynthesis, respiration, decomposition, combustion, diffusion between air and ocean.
Phosphorus: phosphate rock, phosphate (PO₄³⁻) in soil and water, plants, animals, decomposers, ocean sediments; weathering, uptake, consumption, decomposition, runoff, sedimentation, uplift.
Sulfur, if included: volcanoes, SO₂ in the air, sulfate in soil and water, plants, decomposers, hydrogen sulfide; deposition, uptake, decomposition, acid rain.
For every cycle: an arrow for each process, pointing from where the element comes from to where it goes.
Phosphorus, nitrogen, and eutrophication: how fertiliser makes dead zones
Farming moves phosphorus faster than any natural process. Phosphate rock is mined and spread on fields as fertiliser, moving phosphorus out of a store that would normally release it over millions of years. Crops do not take up all of it. The excess, together with nitrogen from fertiliser, manure, and sewage, washes off the land in runoff and ends up in lakes, rivers, and coastal seas.
Because phosphorus and nitrogen are usually the nutrients in shortest supply in water, adding them causes eutrophication: algae grow explosively into a bloom that turns the water green. When the algae die, they sink, and the bacteria that decompose them use up the dissolved oxygen. Water with too little oxygen for most animals is called hypoxic, and large hypoxic areas are called dead zones; fish and other mobile animals leave and the rest die. NOAA identifies nutrient pollution as the primary cause of human-made dead zones. A diagram of this process is a good companion to a phosphorus cycle diagram, because it shows what happens when the slowest cycle on Earth is suddenly sped up.
The sulfur cycle in brief
Sulfur is the fifth cycle most courses mention. Unlike phosphorus, it has an atmospheric phase: sulfur dioxide (SO₂) enters the air from volcanoes and geothermal vents, from the decomposition of organic matter, and from burning coal and oil. It returns to land and water dissolved in rain, as fallout, and by the weathering of sulfur-containing rock. Plants take up sulfate from the soil and build it into the amino acid cysteine, whose disulfide bonds help proteins hold their shape. Decomposers can release sulfur back to the air as hydrogen sulfide (H₂S). Burning fossil fuels has raised atmospheric SO₂, which forms acid rain that lowers the pH of lakes and damages buildings, and that is the human impact a sulfur cycle diagram usually shows.
How the cycles connect through living things
The cycles are drawn separately, but in real ecosystems they are linked, because every organism needs all of these elements at once. A single molecule of DNA contains carbon, nitrogen, and phosphorus; every protein needs carbon and nitrogen, and many need sulfur; every membrane needs phosphorus. When a plant cannot get enough nitrogen or phosphorus, its photosynthesis slows and it takes less CO₂ from the air, so a shortage in one cycle slows another. Decomposers sit at the centre of all four diagrams, returning carbon as CO₂, nitrogen as ammonium, phosphorus as phosphate, and sulfur as sulfate or hydrogen sulfide from the same dead leaf. For a deeper diagram of one cycle, the carbon, nitrogen, and water cycle generators on this site each give that cycle a full figure of its own.
Biogeochemical cycles drawing: what to check before you hand it in
Follow every arrow from start to finish: each one should run from the source reservoir to the destination.
Look at the sky: there should be no phosphorus arrows in it.
Check the carbon cycle for plant respiration, not just animal respiration.
Check the nitrogen cycle: N₂ is fixed by bacteria or lightning, never absorbed by roots, and denitrification starts from nitrate.
Check the water cycle for transpiration from leaves.
Check the labels: each process name sits on its own arrow and each cycle keeps its own colour.
Check the time scale, if one is shown: phosphorus is the slowest cycle, and water the fastest.
Most common biogeochemical cycle diagram mistakes
These are the errors that turn up most often in student drawings, in images found online, and in AI output. Check for each one before a diagram goes on a worksheet.
MistakeCorrect
MistakePhosphorus is drawn rising into the air as a gas.
CorrectThe phosphorus cycle has no significant gas phase. It moves through rock, soil, water, and living things; dust only carries traces.
MistakePlants absorb N₂ straight from the air.
CorrectPlants take up nitrate (NO₃⁻) and ammonium (NH₄⁺) from the soil. N₂ must first be fixed by bacteria or lightning.
MistakeAnimals or plants fix nitrogen.
CorrectOnly certain bacteria, including Rhizobium in legume root nodules and cyanobacteria, plus lightning and the Haber–Bosch process, fix N₂.
MistakeDenitrification starts from ammonium.
CorrectDenitrifying bacteria turn nitrate (NO₃⁻) back into N₂, in waterlogged, low-oxygen soil.
MistakeOnly animals respire in the carbon cycle.
CorrectPlants respire too, day and night, and decomposers release CO₂ as they break down dead matter.
MistakeThe water cycle has no transpiration.
CorrectPlants release water vapour through their leaves; a full water cycle shows it beside evaporation.
MistakeEvery cycle is drawn as if it runs at the same speed.
CorrectWater vapour cycles through the air in days; phosphorus returns to land only through geological uplift over millions of years.
MistakeArrows point the wrong way, such as rain going up or roots releasing phosphate.
CorrectEvery arrow runs from the source to the destination: rain falls, uptake goes into the roots, runoff goes downhill.
Water vs carbon vs nitrogen vs phosphorus cycle
The four main biogeochemical cycles differ most in where the element is stored and whether it passes through the air.
Water
Carbon
Nitrogen
Phosphorus
Main reservoir
Oceans
Rock and fossil fuels; ocean and air in the fast cycle
Atmosphere, as N₂
Phosphate rock and ocean sediments
Gas in the atmosphere
Yes — water vapour
Yes — CO₂ and methane
Yes — N₂ and nitrogen oxides
No significant gas phase
Key biological step
Transpiration from leaves
Photosynthesis and respiration
Nitrogen fixation by bacteria
Uptake by roots; decomposition
Main human impact
Dams, irrigation, pumping groundwater
Burning fossil fuels, clearing forests
Synthetic fertiliser and runoff
Mining phosphate for fertiliser; runoff
Relative speed
Fastest — days in the air
Fast in life; very slow in rock
Fast in soil; slow in sediment
Slowest — millions of years to uplift
Biogeochemical Cycles Diagram FAQ
A biogeochemical cycle is the path an element or compound takes as it moves between living things and the non-living parts of the Earth — the atmosphere, the water, and the rocks and soil — and back again. OpenStax Biology defines it as the recycling of inorganic matter between living organisms and their environment. The name says what each one involves: “bio” for organisms, “geo” for rocks, soil, water and air, and “chemical” for the element being tracked.
Generate carbon, nitrogen, and water cycle diagrams, food webs, photosynthesis figures, and worksheet-ready science illustrations with the same SciFigure AI workflow.