Waterfall Plot Generator for Oncology Response Data
One bar per patient, sorted from tumor growth to tumor shrinkage, with RECIST reference lines.
Upload best percentage change in the sum of target lesion diameters and an optional best overall response column. SciFigure sorts the patients, counts CR, PR, SD and PD, flags values RECIST cannot produce, and draws a publication-ready waterfall plot. Step data with start and total rows becomes a cumulative waterfall chart instead.
−30% and +20% reference linesColors from your response columnCumulative waterfall chart mode
AI Waterfall Plot Generator
Upload per-patient response data and describe the plot.
Try sample data
Aspect ratio
392 / 2000 characters
Costs 5 credits. Bar order, response counts, and reference lines are computed from your uploaded data, then drawn as a PNG.
Preview
Waterfall Plot Examples
Aspect ratio: 16:9
These previews were drawn from the sample datasets. Load a sample or upload your own file to generate a waterfall plot.
Waterfall plot examples
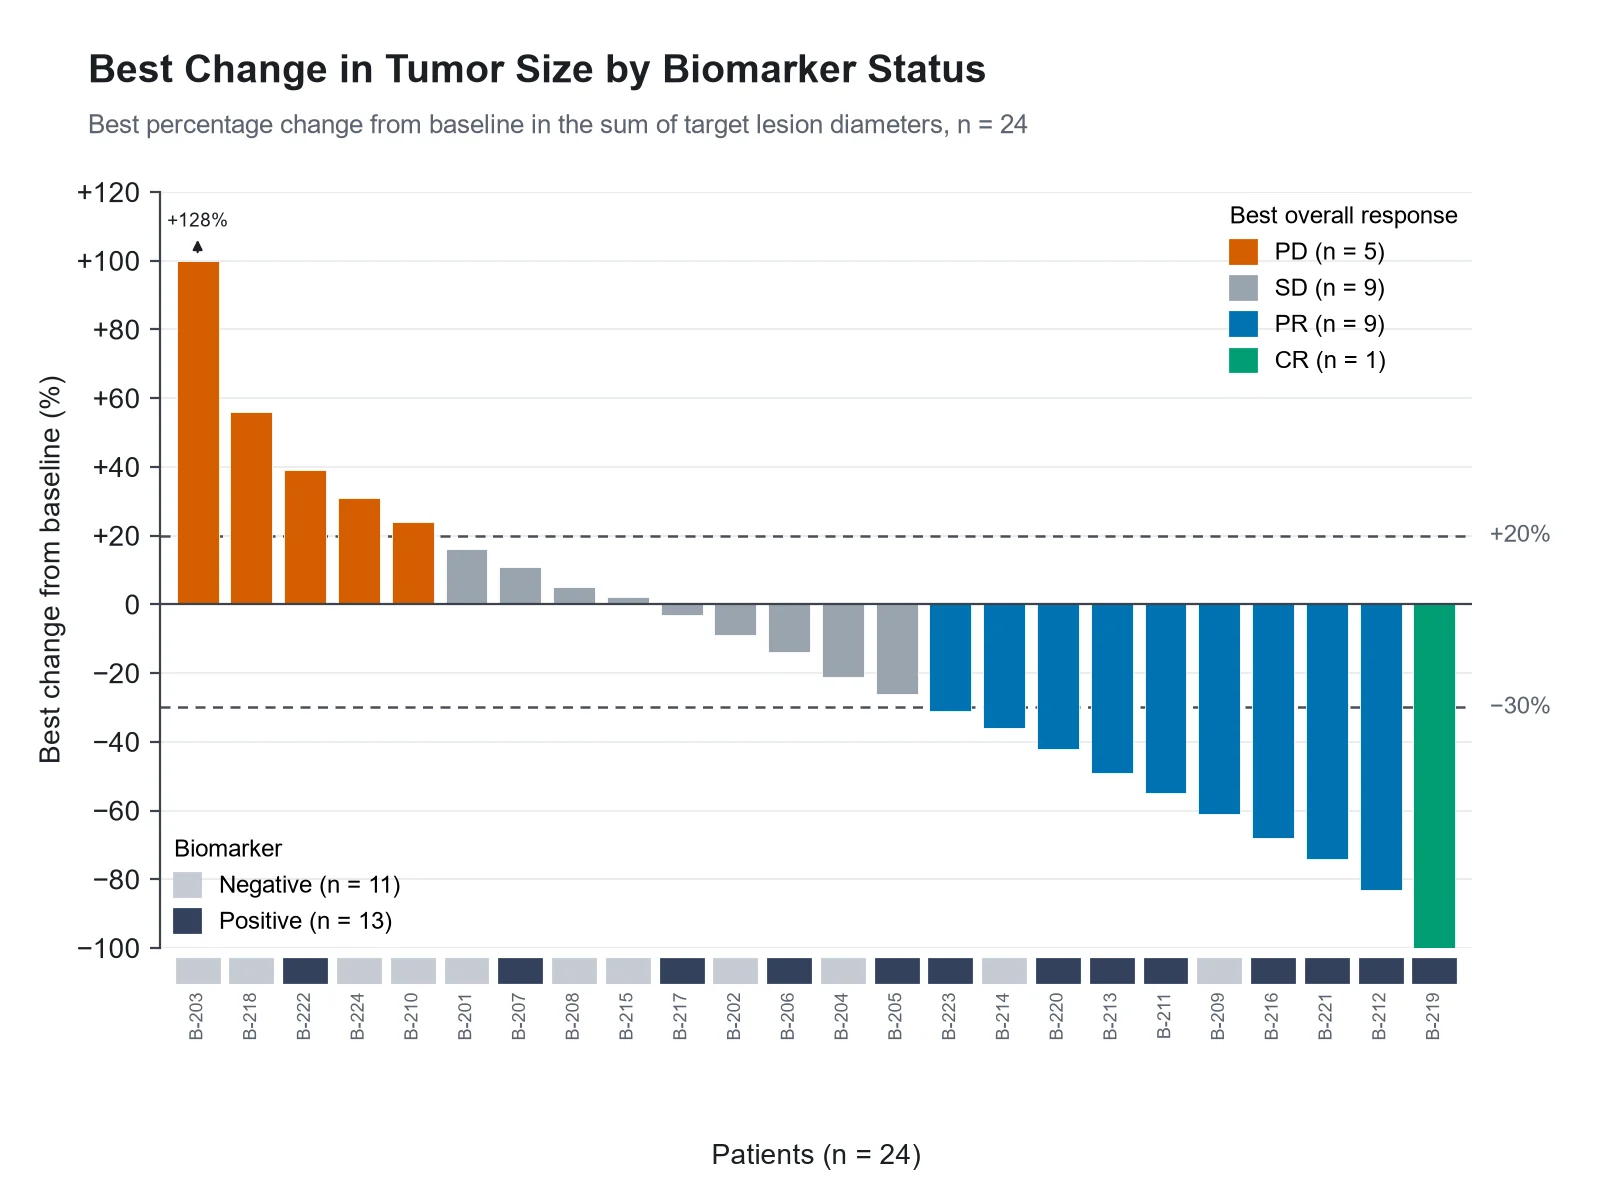
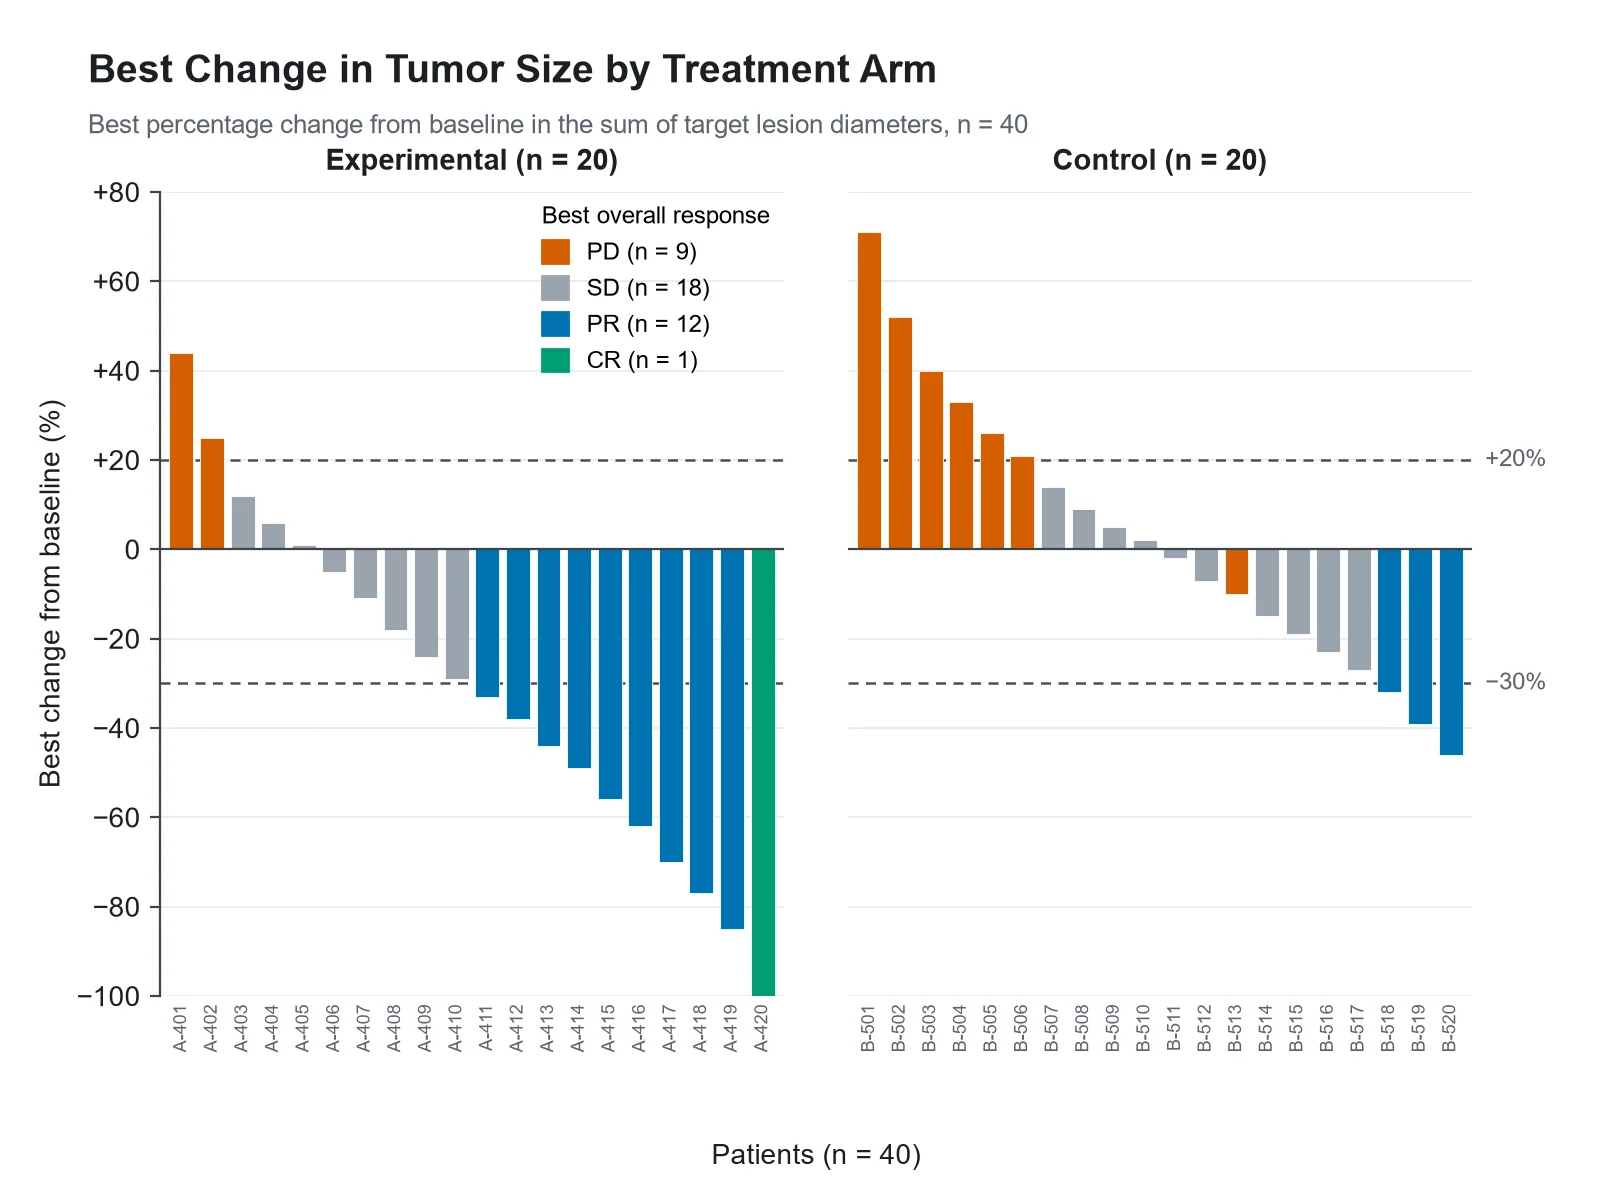
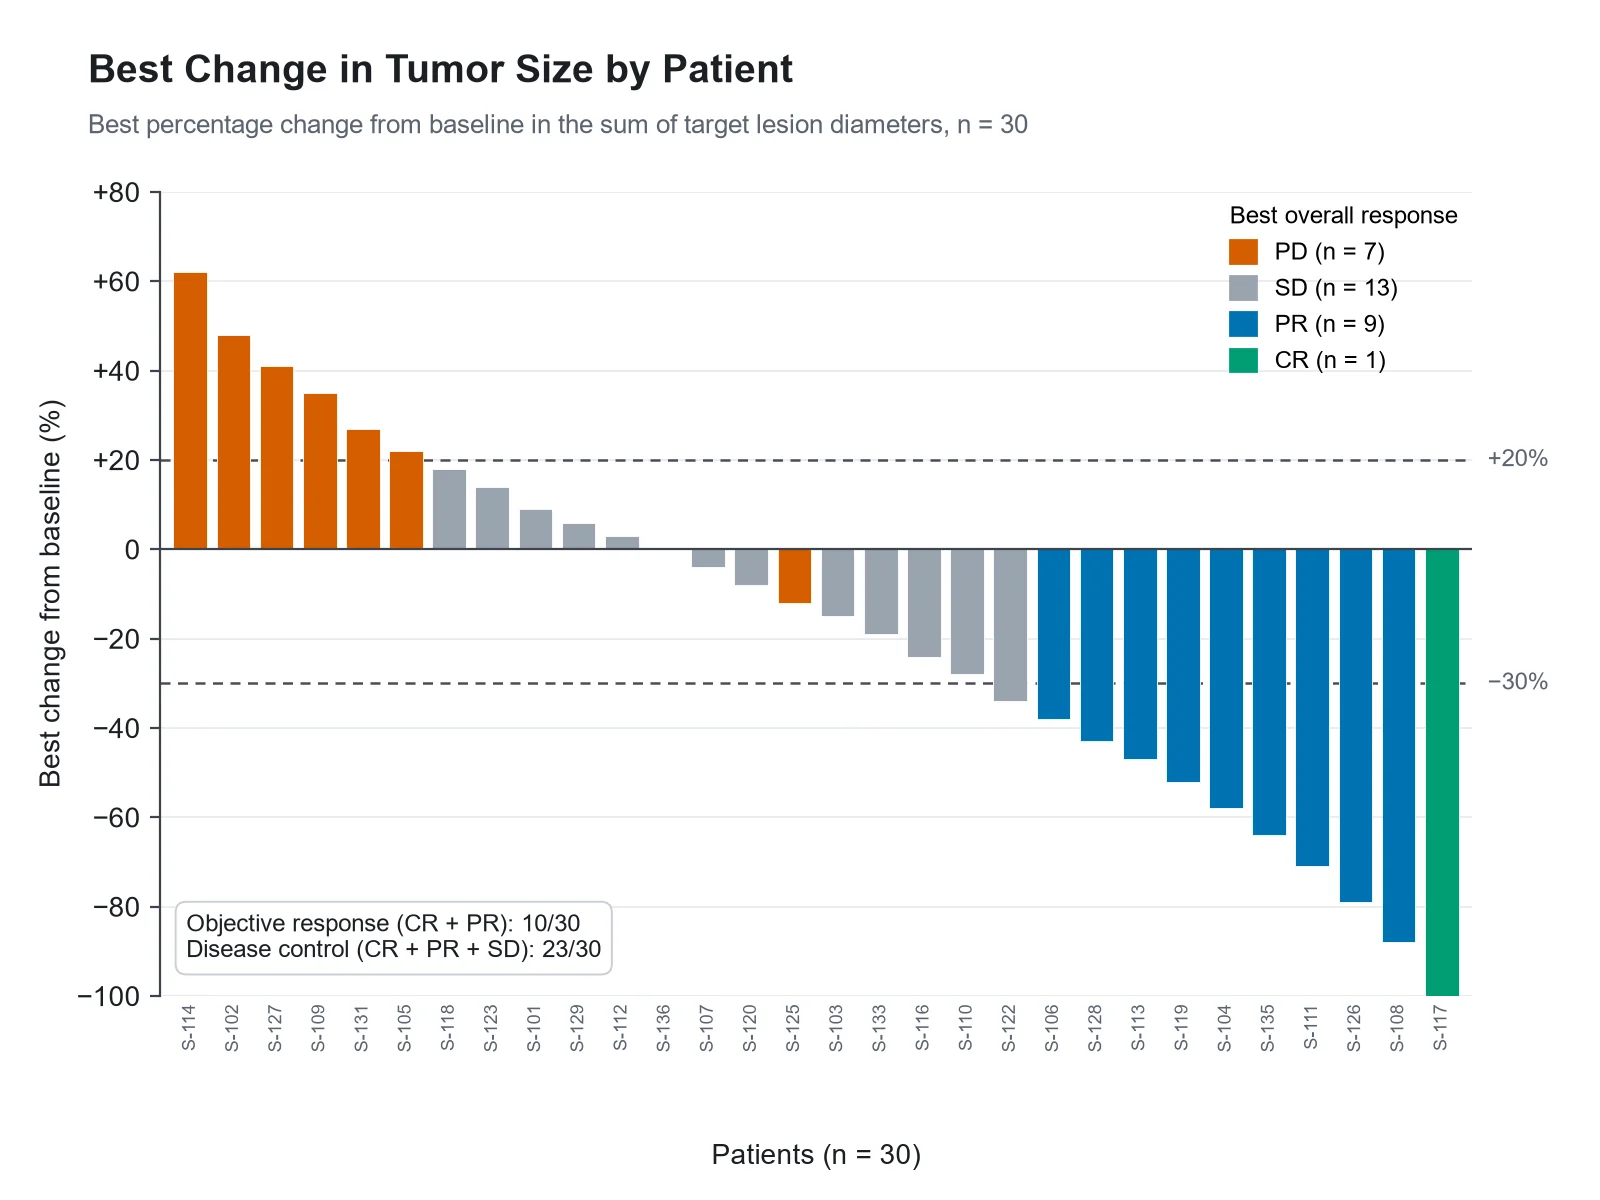
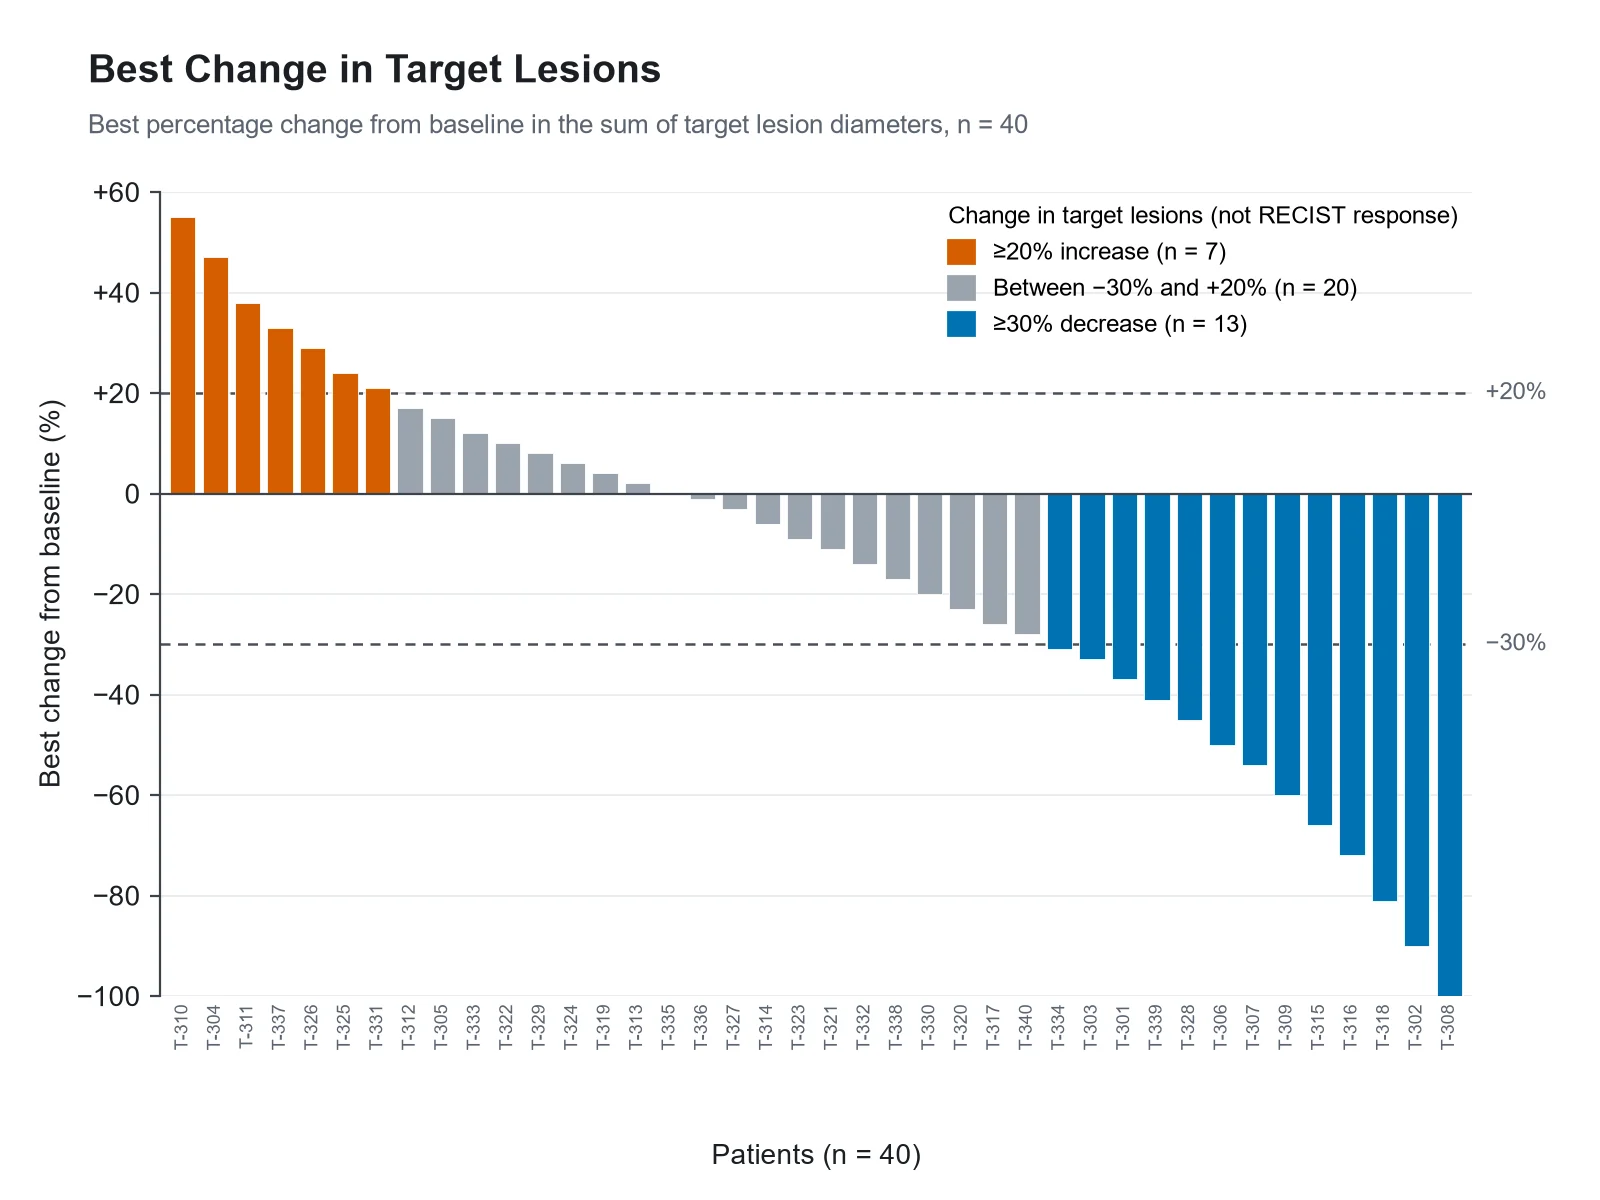
Each example was drawn from a sample dataset: a single-arm phase 2 cohort, a biomarker-stratified cohort with a capped bar, a two-arm comparison, a plot without a response column, a mouse xenograft study, and a cumulative waterfall chart.
Prompt
Based on the uploaded phase2_best_response.csv file, create an oncology waterfall plot of the best percentage change from baseline in the sum of target lesion diameters for 30 patients, sorted from largest increase to largest decrease. Color bars by best overall response (PD, SD, PR, CR), add dashed reference lines at +20% and −30%, and print the objective response count with its denominator in the legend.
Tumor Response Waterfall Plot
Prompt
Based on the uploaded biomarker_cohort.csv file, create a waterfall plot colored by best overall response with a biomarker status strip (positive or negative) under each bar. Cap bars at +100% and print the true value above any capped bar.
Waterfall Plot by Biomarker Status
Prompt
Based on the uploaded randomized_two_arm.csv file, create two waterfall panels side by side, one per treatment arm, on the same y-axis from −100% to +80%. Color bars by best overall response and print n under each panel title.
Two-Arm Waterfall Plot
Prompt
Based on the uploaded target_lesion_change.csv file, create a waterfall plot of best change in target lesions for 40 patients. There is no response column, so color bars by change band (≥20% increase, between −30% and +20%, ≥30% decrease) and say in the legend that bands are not RECIST responses.
Waterfall Plot Without a Response Column
Prompt
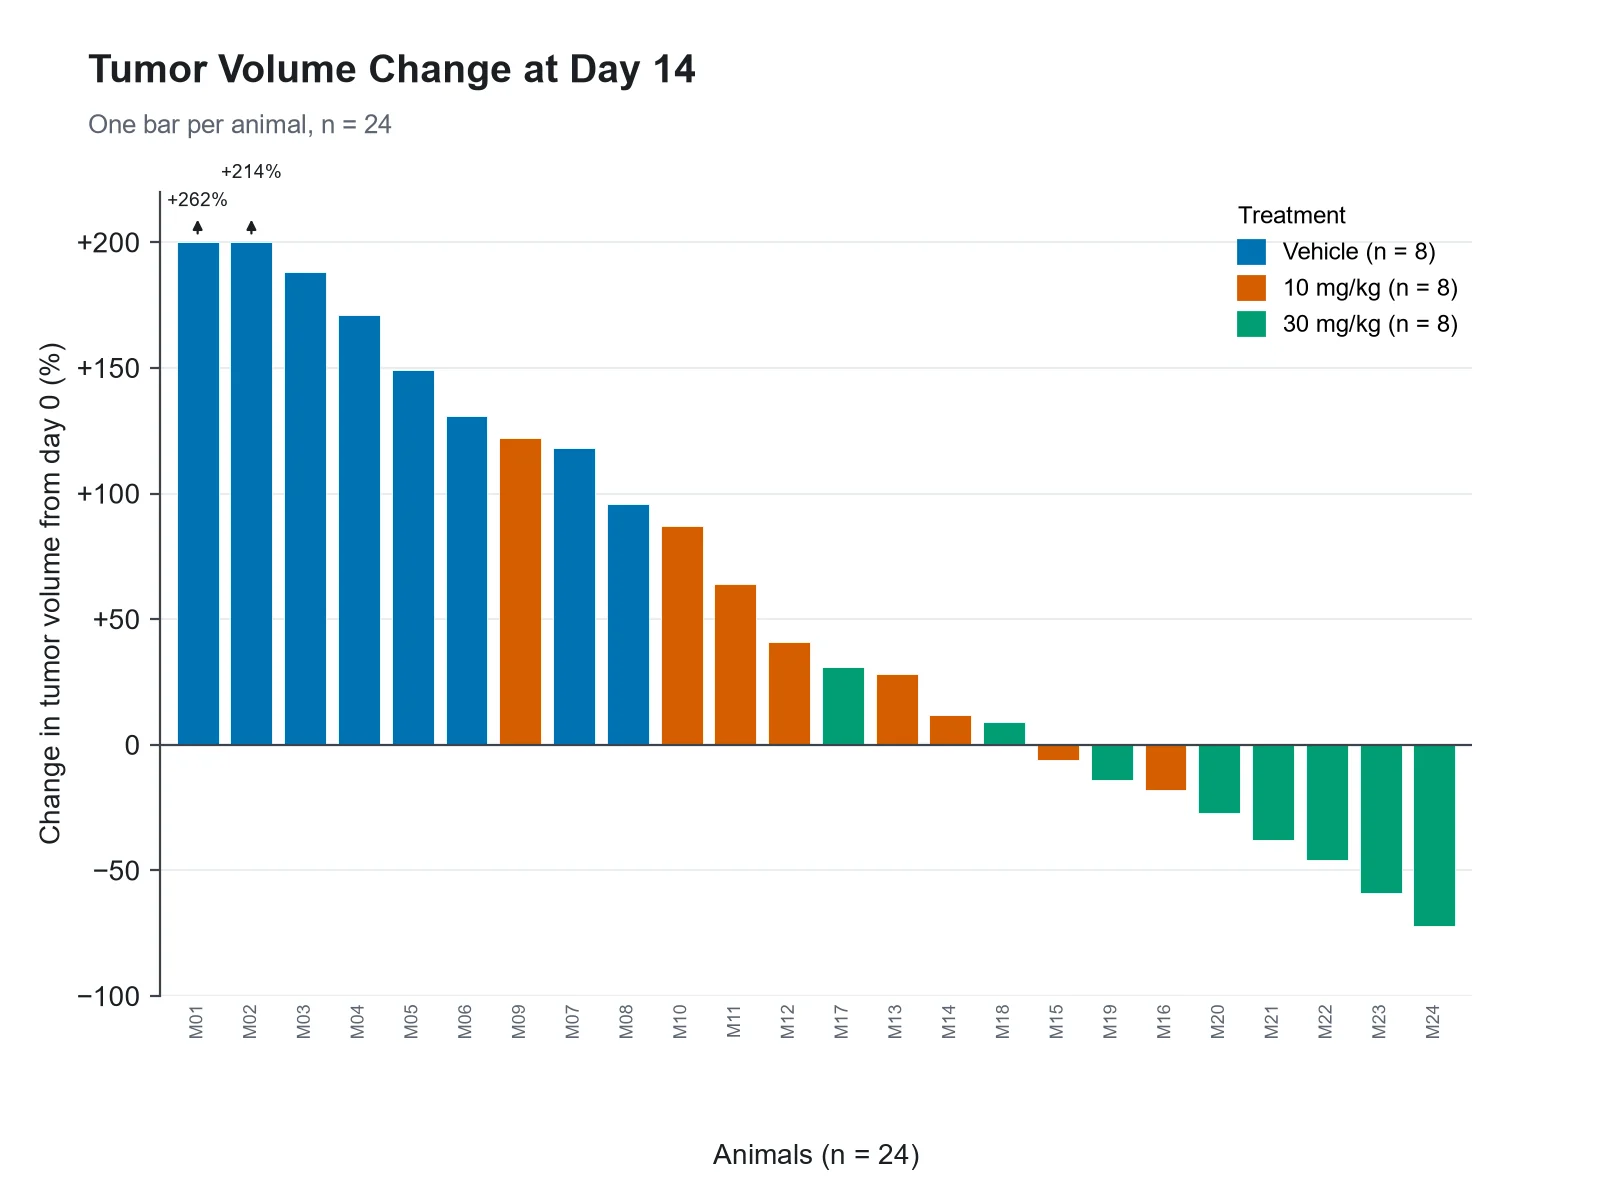
Based on the uploaded xenograft_day14_volume.csv file, create a waterfall plot of percentage change in tumor volume from day 0 to day 14 for each mouse, colored by treatment group (vehicle, 10 mg/kg, 30 mg/kg). Cap bars at +200% and mark capped bars. No RECIST lines.
Mouse Xenograft Tumor Volume Waterfall
Prompt
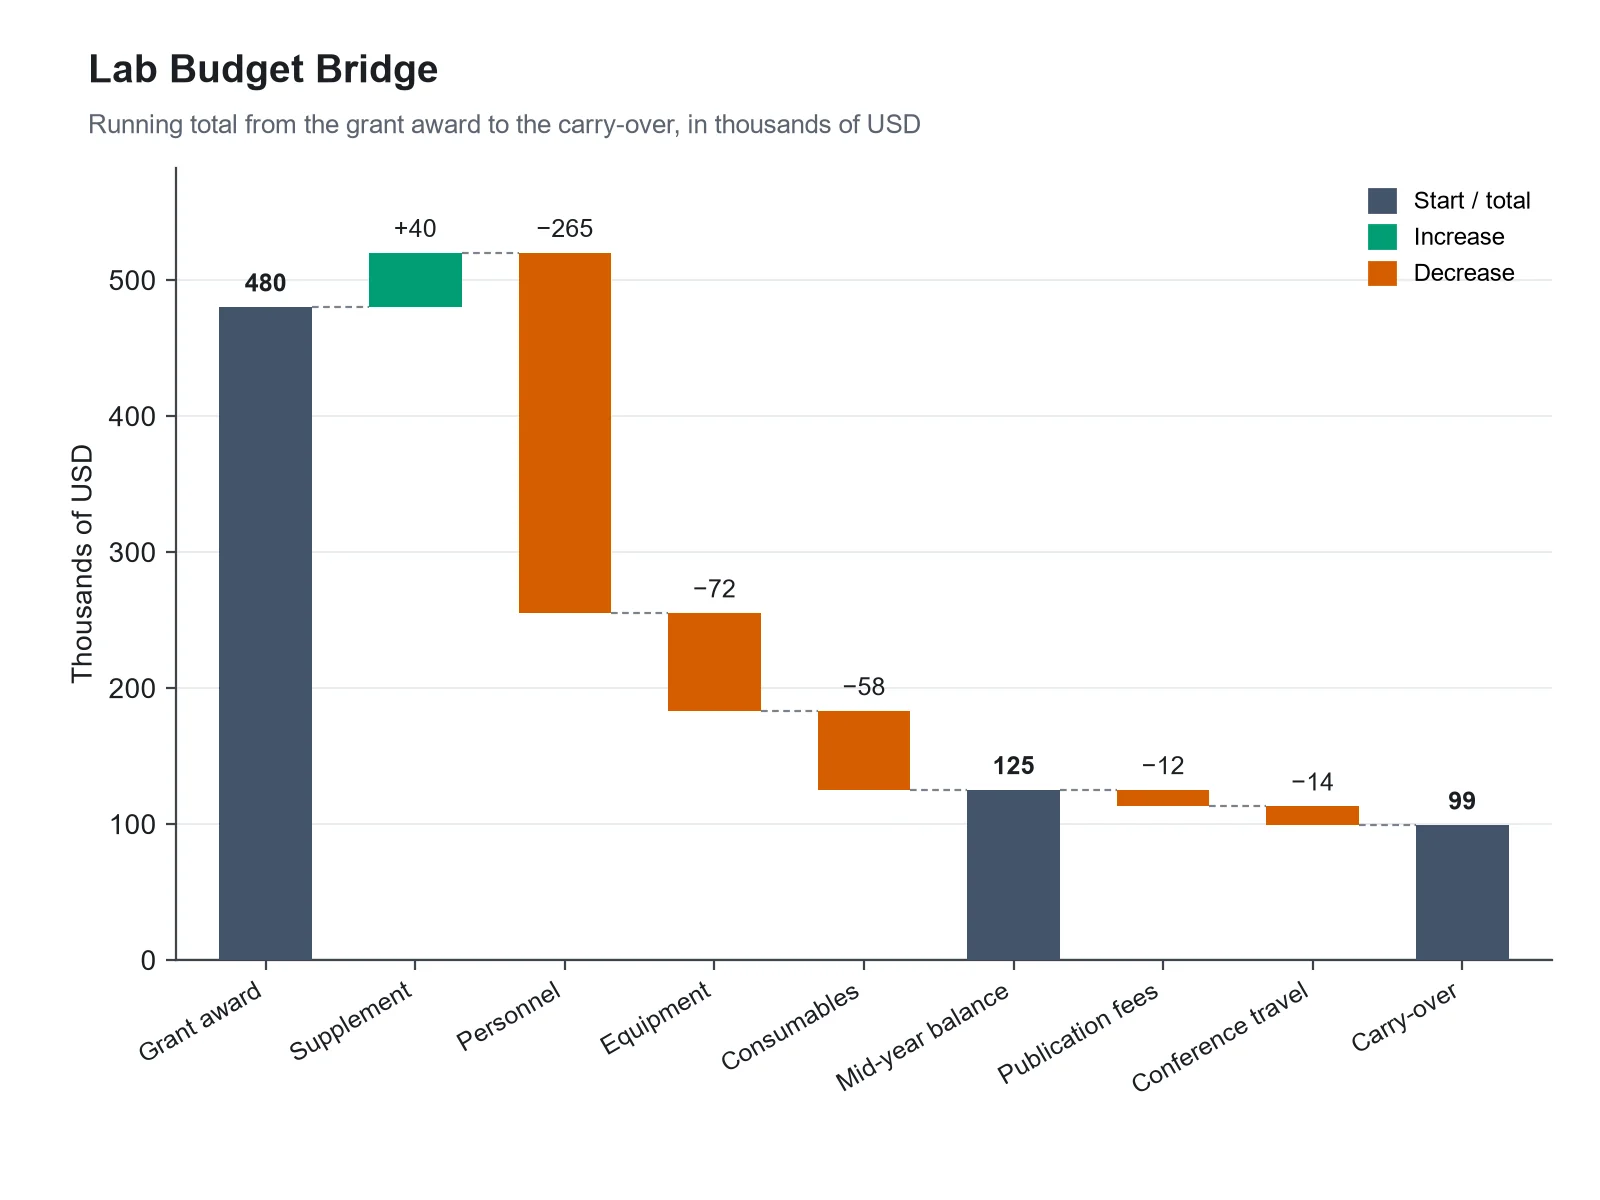
Based on the uploaded lab_budget_bridge.csv file, create a cumulative (bridge) waterfall chart in thousands of USD: the grant award as a starting bar, increases in green, decreases in red, a mid-year subtotal, and the carry-over total, with value labels and thin connector lines between bars.
Cumulative Waterfall Chart
How to make a waterfall plot
1
Upload one row per patient
Add a CSV, TSV, or Excel file with a patient ID and the best percentage change from baseline. A best overall response column (CR, PR, SD, PD) and a cohort column are optional.
2
Describe the figure
Choose colors, reference lines, a bar cap such as +100%, an annotation strip, or side-by-side arms. Rows with start, change, and total types make a cumulative waterfall chart.
3
Generate, review & download
SciFigure sorts and checks every bar, counts responses with their denominators, draws the plot, and lets you download a PNG for a paper, poster, or slide.
Waterfall plot key facts
One bar per
Patient (or animal), sorted largest increase to largest decrease
Y-axis
Best % change from baseline in the sum of target lesion diameters
Partial response line
−30%, measured from baseline
Progression line
+20%, measured from the nadir, plus a 5 mm absolute increase
Lowest possible bar
−100% (all target lesions gone)
Response criteria
RECIST 1.1 (Eisenhauer et al., 2009)
What is a waterfall plot?
A waterfall plot in oncology is a bar chart with one vertical bar per patient. Each bar shows that patient’s best percentage change in tumor size from baseline, usually the change in the sum of the longest diameters of the target lesions measured under RECIST 1.1. Bars are sorted from the largest increase on the left to the largest decrease on the right, so tumor growth sits above the zero line and shrinkage hangs below it, and the falling profile gives the plot its name. Colors usually show each patient’s best overall response, and dashed lines at −30% and +20% mark the RECIST thresholds for partial response and progression. A waterfall plot shows depth of response for every patient at once, which a single response rate hides.
How to read a waterfall plot
Each bar is one patient. Its height is the best (most negative) percentage change from baseline seen at any assessment, not the change at a fixed time.
Bars below zero are patients whose target lesions shrank. A bar at −100% means every target lesion disappeared.
The −30% line marks the size threshold for a RECIST partial response. The share of bars below it is a quick visual check, but the response rate must come from the confirmed best overall response, not from counting bars.
The +20% line is a visual guide. RECIST progression is measured from the smallest sum on study (the nadir), not from baseline, and also needs a 5 mm absolute increase, so a bar can stay below +20% from baseline while the patient progressed.
Colors carry information the bar height cannot: a bar below −30% can be stable disease (an unconfirmed response), and a bar below zero can be progressive disease (a new lesion or non-target progression).
A waterfall plot shows depth of response, not durability. Pair it with a Kaplan-Meier curve of progression-free survival or a swimmer plot of time on treatment.
Complete response (CR): all target lesions have disappeared, and any pathological lymph node has shrunk to under 10 mm in short axis. Because nodes are still measured, a CR bar can sit slightly above −100%.
Partial response (PR): at least a 30% decrease in the sum of target lesion diameters, taking the baseline sum as reference.
Progressive disease (PD): at least a 20% increase in the sum of diameters, taking the smallest sum on study as reference, with an absolute increase of at least 5 mm. One or more new lesions also count as progression.
Stable disease (SD): neither enough shrinkage for PR nor enough growth for PD, taking the smallest sum on study as reference.
In single-arm trials where response is the primary endpoint, CR and PR must be confirmed by a repeat assessment, normally at least 4 weeks later. An unconfirmed response is reported as SD.
Immunotherapy trials may use iRECIST, which adds unconfirmed and confirmed progression categories (iUPD, iCPD) because tumors can grow before they shrink.
What does this waterfall plot generator calculate?
The generator reads your best percentage change column, rejects values below −100% (a tumor cannot shrink by more than all of its size), and sorts the bars. If you map a best overall response column, it normalizes CR, PR, SD, PD and NE in any spelling, counts each category, and reports the objective response (CR + PR) and disease control (CR + PR + SD) counts with the denominator printed, using only the responses in your file. It flags any PR or CR bar above −30%, which RECIST cannot produce, and notes PD bars with shrinkage and SD bars below −30%, which RECIST allows. Without a response column, bars are colored by change band and the figure says the bands are not RECIST responses. Bars can be capped (for example at +100%) with the true value printed above them. The image model then draws these exact bars; it does not run statistical tests or add p-values.
Waterfall chart for budgets, energy balances, and other running totals
The same name is used for a different chart: the cumulative, or bridge, waterfall chart from finance. It starts from an opening value, adds increases and subtracts decreases as floating bars, and ends at a total, so each bar starts where the previous one ended. Add a step type column with start, change, subtotal and total values and the generator switches to this mode: it computes the running total, places each floating bar, recomputes every subtotal and total, and warns you when a total in your file does not match the sum of its steps. In research it suits a grant budget, an energy or mass balance, a carbon budget, or a decomposition of a change into its parts.
Tumor response: one row per patient with an ID and a best percentage change column (values such as −42, 18 or −100; a % sign is fine). Optional: best overall response (CR, PR, SD, PD, NE or the full words) and a cohort, arm, dose level or biomarker column.
Compute best percentage change as (smallest post-baseline sum − baseline sum) / baseline sum × 100 for each patient before uploading. CDISC ADaM datasets usually hold it as PCHG in an ADTR-style dataset.
Patients without a post-baseline scan have no bar. Leave them out of the file and report how many there were in the caption.
Preclinical studies work the same way: percentage change in tumor volume per animal, with the treatment group in the response column so bars are colored by group.
Cumulative waterfall chart: one row per step with a label, an amount, and a type (start, change, subtotal, total). Leave the amount empty on subtotal and total rows; the generator fills them in.
How to report a waterfall plot in a paper
State the measure on the y-axis in full: best percentage change from baseline in the sum of target lesion diameters.
Give the number of patients plotted and the number left out for having no post-baseline assessment.
Say who assessed response (investigator or blinded independent central review), which criteria (RECIST 1.1, iRECIST, mRECIST), and whether responses were confirmed.
Explain colors that do not match bar height, for example a footnote marking PD due to new lesions.
Keep the y-axis honest: if you cap bars, mark the capped bars and give their true values.
Oncology papers often show the same patients three ways. Each plot answers a different question.
Waterfall plot
Swimmer plot
Spider plot
What one patient looks like
One vertical bar
One horizontal bar along a time axis
One line over time
What it shows
Depth of best response
Duration of treatment and response, with events marked
How tumor size changes at each assessment
Y-axis
Best % change from baseline
Patients
% change from baseline
X-axis
Patients, sorted by change
Time on study
Time since baseline
Best for
Depth of response across a cohort at a glance
Durability, ongoing responders, dose changes
Early versus late response, regrowth
Main limitation
Hides timing and durability
Hides depth of response
Gets cluttered beyond 20 to 30 patients
Common waterfall plot mistakes
These are the errors reviewers and readers catch most often.
MistakeCorrect
MistakeCounting bars below −30% and calling it the objective response rate.
CorrectReport the response rate from confirmed best overall response. Some bars below −30% are unconfirmed responses (SD), and the plot leaves out patients without a post-baseline scan.
MistakeColoring bars by height alone and labeling the colors CR, PR, SD and PD.
CorrectTake colors from the assessed response. If you only have the size change, label the bands as change bands, not RECIST categories.
MistakeReading the +20% line as the boundary for progression.
CorrectProgression is measured from the nadir and needs a 5 mm increase or a new lesion, so a PD bar can sit below +20% or even below zero.
MistakeLetting one +250% bar squash every other bar into a thin strip.
CorrectCap the axis (for example at +100%), mark the capped bars, and print their true values.
MistakeLeaving non-evaluable patients out without saying so.
CorrectGive the number plotted and the number excluded in the caption, so readers can judge the denominator.
MistakeUsing a waterfall plot to show that responses last.
CorrectShow durability with a Kaplan-Meier curve or a swimmer plot; a waterfall plot only shows the best change.
Waterfall Plot Generator FAQ
What is a waterfall plot in oncology?
It is a bar chart with one bar per patient showing the best percentage change in tumor size from baseline, sorted from the largest increase to the largest decrease. It is used in clinical trial papers to show how deeply each patient responded, usually with bars colored by best overall response and reference lines at −30% and +20%.
What do the −30% and +20% lines on a waterfall plot mean?
They come from RECIST 1.1. A decrease of at least 30% in the sum of target lesion diameters from baseline meets the size criterion for partial response. An increase of at least 20% meets the size criterion for progression, but RECIST measures that increase from the smallest sum on study and also requires a 5 mm absolute increase, so the +20% line drawn from baseline is only a guide.
Why is a bar below −30% colored as stable disease?
Usually because the response was not confirmed: in single-arm trials a partial response must be seen again at a later scan, normally at least 4 weeks on. It can also happen when non-target disease progressed. The bar shows the best size change; the color shows the assessed response.
Why does a progressive disease bar go below zero?
Because progression under RECIST also includes new lesions and unequivocal progression of non-target disease, and because growth is measured from the nadir, not from baseline. A patient whose target lesions shrank by 12% but who developed a new liver lesion is PD, and the bar still sits at −12%.
What columns does the waterfall plot generator need?
One numeric column with the best percentage change per patient is required. A patient ID column labels the bars. A best overall response column (CR, PR, SD, PD, NE) colors them, and a cohort, arm, dose or biomarker column adds a strip under the bars or splits the plot into panels.
Does the generator calculate the response rate?
Only from your response column. It counts CR, PR, SD, PD and NE as listed and reports objective response (CR + PR) and disease control (CR + PR + SD) with the denominator printed. It never derives a response rate from bar heights and does not add p-values or confidence intervals.
Can a value be lower than −100%?
No. −100% means the target lesions disappeared completely, so anything lower is a data error. The generator stops and lists those rows.
How do I stop one very large bar from dominating the plot?
Write "cap at 100%" (or another value) in your instructions. Capped bars are drawn to the cap with a marker, and their true values are printed so nothing is hidden.
Can I color by biomarker, dose level, or treatment arm?
Yes. Map that column as the cohort column to get an annotation strip under the bars, or ask for side-by-side panels per arm. For preclinical data, put the treatment group in the response column to color the bars by group.
Can I make a financial or cumulative waterfall chart?
Yes. Upload one row per step with a label, an amount, and a type column (start, change, subtotal, total), or describe a budget or bridge chart in your instructions. The generator computes the running total, places the floating bars, recalculates subtotals and totals, and draws increases and decreases in different colors.
What is the difference between a waterfall plot, a swimmer plot, and a spider plot?
A waterfall plot shows each patient’s best change in tumor size as one bar. A swimmer plot shows each patient as a horizontal bar along time, for treatment and response duration. A spider plot draws each patient’s tumor size change as a line over time. Waterfall plots answer how much tumors shrank; the other two answer when and for how long.
Can I use the waterfall plot in a manuscript?
Yes. Check the bars against your source data, state the criteria, assessor, confirmation rule and number of patients excluded in the caption, and mark any capped bars before submission.