Krebs Cycle Diagram AI

Labeled Krebs Cycle Diagram Generator

Create labeled Krebs cycle diagrams — the citric acid cycle, also called the TCA cycle — for biology lessons, worksheets, revision sheets, and lab reports. Describe the intermediates, enzymes, or worksheet layout you need, then generate a clean cycle figure.

All eight steps in order3 NADH, 1 FADH2, 1 GTP per turnWorksheet-ready layout

AI Krebs Cycle Diagram Generator

Describe the intermediates, enzymes, yields, and diagram style you need.

Costs 5 credits678 / 2000 characters

Generate a publication-ready PNG from your description.

Preview

Krebs Cycle Diagram Example Previews

Target aspect ratio: 4:3

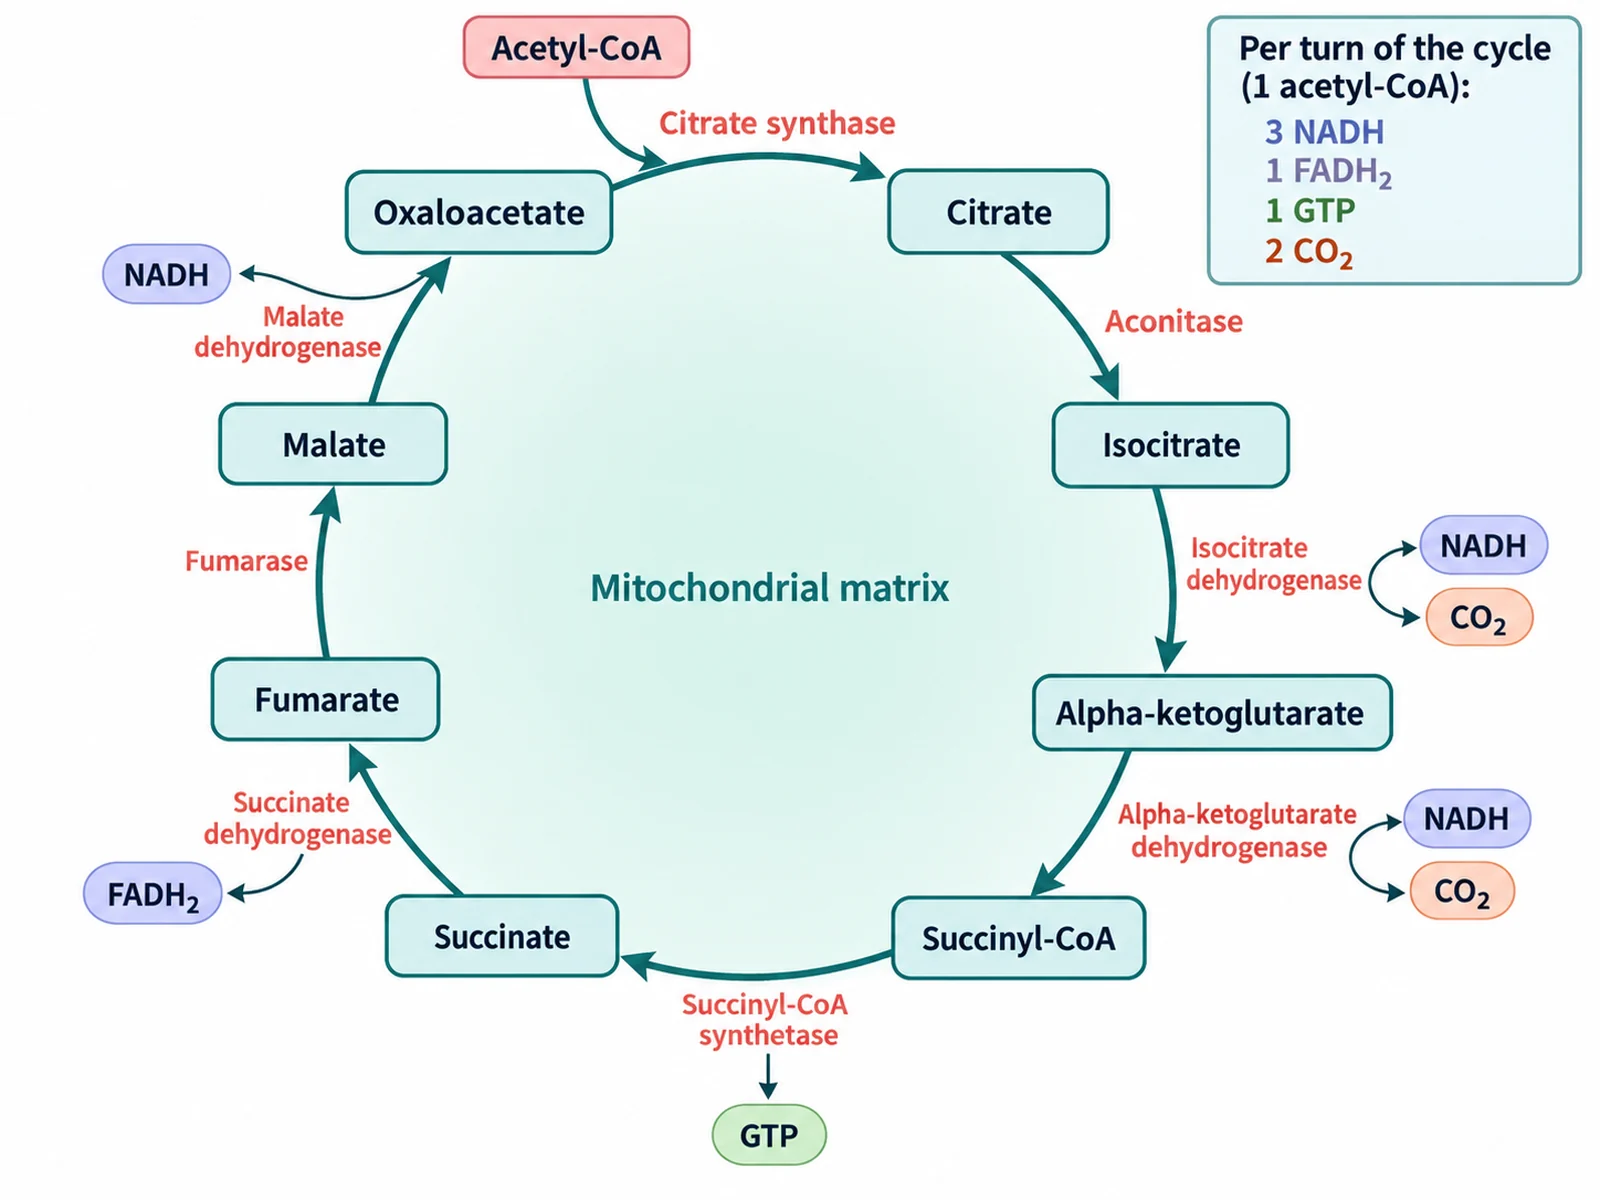
Labeled Krebs cycle diagram showing citrate, isocitrate, alpha-ketoglutarate, succinyl-CoA, succinate, fumarate, malate, and oxaloacetate with 3 NADH, 1 FADH2, 1 GTP, and 2 CO2 released per turn
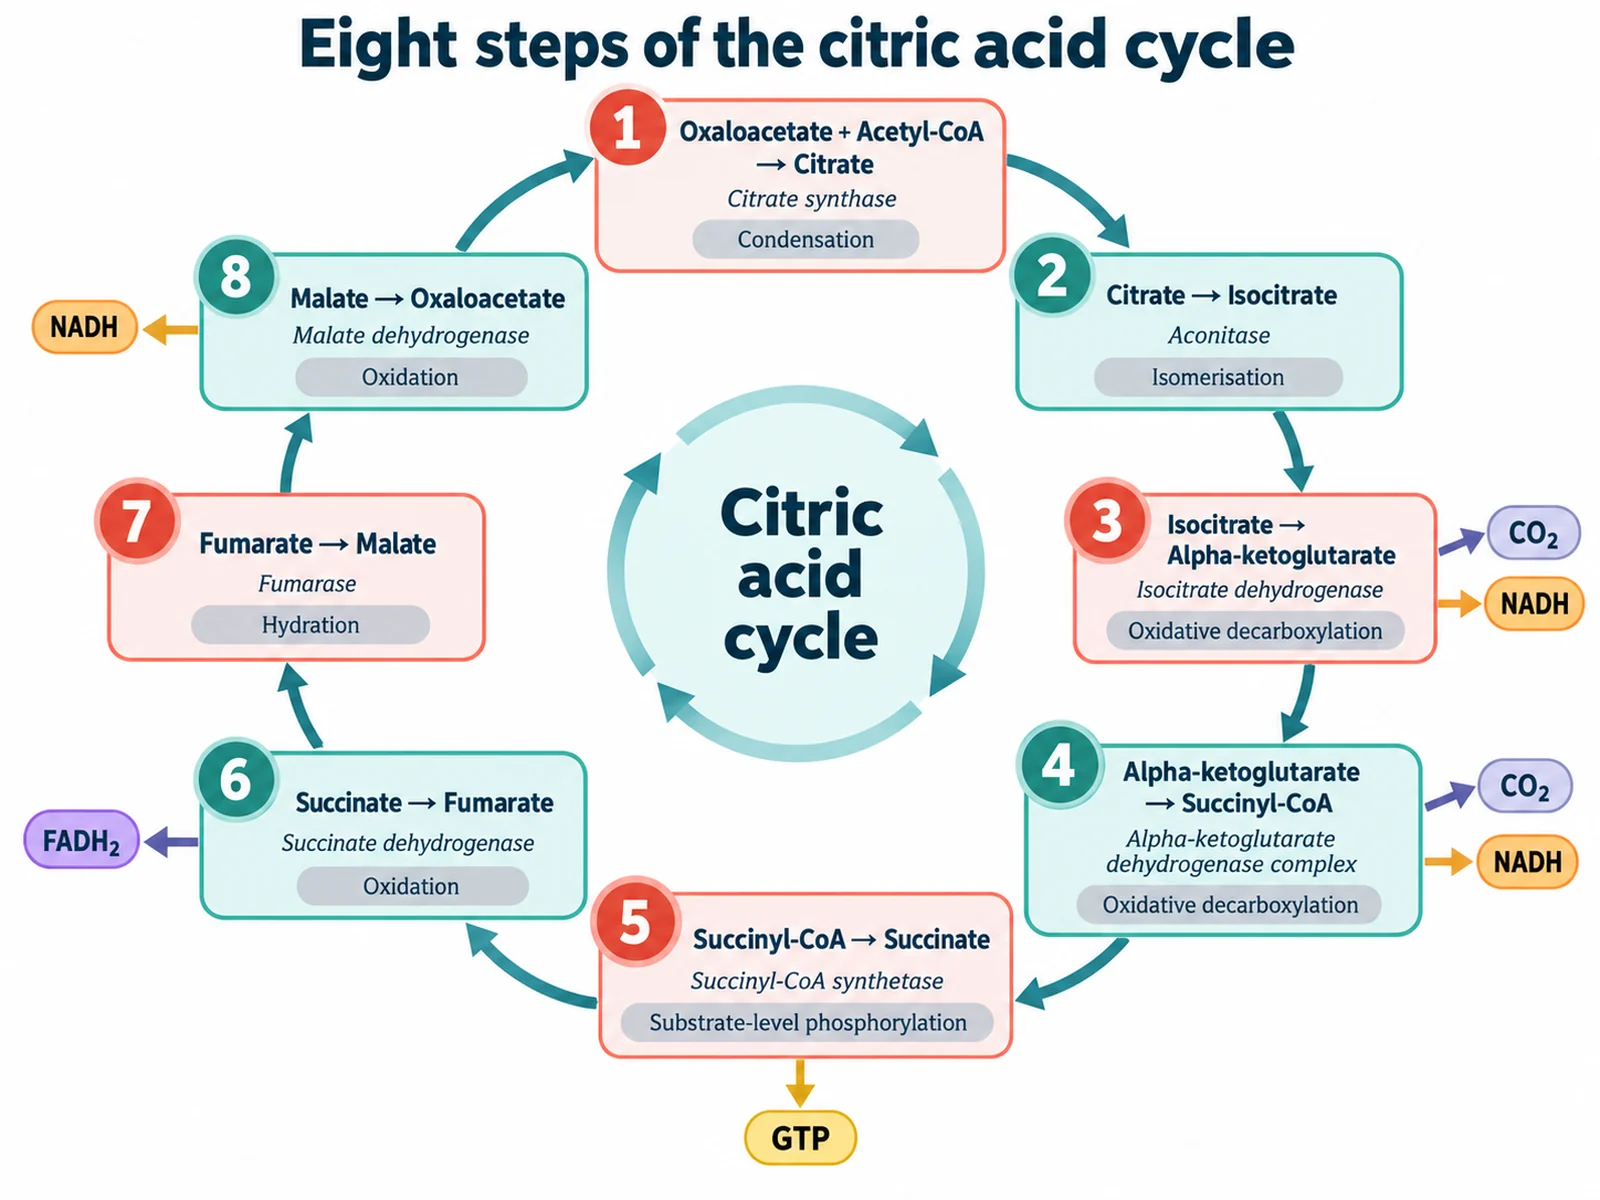
Citric acid cycle steps diagram numbering the eight reactions with their enzymes and reaction types
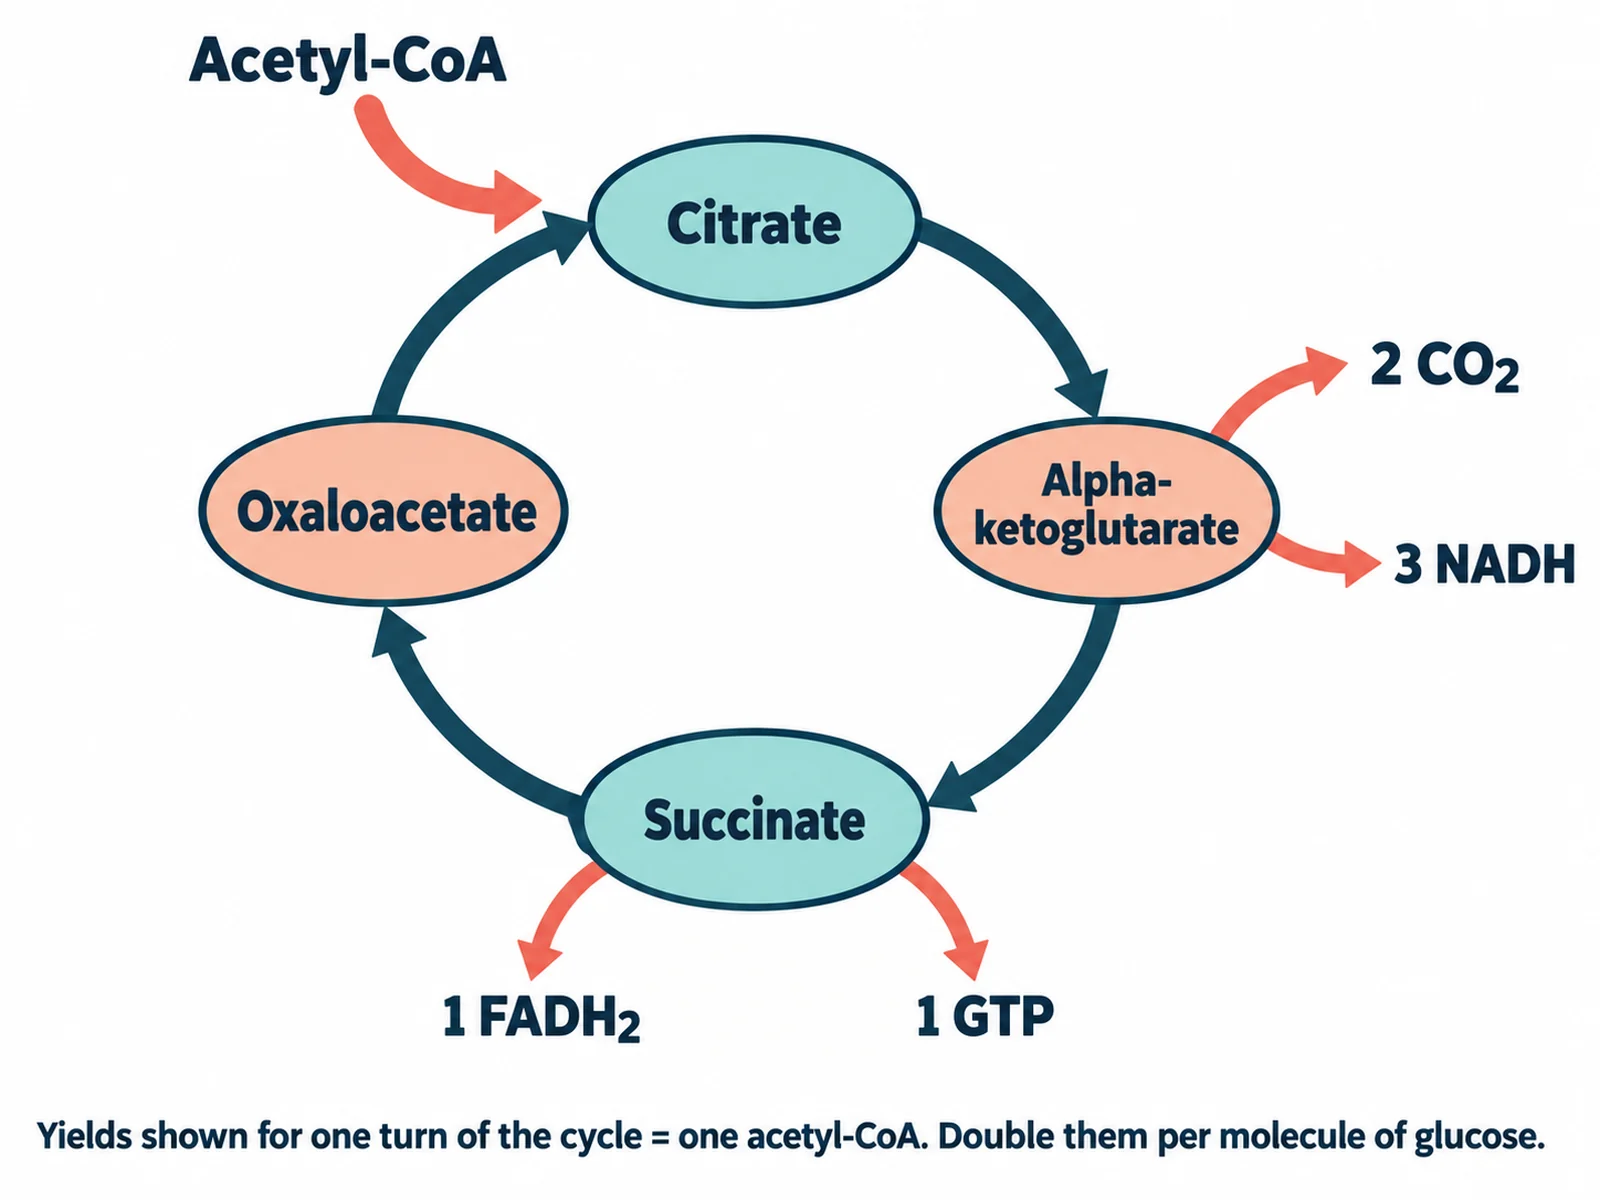
Simplified TCA cycle diagram for introductory classes showing acetyl-CoA entering and CO2, NADH, FADH2, and GTP leaving

Sample previews. Describe your diagram to generate your own Krebs cycle figure.

Labeled Krebs Cycle Diagram Examples

Use these examples as visual directions for the eight steps, enzyme names, electron-carrier yields, mitochondrial location, and blank worksheet layouts.

Labeled Krebs cycle diagram showing citrate, isocitrate, alpha-ketoglutarate, succinyl-CoA, succinate, fumarate, malate, and oxaloacetate with 3 NADH, 1 FADH2, 1 GTP, and 2 CO2 released per turn

Prompt

Create a fully labeled Krebs cycle diagram on a white background. Arrange eight intermediates clockwise around a circle in this exact order: citrate at the top, then isocitrate, alpha-ketoglutarate, succinyl-CoA, succinate, fumarate, malate, oxaloacetate, and close the loop back to citrate. Show acetyl-CoA entering at oxaloacetate with the enzyme citrate synthase on that arrow. Name the enzyme on every arrow: aconitase, isocitrate dehydrogenase, alpha-ketoglutarate dehydrogenase, succinyl-CoA synthetase, succinate dehydrogenase, fumarase, malate dehydrogenase. Draw small outward arrows for each output: CO2 plus NADH leaving at isocitrate dehydrogenase and again at alpha-ketoglutarate dehydrogenase, GTP leaving at succinyl-CoA synthetase, FADH2 leaving at succinate dehydrogenase, NADH leaving at malate dehydrogenase. Add a boxed summary reading 'Per turn: 3 NADH, 1 FADH2, 1 GTP, 2 CO2'.
Labeled Krebs Cycle

Citric acid cycle steps diagram numbering the eight reactions with their enzymes and reaction types

Prompt

Create a citric acid cycle steps diagram that numbers the eight reactions 1 to 8 around a loop on a white background. Number 1 oxaloacetate plus acetyl-CoA to citrate by citrate synthase, labeled condensation. Number 2 citrate to isocitrate by aconitase, labeled isomerisation. Number 3 isocitrate to alpha-ketoglutarate by isocitrate dehydrogenase, labeled oxidative decarboxylation. Number 4 alpha-ketoglutarate to succinyl-CoA by the alpha-ketoglutarate dehydrogenase complex, labeled oxidative decarboxylation. Number 5 succinyl-CoA to succinate by succinyl-CoA synthetase, labeled substrate-level phosphorylation. Number 6 succinate to fumarate by succinate dehydrogenase, labeled oxidation. Number 7 fumarate to malate by fumarase, labeled hydration. Number 8 malate to oxaloacetate by malate dehydrogenase, labeled oxidation. Keep the step numbers large and the enzyme names in smaller italic text.

Citric Acid Cycle Steps

Simplified TCA cycle diagram for introductory classes showing acetyl-CoA entering and CO2, NADH, FADH2, and GTP leaving

Prompt

Create a simplified TCA cycle diagram for an introductory class on a white background. Draw one thick circular arrow with only four intermediates named around it: citrate, alpha-ketoglutarate, succinate, and oxaloacetate, and show that the loop continues between them with unlabeled arrow segments. Show acetyl-CoA entering the loop at oxaloacetate with a bold inward arrow. Use four clearly separated outward arrows for the outputs, labeled 2 CO2, 3 NADH, 1 FADH2, and 1 GTP, with a caption beneath reading 'Yields shown for one turn of the cycle, which is one acetyl-CoA'. Use bold flat colors, thick outlines, large readable text, and generous white space.

Simple TCA Cycle Diagram

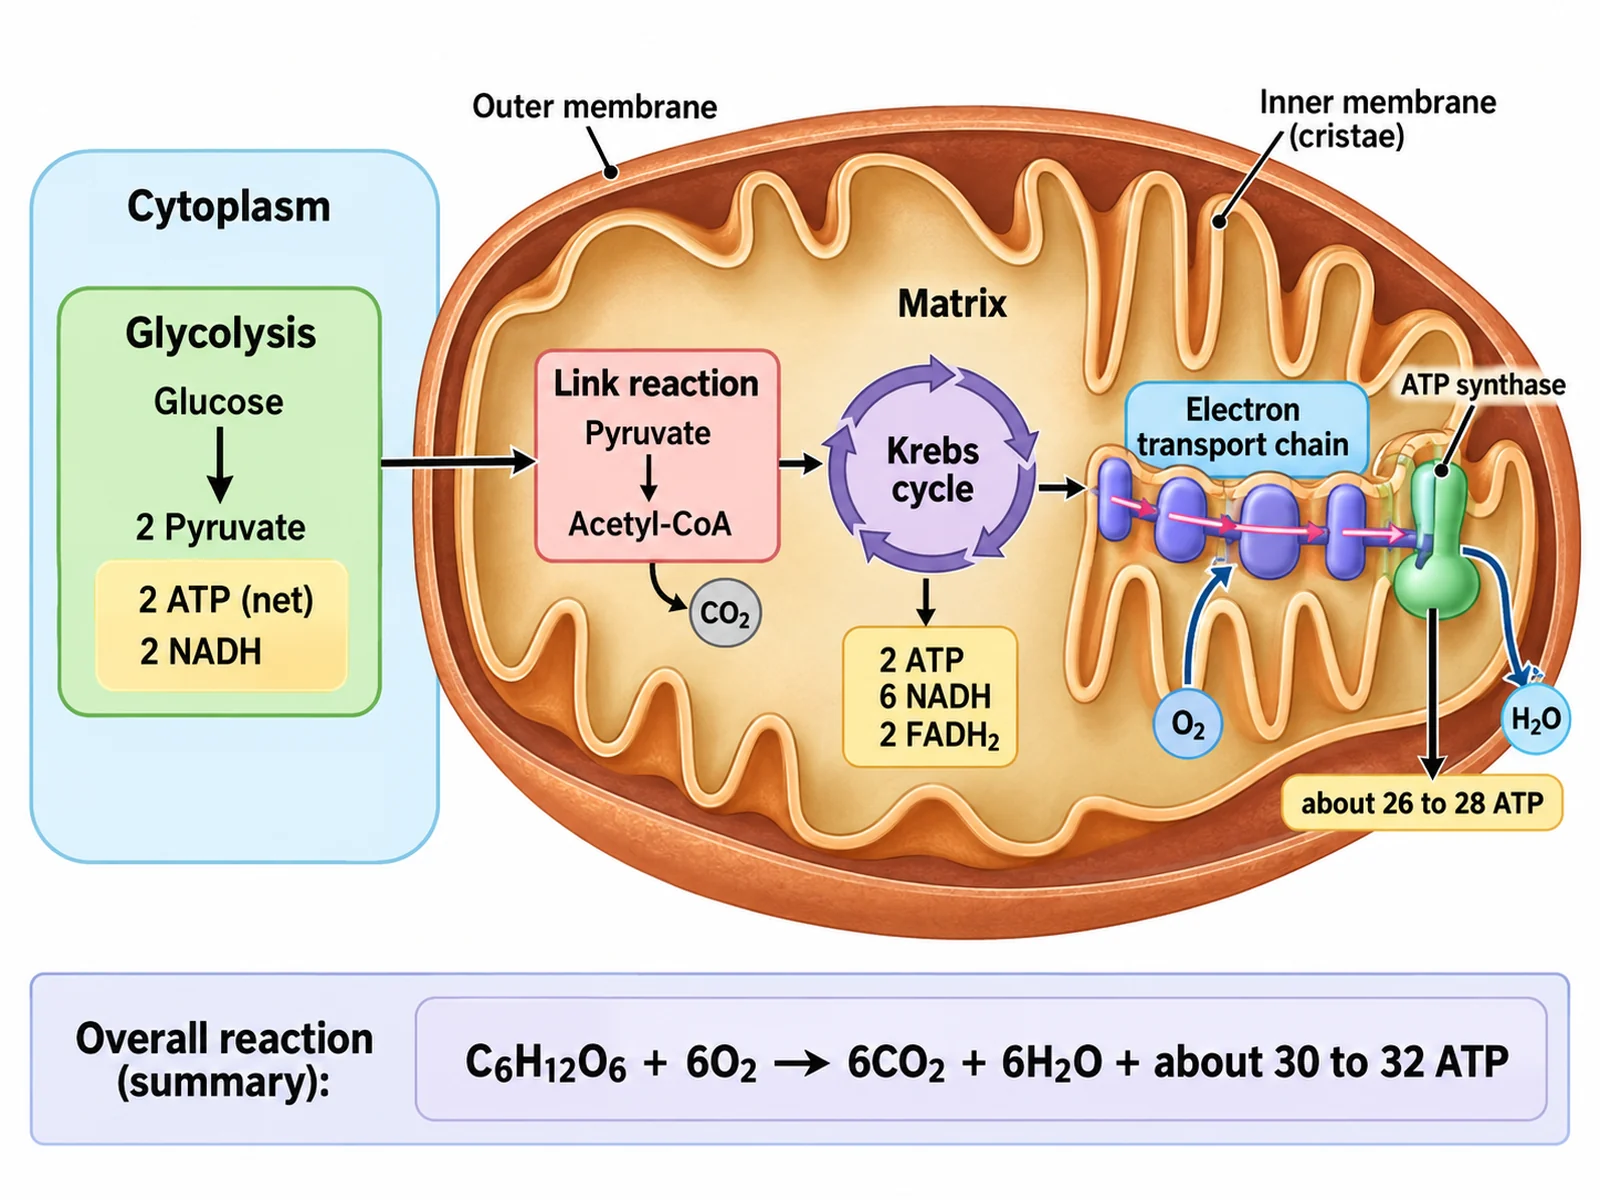
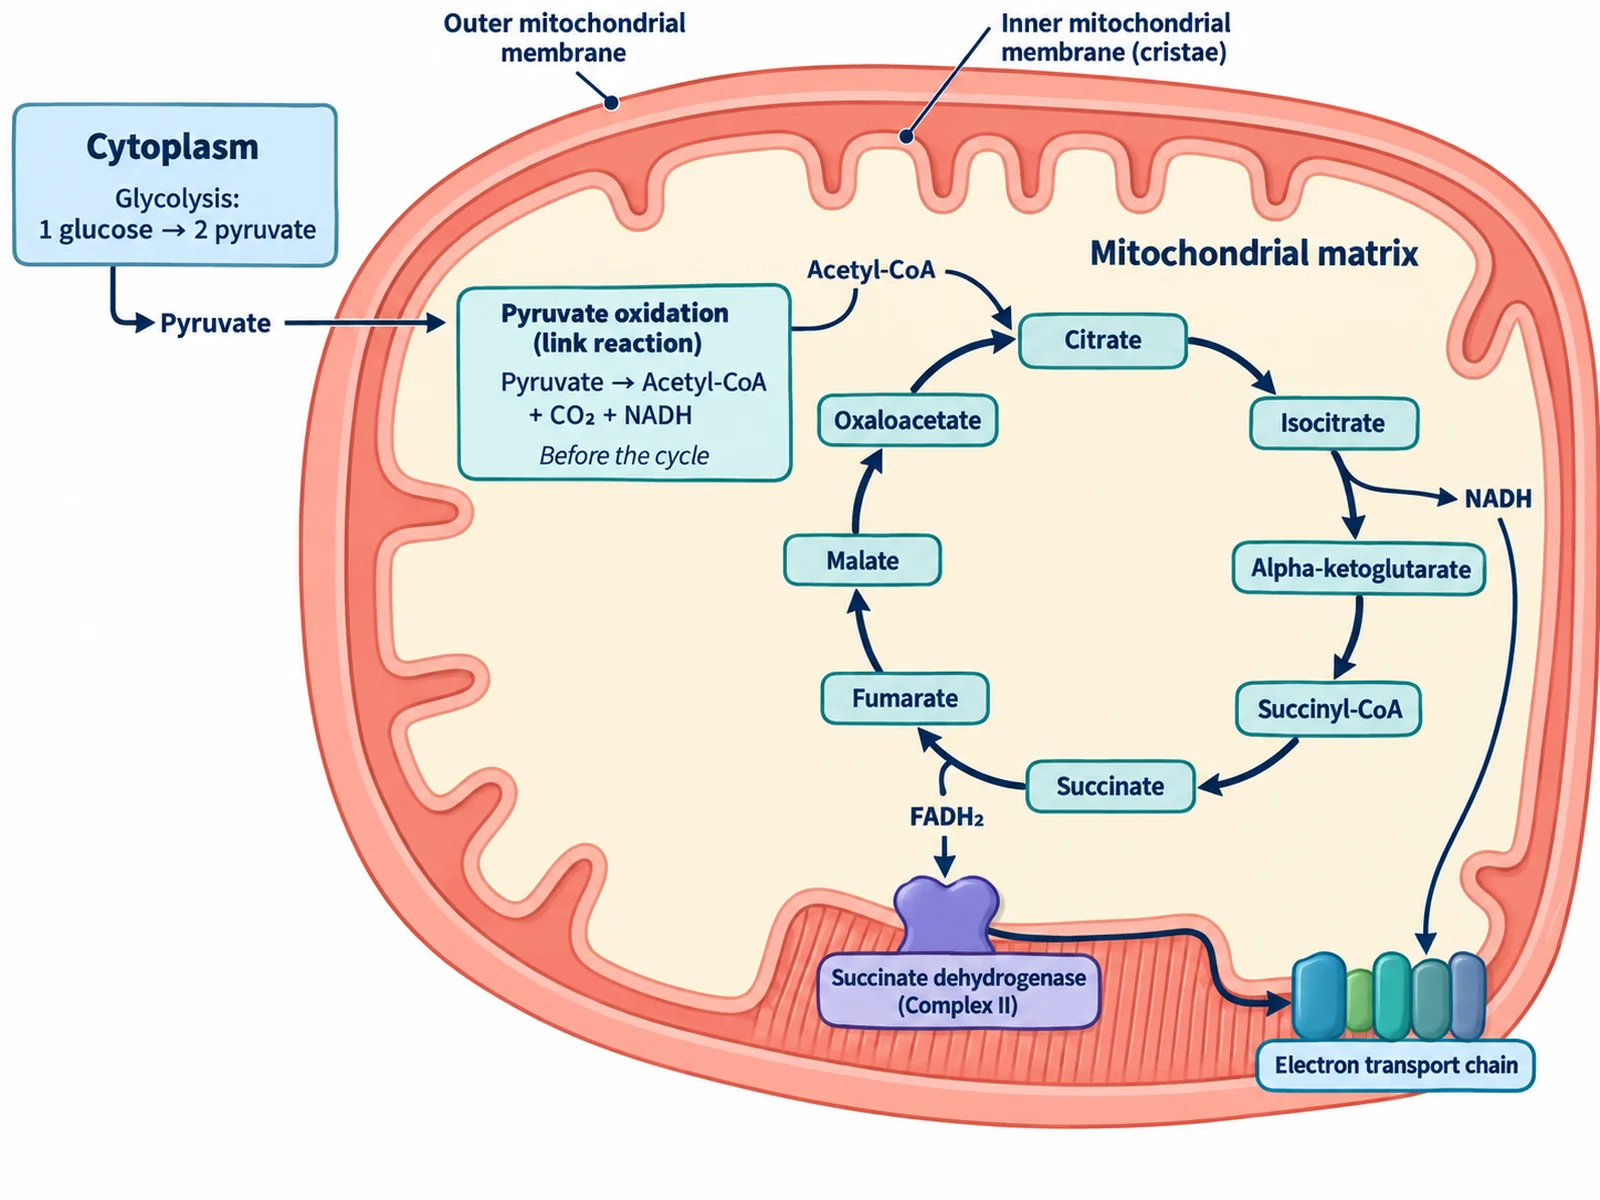
Krebs cycle drawn inside a cut-away mitochondrion with pyruvate oxidation before the cycle and succinate dehydrogenase in the inner membrane

Prompt

Create a diagram that places the Krebs cycle inside a cut-away mitochondrion on a white background. Draw a smooth outer membrane and a folded inner membrane with visible cristae, and shade the enclosed space as the mitochondrial matrix. Outside the mitochondrion, label a small cytoplasm panel with glycolysis producing two pyruvate from one glucose. Draw pyruvate crossing both membranes, then a separate boxed step in the matrix labeled 'Pyruvate oxidation, link reaction, pyruvate dehydrogenase complex: pyruvate to acetyl-CoA plus CO2 plus NADH, not part of the eight cycle steps'. Draw the Krebs cycle as a loop in the matrix with its eight intermediates named in order. Draw succinate dehydrogenase as a protein embedded in the inner membrane, labeled 'the only cycle enzyme in the inner membrane, also Complex II', and show NADH and FADH2 delivering electrons to the electron transport chain along the cristae.

Krebs Cycle in the Mitochondrion

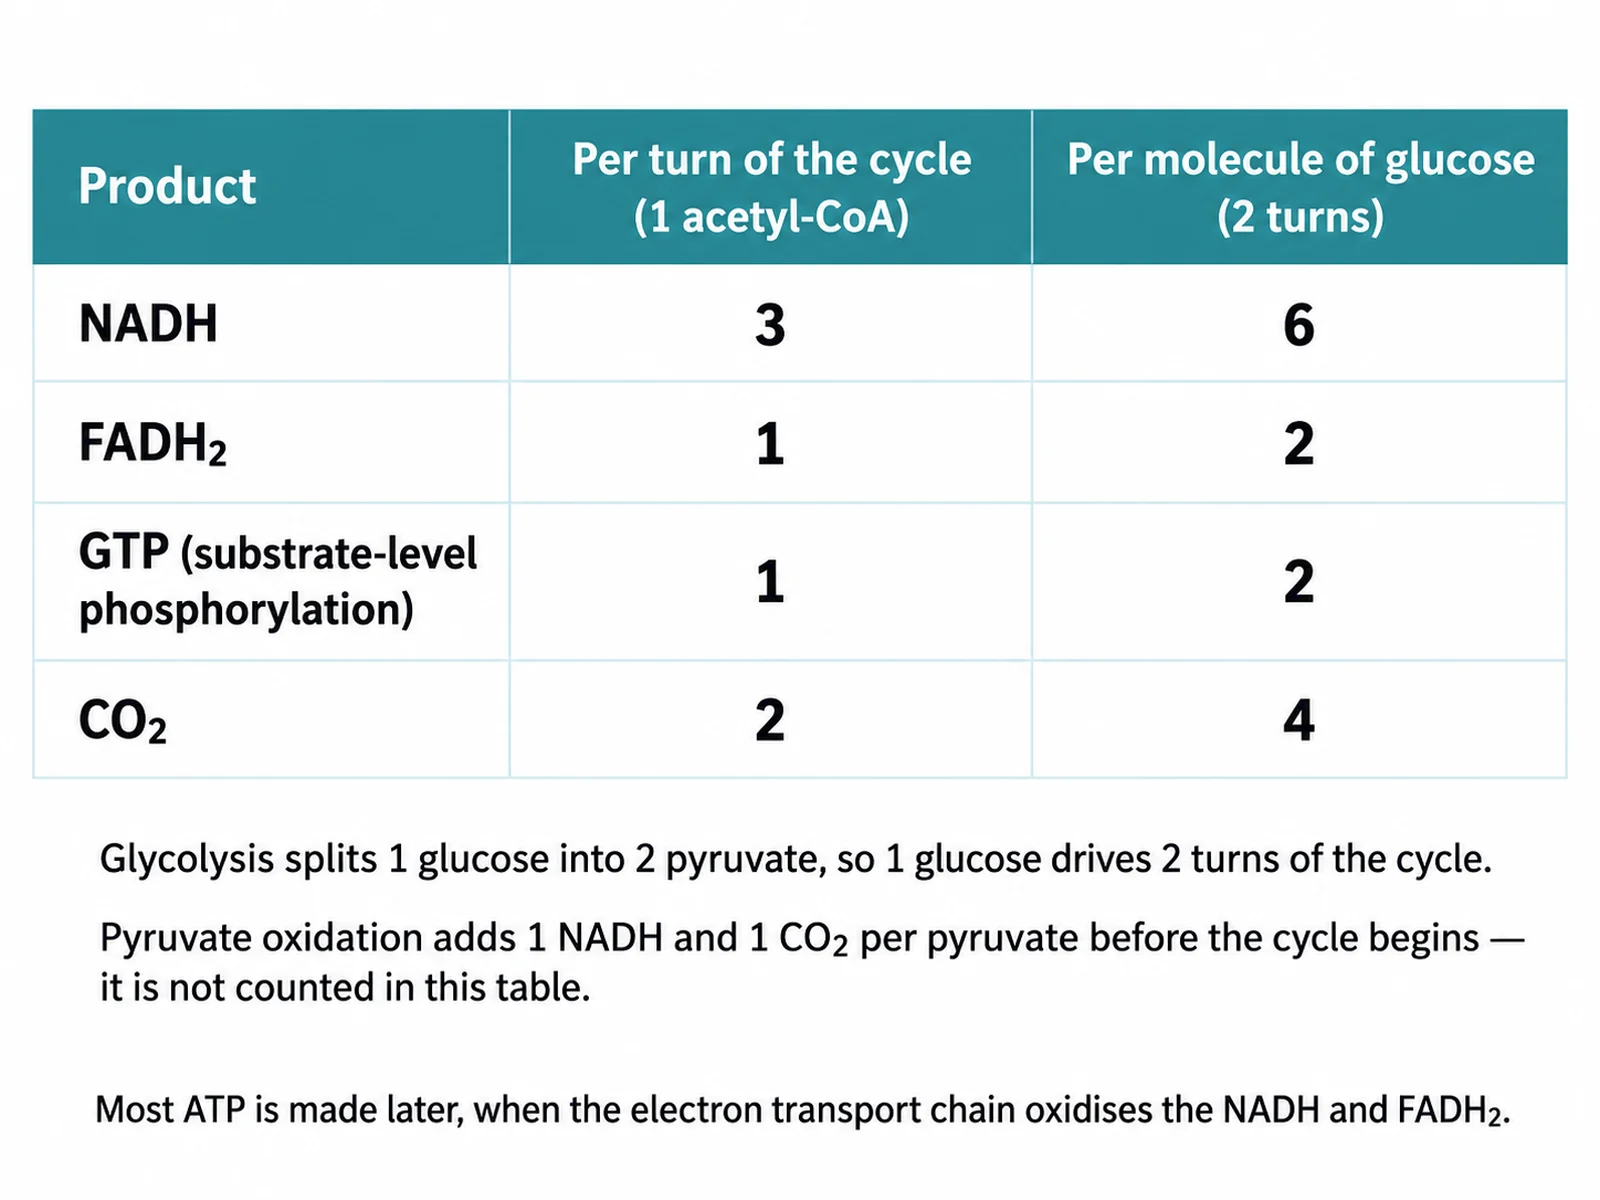
Krebs cycle yield table comparing products per turn of the cycle with products per molecule of glucose

Prompt

Create a Krebs cycle yield comparison figure on a white background. Draw a two-column table with the headers 'Per turn of the cycle, one acetyl-CoA' and 'Per molecule of glucose, two turns'. Fill four labeled rows: NADH reading 3 and 6, FADH2 reading 1 and 2, GTP or ATP by substrate-level phosphorylation reading 1 and 2, CO2 reading 2 and 4. Beneath the table add a short note reading 'Glycolysis splits one glucose into two pyruvate, so one glucose drives two turns' and a second note reading 'Pyruvate oxidation adds 1 NADH and 1 CO2 per pyruvate before the cycle begins'. Keep the typography clean and the numbers large.

Krebs Cycle Yields

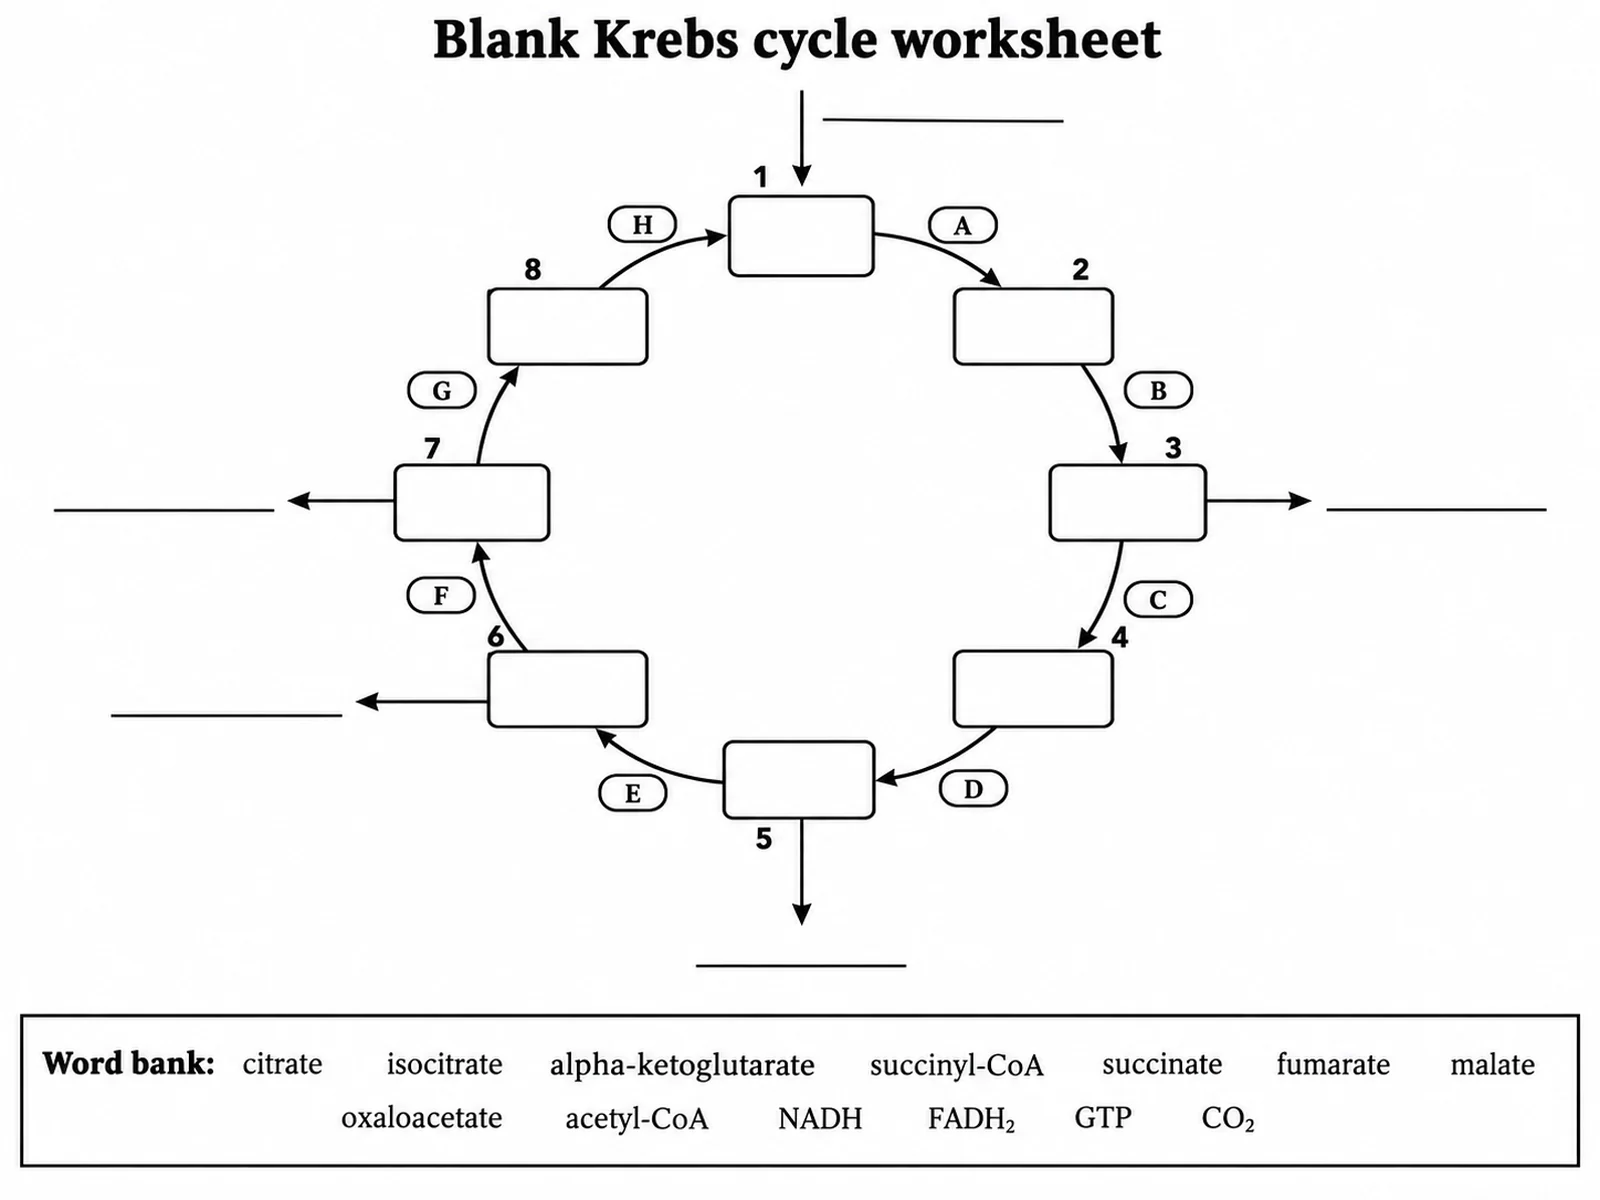
Blank Krebs cycle worksheet with empty boxes for the eight intermediates, empty arrow labels, and a word bank

Prompt

Create a blank Krebs cycle worksheet on a white background. Draw the circular loop with eight empty rounded boxes at the intermediate positions, numbered 1 to 8 clockwise, and nothing written inside them. Put an empty white pill on each connecting arrow for the enzyme name, lettered A to H. Add short empty outward arrows at the output positions with blank lines beside them. Add a word bank box below reading 'citrate, isocitrate, alpha-ketoglutarate, succinyl-CoA, succinate, fumarate, malate, oxaloacetate, acetyl-CoA, NADH, FADH2, GTP, CO2'. Leave generous white space and include no answer key.

Blank Krebs Cycle Worksheet

How to make a Krebs cycle diagram

1

Describe the cycle

Say which intermediates and enzymes you want named, whether the yields should be written per turn or per glucose, and whether you need a full figure or a blank worksheet.

2

Generate the diagram

Create a clean loop with the eight intermediates in order, enzymes on the arrows, and outward arrows for CO2, NADH, FADH2, and GTP.

3

Check the chemistry

Confirm the intermediate order, confirm that FADH2 appears only at succinate dehydrogenase, and confirm the yield basis before you download the figure for slides, worksheets, or reports.

What is the Krebs cycle?

The Krebs cycle is the eight-reaction loop that fully oxidises the acetyl group of acetyl-CoA to carbon dioxide while loading electrons onto NAD+ and FAD. It is also called the citric acid cycle, after citrate, its first intermediate, and the TCA or tricarboxylic acid cycle, after the class of molecule citrate belongs to. Hans Krebs pieced the pathway together in 1937. In eukaryotes every step runs in the mitochondrial matrix; in bacteria the same reactions run in the cytoplasm. A good Krebs cycle diagram names the intermediates in order, names the enzyme on each arrow, and shows exactly where each CO2, NADH, FADH2, and GTP leaves the loop.

Why use a Krebs cycle diagram generator

  • Draw all eight steps in the correct order without redrawing the loop by hand for every handout.
  • Keep intermediate names, enzyme names, and electron-carrier labels consistent across a whole worksheet set.
  • Produce a per-turn figure and a per-glucose figure whose numbers agree with each other.
  • Draft lesson slides, revision sheets, posters, and lab report figures from one focused prompt.

The eight steps of the Krebs cycle

  • Step 1, citrate synthase: acetyl-CoA condenses with oxaloacetate and water to form citrate, releasing coenzyme A.
  • Step 2, aconitase: citrate is rearranged into isocitrate, moving the hydroxyl group to a carbon that can be oxidised.
  • Step 3, isocitrate dehydrogenase: isocitrate is oxidised and decarboxylated to α-ketoglutarate, releasing the first CO2 and the first NADH. This is the rate-limiting step of the cycle.
  • Step 4, α-ketoglutarate dehydrogenase complex: α-ketoglutarate becomes succinyl-CoA, releasing the second CO2 and the second NADH.
  • Step 5, succinyl-CoA synthetase: the energy in the succinyl-CoA thioester bond drives substrate-level phosphorylation, giving succinate and one GTP, which is ATP in plants and many bacteria.
  • Step 6, succinate dehydrogenase: succinate is oxidised to fumarate and FAD is reduced to FADH2. This is the only cycle enzyme embedded in the inner mitochondrial membrane, where it doubles as Complex II of the electron transport chain.
  • Step 7, fumarase: water is added across the double bond of fumarate to give malate.
  • Step 8, malate dehydrogenase: malate is oxidised to oxaloacetate, releasing the third NADH and regenerating the acceptor for the next acetyl-CoA.

What one turn of the cycle produces

  • Per turn of the cycle, which means per acetyl-CoA: 3 NADH, 1 FADH2, 1 GTP, and 2 CO2.
  • Per molecule of glucose: 6 NADH, 2 FADH2, 2 GTP, and 4 CO2, because glycolysis splits one glucose into two pyruvate and each pyruvate feeds one turn.
  • Pyruvate oxidation adds 1 NADH and 1 CO2 for each pyruvate before the cycle begins, so the mitochondrial stages release 6 CO2 per glucose in total.
  • Only one phosphate-transfer event happens inside the cycle itself. Most of the ATP arrives later, when the electron transport chain oxidises the NADH and FADH2 the cycle produced.
  • Write the basis on the figure every time. Labelling a per-turn loop with 6 NADH is the single most common error in student Krebs cycle diagrams.

Common mistakes in Krebs cycle diagrams

  • Mixing the two bases. Three NADH is per turn and six NADH is per glucose; never put both on one figure without saying which is which.
  • Counting pyruvate oxidation as a step of the cycle. Pyruvate to acetyl-CoA plus CO2 plus NADH is run by the pyruvate dehydrogenase complex before the loop starts, not by any of the eight cycle enzymes.
  • Reducing NAD+ at succinate dehydrogenase. That step reduces FAD to FADH2; NAD+ is reduced at isocitrate dehydrogenase, α-ketoglutarate dehydrogenase, and malate dehydrogenase.
  • Breaking the intermediate order. Succinyl-CoA comes before succinate, and fumarate comes before malate; swapped pairs are common in diagrams found online.
  • Placing the loop in the cytosol or on the inner membrane. In eukaryotes all eight steps sit in the mitochondrial matrix, and only succinate dehydrogenase is anchored in the inner membrane.
  • Assuming the two CO2 molecules released in a turn came from the acetyl group that just entered. Isotope labelling shows those carbons come from the oxaloacetate end of the molecule, although the balance is still two carbons in and two carbons out.

Krebs Cycle Diagram Generator FAQ

You can create a fully labeled Krebs cycle diagram, a numbered citric acid cycle steps figure, a simplified TCA cycle loop, a version drawn inside a mitochondrion, a yield comparison table, or a blank worksheet for students to complete.

Need other biology figures?

Generate respiration pathways, mitochondria diagrams, cell figures, photosynthesis visuals, and worksheet-ready biology illustrations with the same SciFigure AI workflow.