Create clean, publication-ready pathway diagrams for signaling cascades, metabolic routes, feedback loops, and molecular interactions. Use a broad 16:9 layout with text-only structure, readable arrows, and a white background.
Generate from textSignaling and metabolicEditable pathway labelsPublication-ready export
AI Biological Pathway Generator
Describe the pathway nodes, arrows, labels, and layout you want in a text-only workspace.
Costs 5 credits540 / 2000 characters
5 credits per PNG. Generate a publication-ready figure from your description.
Preview
Biological Pathway Example Previews
Target aspect ratio: 16:9
Sample previews. Describe your pathway to generate your own figure.
Biological Pathway Examples
Browse signaling and metabolic pathway diagrams, or generate your own text-only figure above.
Prompt
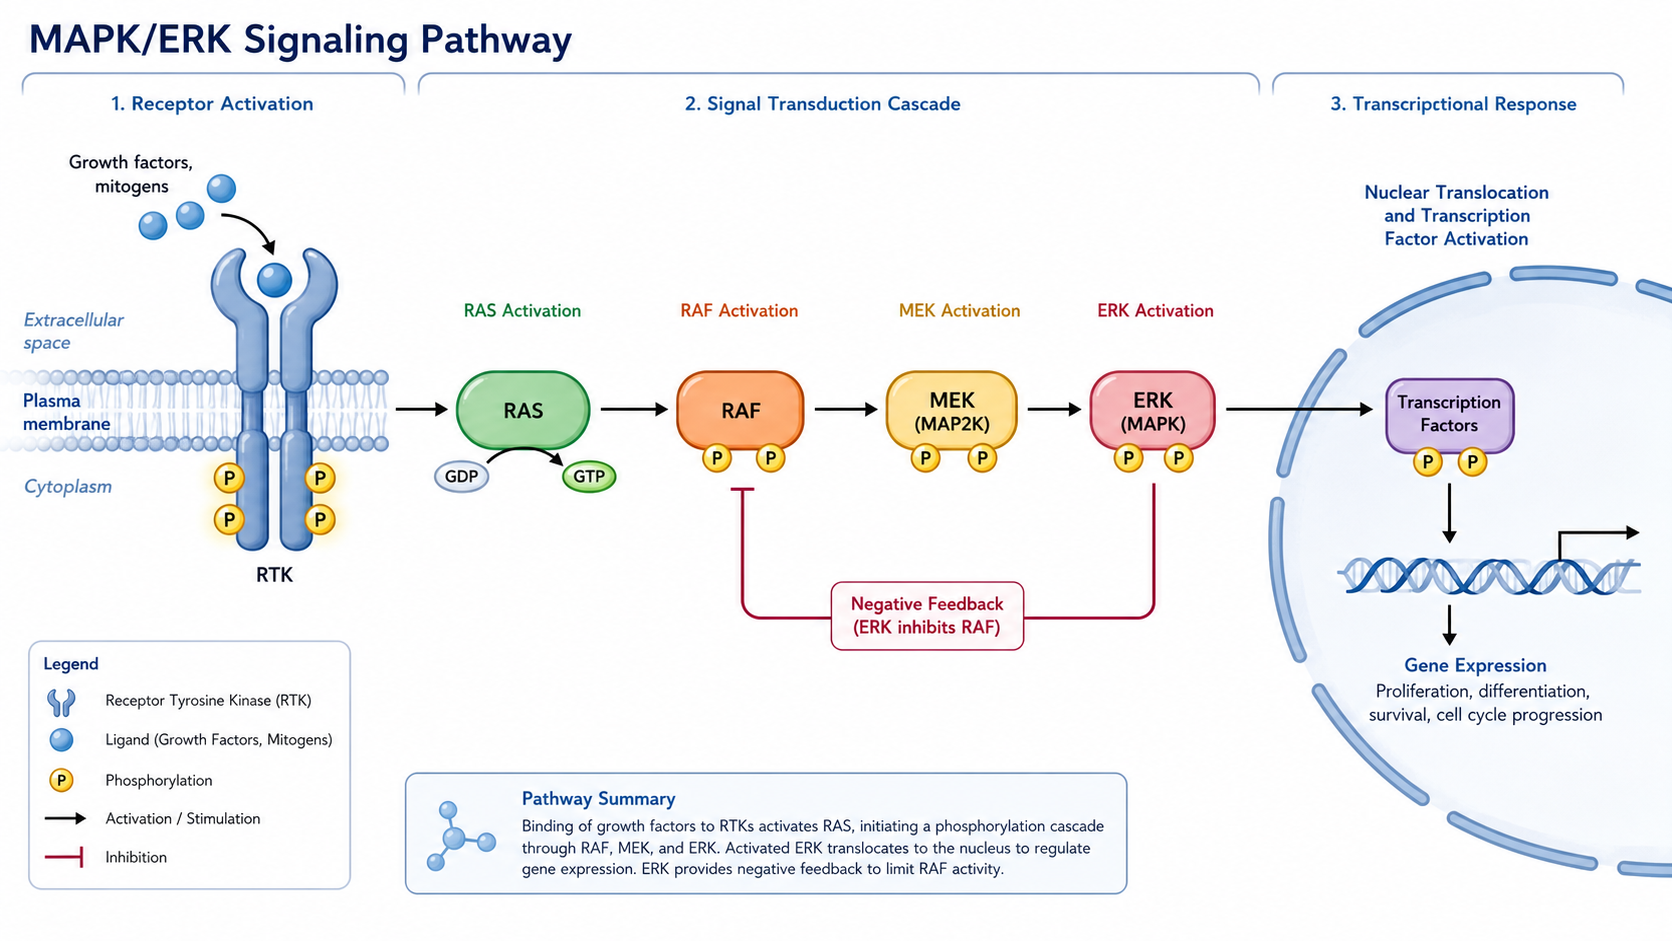
Create a publication-ready MAPK/ERK signaling pathway diagram with membrane receptor activation, RAS, RAF, MEK, ERK, nuclear translocation, and transcriptional output. Use a clear left-to-right structure, simple arrows, and a polished manuscript-ready style.
MAPK/ERK Signaling
Prompt
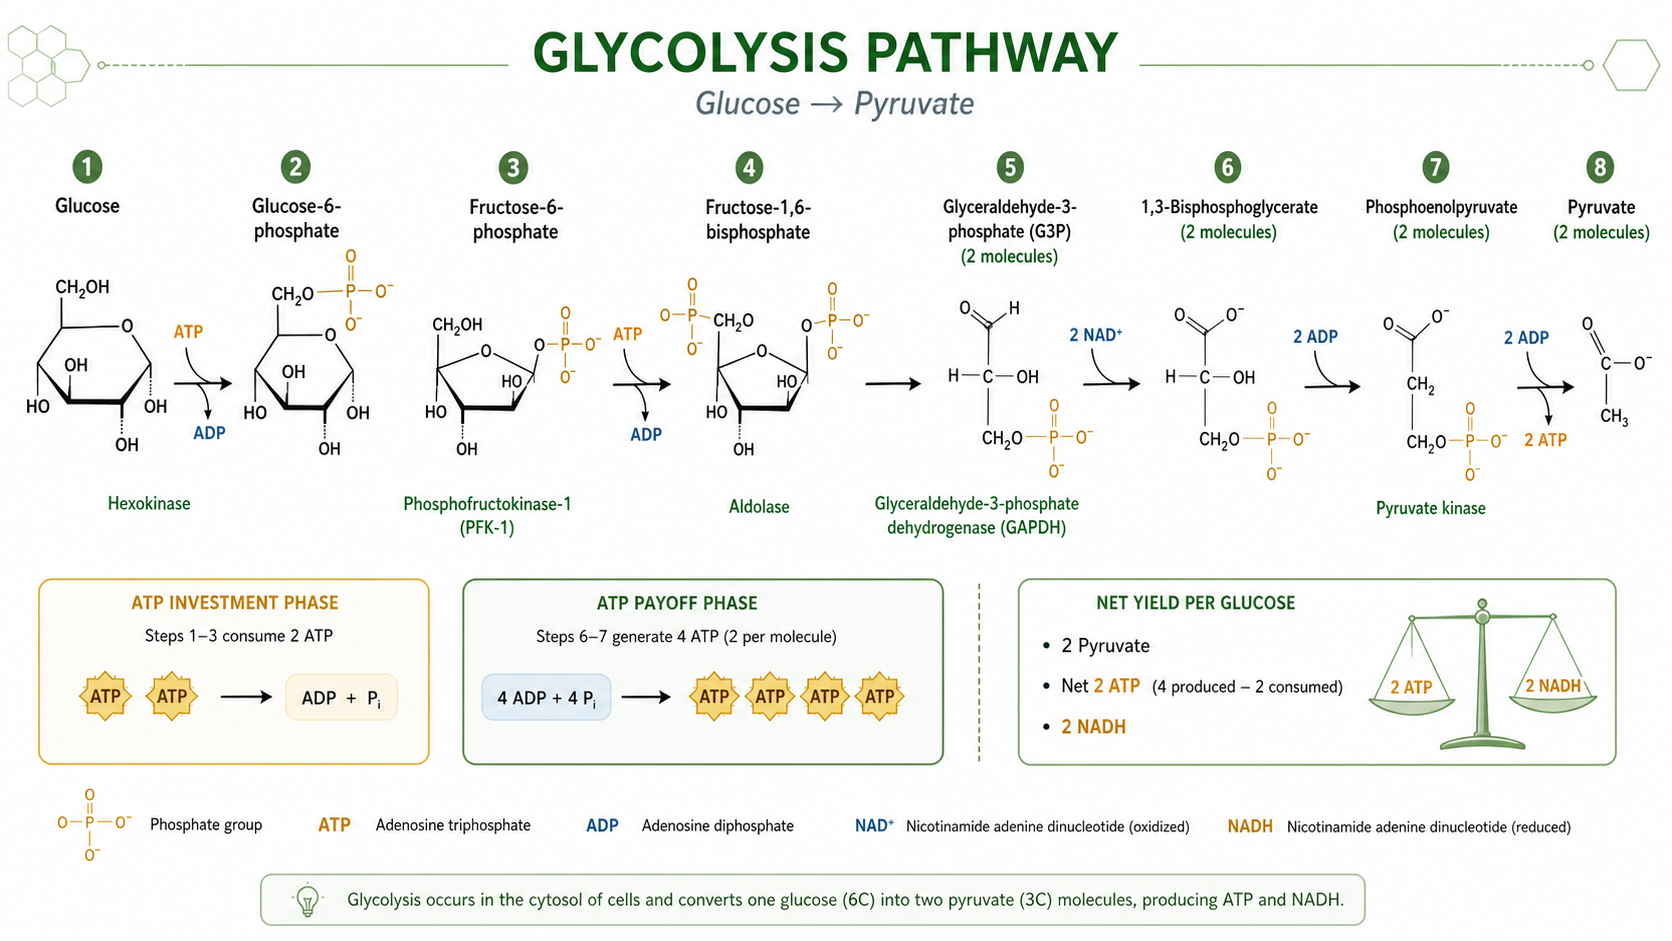
Create a publication-ready glycolysis pathway diagram showing glucose entry, key intermediates, ATP investment, ATP payoff, and pyruvate output. Use labeled steps, a broad text-only layout, and a clean white background.
Glycolysis Pathway
Prompt
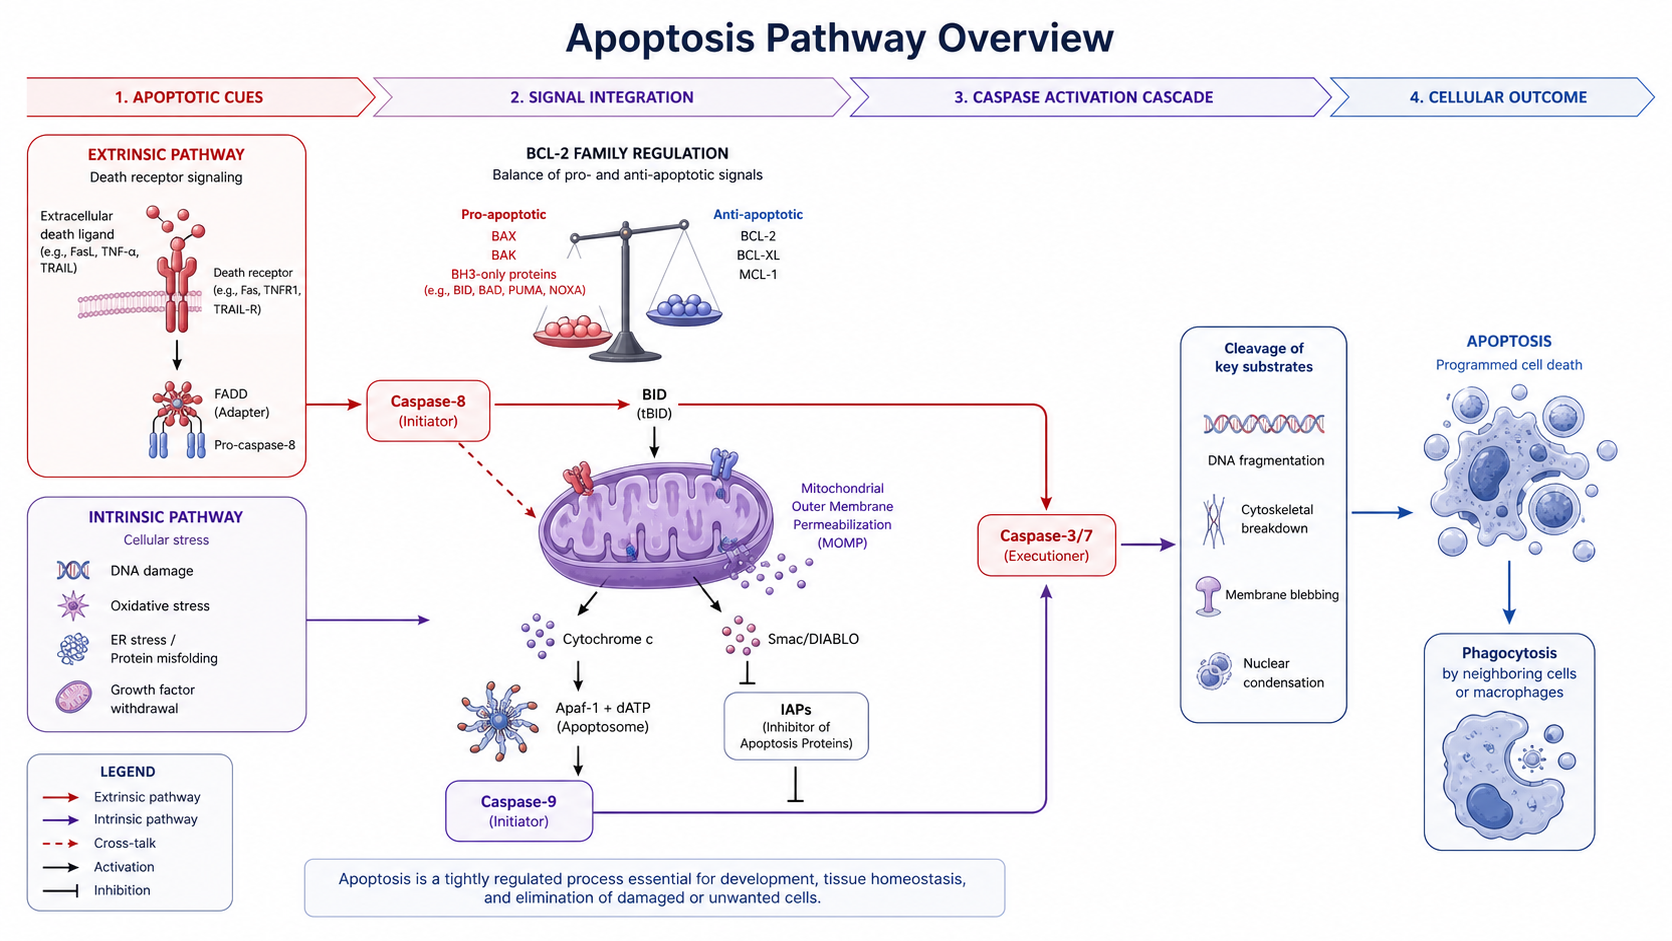
Create a publication-ready apoptosis pathway diagram with intrinsic and extrinsic cues, mitochondria, caspase activation cascade, BAX/BCL-2 balance, and cell death outcome. Use a wide layout with clear labels and a white background.
Apoptosis Pathway
Prompt
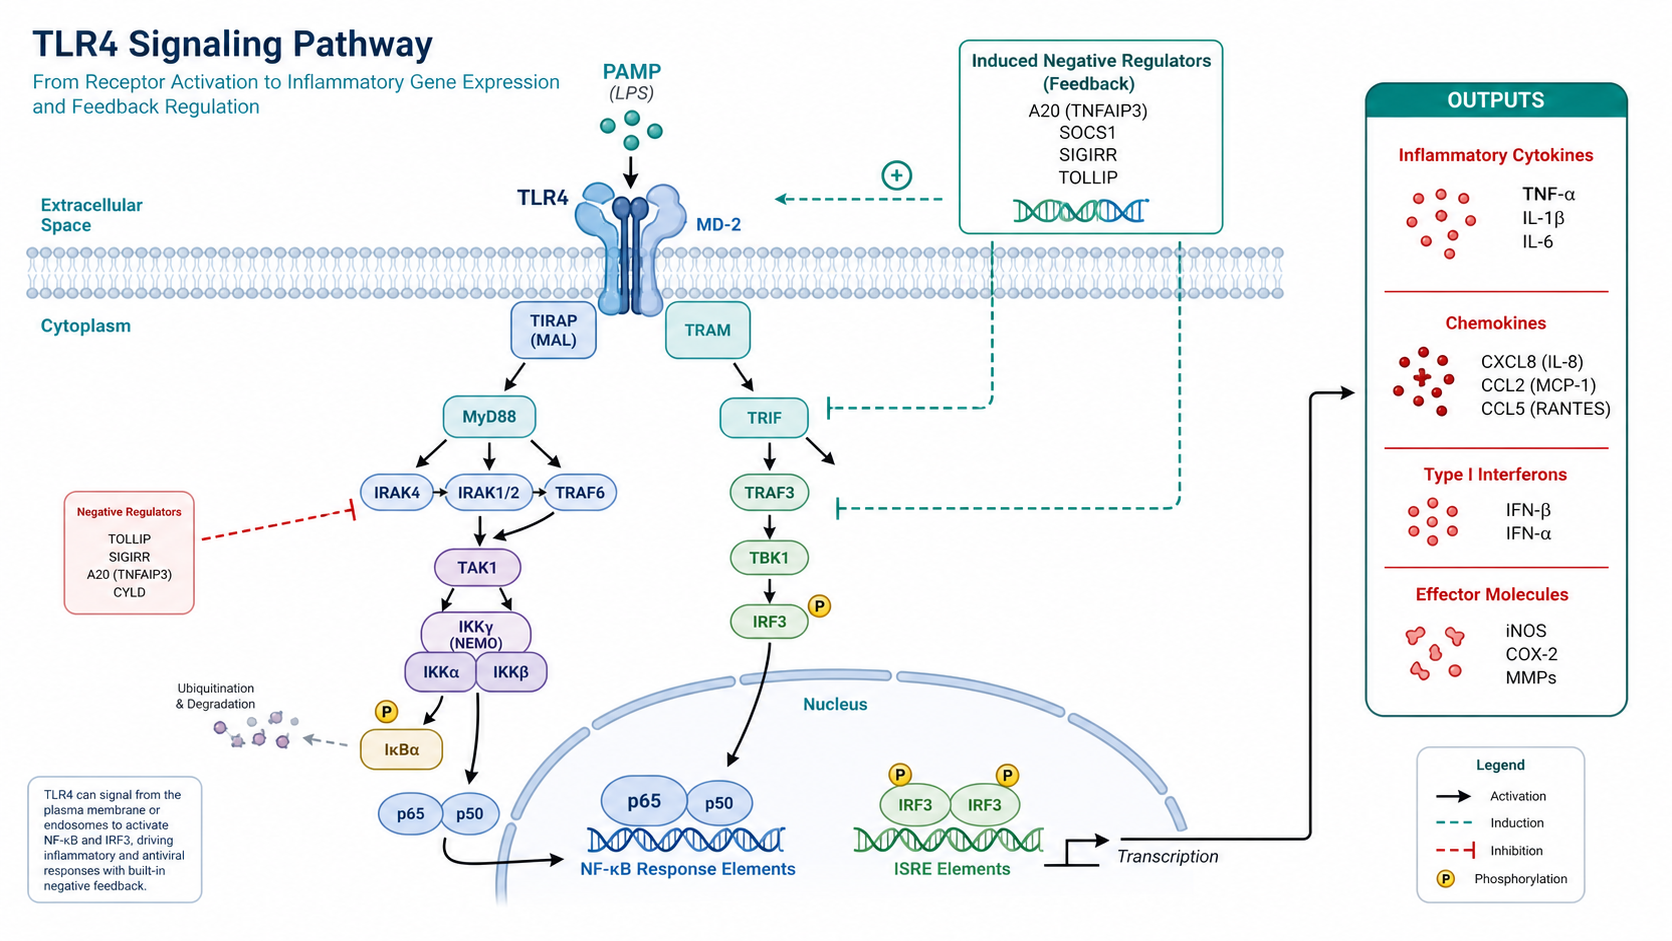
Create a publication-ready immune signaling pathway diagram with receptor activation, adaptor proteins, NF-kB translocation, inflammatory gene expression, and feedback regulation. Use a membrane-to-nucleus flow with a compact output panel.
Immune Signaling
Prompt
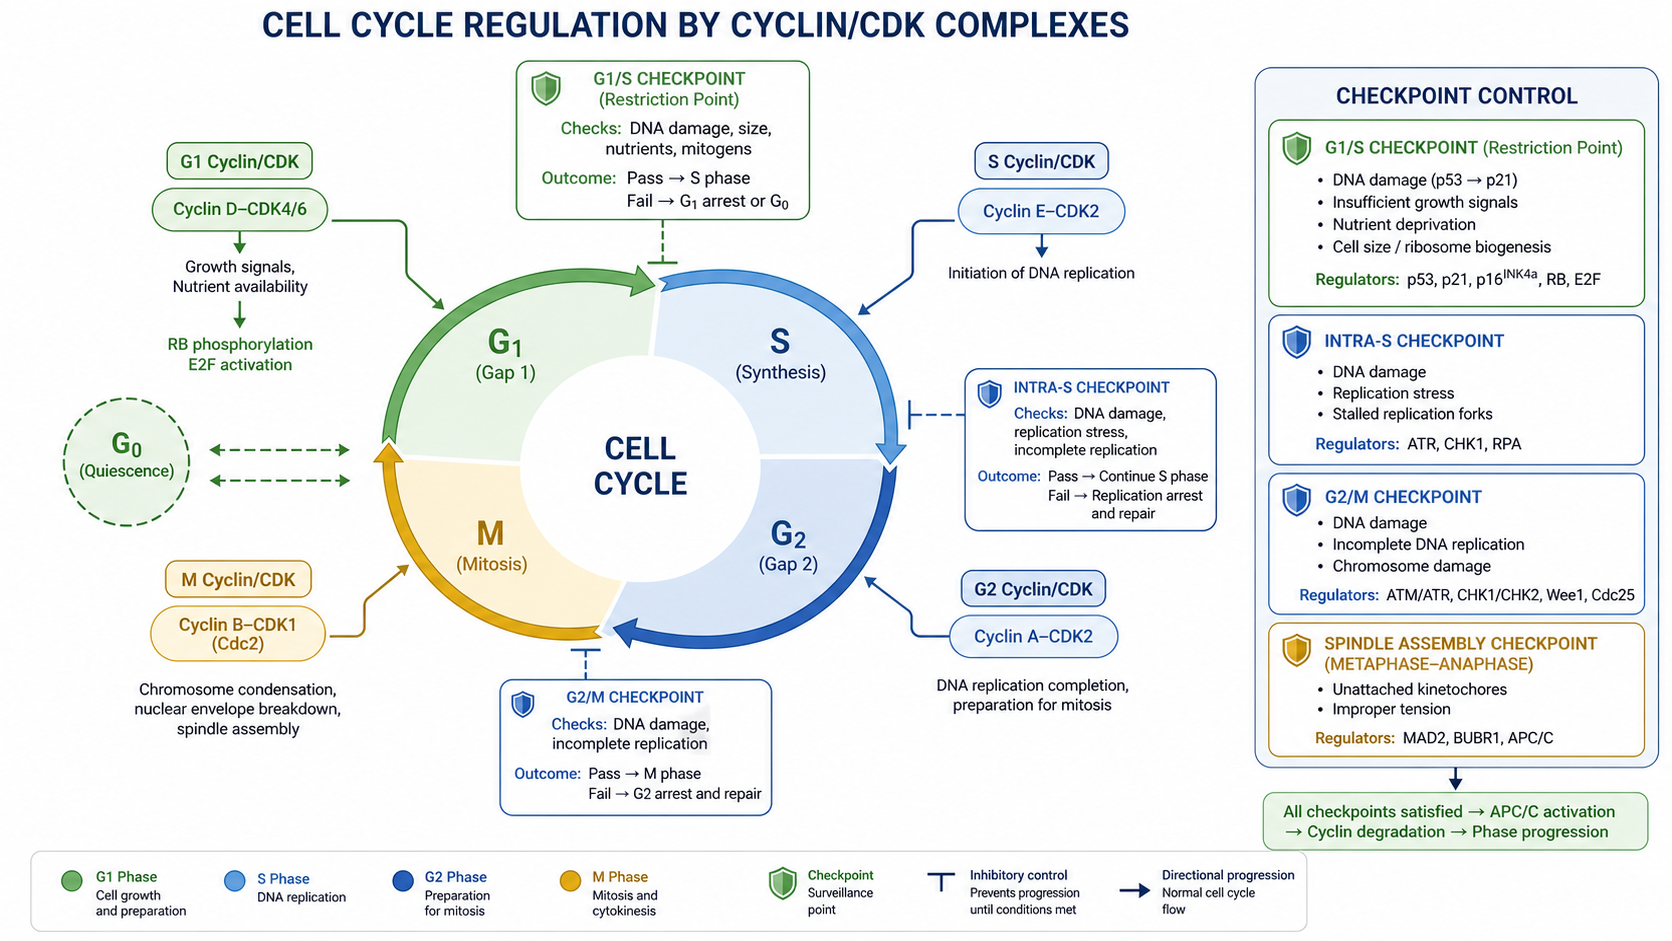
Create a clean cell cycle regulation diagram showing cyclin/CDK checkpoints, G1/S, S, G2/M progression, and checkpoint control. Use a circular layout with readable labels and a manuscript-ready presentation style.
Cell Cycle Regulation
Prompt
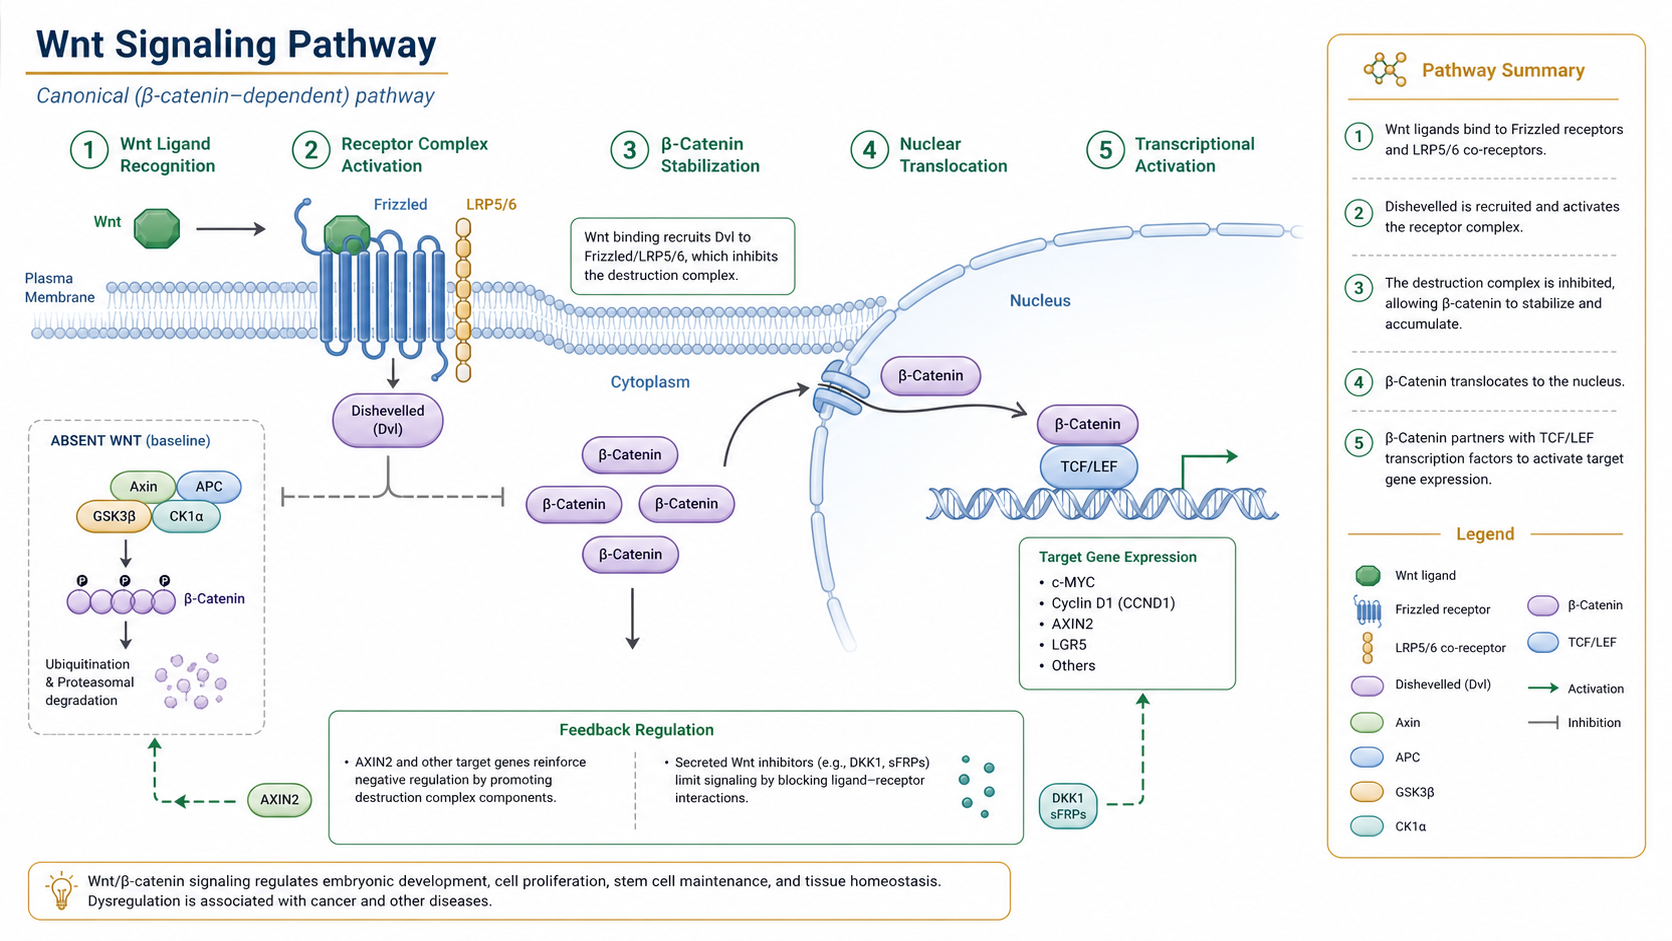
Create a publication-ready Wnt signaling pathway diagram with ligand recognition, receptor complex activation, beta-catenin stabilization, nuclear translocation, and transcriptional output. Use a broad horizontal layout and a compact regulatory summary panel.
Wnt Signaling Pathway
How to make a biological pathway diagram
1
Describe the pathway
Name the signaling cascade, metabolic route, or combined pathway you want, then list the key nodes and outputs.
2
Add flow and labels
Specify arrows, feedback loops, branch points, enzymes, metabolites, receptors, transcription factors, or other elements that should be visible.
3
Generate and review
Create the diagram, check the text-only layout, then download the PNG for papers, posters, slides, or teaching materials.
What is a biological pathway diagram?
A biological pathway diagram maps how molecules, signals, or metabolites move through a defined process. It can show receptor signaling, kinase cascades, transcriptional responses, enzyme networks, or metabolic cycles with arrows and labels that make the flow easy to follow.
Why researchers use pathway diagrams
Explain complex biological flow with a structure that readers can scan quickly.
Support manuscripts, review figures, posters, presentations, and teaching slides.
Show signaling and metabolism in one consistent visual language.
Draft publication-ready pathway figures before refining them with subject experts.
How to draw a pathway diagram
Start with the pathway order, then decide which nodes, arrows, compartments, and outputs should appear.
Keep the labels short and the flow directional so the figure stays readable at manuscript or slide size.
When a pathway is dense, split the story into a few linked sections instead of crowding one panel.
Parts of a pathway diagram
Receptors, ligands, kinases, transcription factors, enzymes, and metabolites.
Arrows, inhibition marks, feedback loops, and pathway branch points.
Compartment labels such as membrane, cytoplasm, nucleus, or mitochondria.
Short captions, readable node names, and a horizontal layout with generous spacing.
Frequently Asked Questions
You can create signaling pathway diagrams, metabolic pathway diagrams, receptor-to-response maps, enzyme routes, feedback loop figures, and broad molecular pathway overviews.