
Free reaction energy diagram tool
Draw a potential energy diagram from your reaction’s energies
Type the energies of the reactants, transition states, intermediates and products, and this potential energy diagram maker draws a smooth reaction profile through them, with activation energy and ΔH arrows that measure exactly the numbers you entered. Mark the rate-determining step, overlay a catalysed or enzyme pathway, switch between kJ/mol and kcal/mol, and print labelling, reading or drawing worksheets with answer keys.
Free, with no sign-up. Everything runs in your browser, and your last diagram is kept on this device only. Undo with Ctrl+Z.
Worked examples
Reading three energy diagrams, number by number
1. A one-step exothermic reaction
Reactants at 0 kJ/mol, a transition state at 75 kJ/mol and products at −50 kJ/mol. Every quantity is a difference between two levels:
| Quantity | Formula | Value |
|---|---|---|
| Ea (forward) | E(TS) − E(reactants) | 75 − 0 = 75 kJ/mol |
| Ea (reverse) | E(TS) − E(products) | 75 − (−50) = 125 kJ/mol |
| ΔH | E(products) − E(reactants) | −50 − 0 = −50 kJ/mol |
| Check | Ea(reverse) = Ea − ΔH | 75 − (−50) = 125 kJ/mol |
2. Two steps with an intermediate
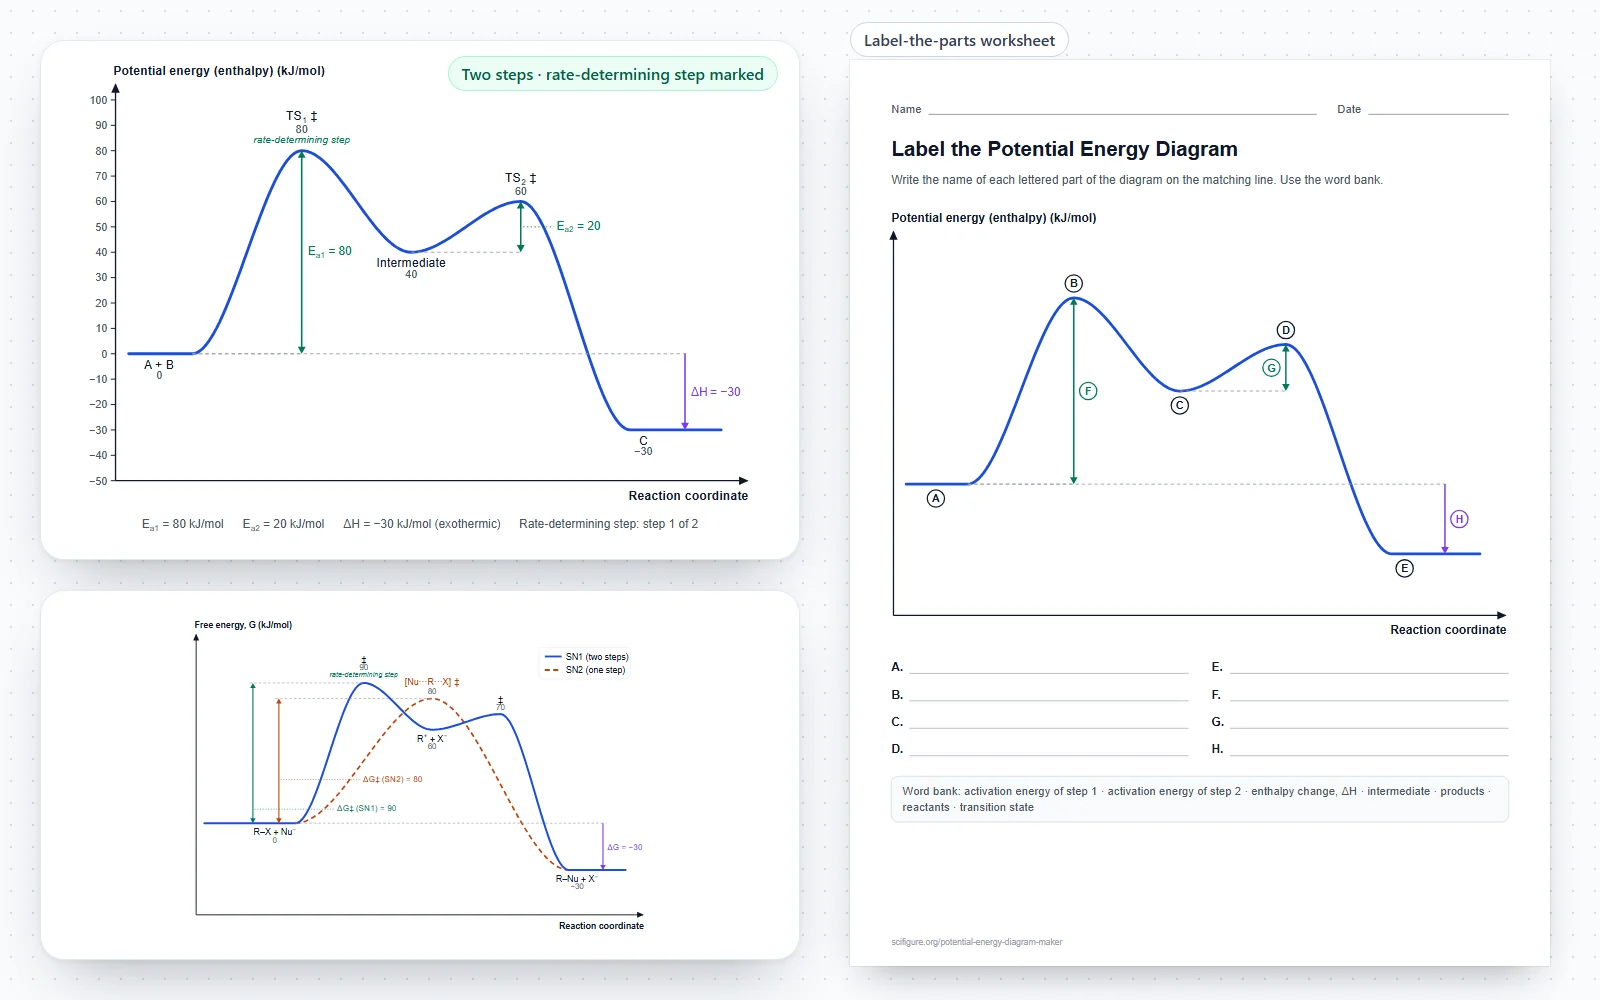
A + B (0) climbs to TS1 (80), drops to an intermediate (40), climbs to TS2 (60) and falls to the product (−30 kJ/mol). Step 1 has Ea1 = 80 kJ/mol and step 2 has Ea2 = 60 − 40 = 20 kJ/mol. The intermediate lies above the reactants, so the highest transition state decides the rate: step 1 is rate-determining, with an overall barrier of 80 kJ/mol. ΔH = −30 kJ/mol, so the reaction is exothermic overall even though step 1 on its own is endothermic.
3. The same reaction with a catalyst
Uncatalysed, the transition state is at 110 kJ/mol, so Ea = 110 kJ/mol. The catalysed pathway peaks at 60 kJ/mol: Ea = 60 kJ/mol, 50 kJ/mol lower. Both pathways start at 0 and end at −40 kJ/mol, so ΔH = −40 kJ/mol either way, and the reverse barrier falls by the same 50 kJ/mol. That is why a catalyst speeds up both directions and leaves the equilibrium where it was.
What a potential energy diagram shows
A potential energy diagram, also called a reaction energy diagram, an energy profile diagram or a reaction coordinate diagram, plots the energy of a reacting system as it changes from reactants to products. The horizontal axis is the reaction coordinate, the progress of the reaction; the vertical axis is energy.
- The reactants sit on the left and the products on the right; their difference in height is the energy change of the reaction, ΔH.
- Each peak is a transition state (activated complex), marked with a double dagger ‡: the highest-energy arrangement on the way from one minimum to the next.
- Each dip between two peaks is an intermediate, a species that is formed in one step and used up in a later one.
- The climb from a minimum to the next peak is that step’s activation energy, Ea: the energy that colliding molecules must have for the step to happen.
- The reaction coordinate is not time and has no units. It only orders the arrangements from reactants to products.
How to make a potential energy diagram
Start from a template or type your own energies. The diagram redraws as you type, and nothing leaves your browser.
- Under Profile, enter the reactants, the transition state and the products with their energies. Add a step for each intermediate; minima and transition states alternate automatically.
- Name the species as you would write them: H2O prints as H₂O, Nu^- as Nu⁻ and Fe^3+ as Fe³⁺. Leave a transition state’s name empty to show just ‡.
- Under Show, choose the arrows: forward and reverse activation energies, ΔH, and the barrier of a second pathway. Add an energy scale, mark the rate-determining step, or switch the numbers off.
- Switch on Compare a second pathway for a catalysed, enzyme or SN2 profile between the same reactants and products, drawn dashed.
- Choose the energy axis: enthalpy (ΔH, Ea), energy (ΔE, Ea) or free energy (ΔG, ΔG‡), in kJ/mol or kcal/mol.
- Download the diagram as a vector PDF, a 300 dpi PNG or an SVG, or make a worksheet under Worksheet.
Reading activation energy and ΔH from the diagram
Every quantity on a one-step diagram is a difference between two heights. The arrows this tool draws start and end exactly at those heights.
- Activation energy, forward: Ea = E(transition state) − E(reactants).
- Activation energy, reverse: Ea(reverse) = E(transition state) − E(products).
- Energy change: ΔH = E(products) − E(reactants). It is negative when the products are lower.
- The three are linked: Ea(reverse) = Ea − ΔH. For the exothermic template, 75 − (−50) = 125 kJ/mol.
- A larger activation energy means a slower reaction at the same temperature, because fewer collisions have enough energy (the Arrhenius equation, k = A·e^(−Ea/RT)).
Exothermic and endothermic energy diagrams
The sign of ΔH is read from the ends of the curve alone; the height of the hump says nothing about it.
- Exothermic: the products lie below the reactants, ΔH is negative and energy is released to the surroundings. The reverse barrier is larger than the forward one.
- Endothermic: the products lie above the reactants, ΔH is positive and energy is absorbed. The forward barrier is at least as large as ΔH.
- An exothermic reaction can still be slow if its activation energy is high, and an endothermic one can be fast.
- In a multi-step reaction each step can be exothermic or endothermic on its own; ΔH of the overall reaction is still products minus reactants.
Transition states and intermediates
Both sit between reactants and products, but they are different things, and a diagram shows the difference by shape.
- A transition state is a maximum: bonds are partly broken and partly formed, it lasts for about one molecular vibration and it cannot be isolated. It is written in square brackets with ‡.
- An intermediate is a minimum: a real species with a finite lifetime, such as a carbocation, that can sometimes be detected or trapped.
- A reaction with n steps has n transition states and n − 1 intermediates, which is how the tool numbers them.
- Hammond’s postulate: a transition state resembles the species nearest to it in energy, so the transition state of a strongly exothermic step looks like its reactants.
Multi-step reactions and the rate-determining step
In a mechanism with several elementary steps, the slowest one limits the overall rate. On an energy diagram it is the step whose transition state is hardest to reach from where the molecules actually are.
- When every intermediate lies above the reactants, that is simply the highest transition state on the diagram.
- When an intermediate lies below the reactants, measure each transition state from the lowest point before it. The tool marks the step with the largest such climb and calls it the rate-determining step.
- The step with the largest individual Ea is not always the rate-determining one: if a high intermediate follows a low barrier, the next transition state can still be the hardest to reach.
- With Mark the rate-determining step on, the label goes above that transition state, and the summary names the step.
Catalysts and enzymes on an energy diagram
A catalyst provides a different mechanism with a lower activation energy. It does not change the energies of the reactants or the products, so ΔH stays the same.
- Draw the uncatalysed reaction as the main pathway and the catalysed one as the second, dashed pathway; the tool keeps both ends shared.
- The catalysed path often has more steps, each with a smaller barrier, because the catalyst binds the reactants and is released at the end.
- Lowering the barrier speeds up the forward and the reverse reaction alike, so a catalyst does not shift the position of an equilibrium; it is reached sooner.
- Enzymes work the same way: E + S binds to ES, the chemical step passes through ES‡ to EP, and E + P is released. The enzyme template shows this against the uncatalysed reaction on a free-energy axis.
SN1 and SN2 reaction profiles
Nucleophilic substitution is the classic place to compare one- and two-step profiles. The SN1 vs SN2 template uses round illustrative energies, not measured ones.
- SN2 is one step: the nucleophile attacks as the leaving group departs, through a single transition state, so the profile has one hump and no intermediate.
- SN1 is two steps: the leaving group departs to give a carbocation intermediate, which the nucleophile then captures. Ionisation is the slow, rate-determining step.
- That is why SN1 rates depend only on the substrate concentration and SN2 rates on both the substrate and the nucleophile.
- Tertiary substrates, which form stable carbocations, favour SN1; methyl and primary substrates favour SN2.
Energy, enthalpy or free energy, and the units
Introductory chemistry plots potential energy or enthalpy; organic chemistry and biochemistry usually plot free energy, G. The shape is drawn the same way.
- Choose ΔH and Ea for enthalpy, ΔE and Ea for energy, or ΔG and ΔG‡ for free energy; the arrows, summary and worksheet questions follow.
- kJ/mol is the SI-based unit; many organic texts use kcal/mol. 1 kcal = 4.184 kJ, and Convert to kcal changes every number at once, rounded to 0.1.
- The energy scale picks a step that every energy is a multiple of, so on a worksheet each species sits on a grid line.
Potential energy diagram worksheets
The same profile makes three kinds of worksheet, each with an answer key that has the identical diagram.
- Label the parts: reactants, products, transition states, intermediates and the arrows are replaced by letters A, B, C …, with answer lines and an optional word bank.
- Read the values: the diagram on a grid with an energy scale and questions on Ea, the reverse Ea, ΔH, exothermic or endothermic, the number of intermediates, the rate-determining step and the effect of a catalyst.
- Draw it: blank axes with a grid, a table of the energies and the questions; the key shows the finished diagram on the same axes.
- Questions and answers come from your energies, so editing the profile writes a new worksheet.
Common mistakes on energy diagrams
These are the errors markers look for, and the tool will not draw several of them.
- Measuring Ea from the bottom of the graph instead of from the reactant level.
- Drawing ΔH from the transition state: it runs from the reactants to the products.
- Labelling an intermediate as a transition state, or the other way round: peaks are transition states, valleys are intermediates.
- Showing a catalyst that changes the reactant or product energy. Catalysed and uncatalysed curves must start and end at the same levels.
- Putting a transition state lower than the minimum next to it; the tool reports this as an error rather than drawing it.
- Calling the step with the biggest single climb rate-determining without checking where the lowest point before it is.
Exporting for reports, slides and papers
Every page is laid out once and drawn the same way on screen, in the PDF and in the PNG.
- The PDF is vector: curves, arrows, subscripts and ‡ stay sharp at any size, and the text stays selectable.
- PNG at 300 dpi for slides and lab reports; SVG to recolour or restyle in Illustrator, Inkscape, PowerPoint or Keynote.
- Black and grey mode prints cleanly on a laser printer and in journals that charge for colour.
Frequently asked questions
What is a potential energy diagram?
A graph of the energy of a reacting system against the reaction coordinate, from reactants to products. It shows the activation energy as the climb to each peak and the energy change of the reaction as the difference between the two ends.
Is a reaction energy diagram the same as an energy profile or reaction coordinate diagram?
Yes. Potential energy diagram, reaction energy diagram, energy profile diagram and reaction coordinate diagram all name the same plot. Free energy diagram is used when the vertical axis is G.
How do you find the activation energy on a potential energy diagram?
Subtract the energy of the reactants from the energy of the transition state. For a step that starts from an intermediate, subtract the intermediate’s energy instead. With 0 kJ/mol reactants and a 75 kJ/mol transition state, Ea = 75 kJ/mol.
How can you tell if a reaction is exothermic or endothermic from the diagram?
Compare the two ends. Products below reactants: exothermic, ΔH negative. Products above reactants: endothermic, ΔH positive. The height of the hump does not matter.
What is the difference between a transition state and an intermediate?
A transition state is a peak: a fleeting arrangement that cannot be isolated, marked ‡. An intermediate is a valley between two peaks: a real species with a lifetime, such as a carbocation, formed in one step and used in the next.
How do you find the rate-determining step on an energy diagram?
Find the transition state that lies highest above the lowest point before it. If every intermediate is above the reactants, that is just the highest peak. The tool marks this step and names it in the summary.
How does a catalyst change a potential energy diagram?
It adds a new pathway with a lower activation energy, often with more, smaller humps. The reactant and product levels do not move, so ΔH stays the same, and both the forward and the reverse reactions are faster.
What is the activation energy of the reverse reaction?
The climb from the products to the transition state: Ea(reverse) = E(transition state) − E(products), which equals Ea − ΔH. For an exothermic reaction it is larger than the forward activation energy.
What does the reaction coordinate on the x-axis mean?
The progress of the reaction from reactants to products, measured along the changing bond lengths and angles. It has no units and is not time, which is why the axis has no scale.
How do you draw a potential energy diagram by hand?
Draw an energy axis and a reaction coordinate axis. Mark the reactant and product levels, place each transition state as a peak and each intermediate as a valley, join them with a smooth curve that is flat at every peak and valley, then add a vertical arrow for Ea from the reactants to the peak and one for ΔH from the reactants to the products. The Draw it worksheet gives students blank axes for this.
Can I use kcal/mol or free energy instead of kJ/mol and enthalpy?
Yes. Choose kcal/mol under Units, or press Convert to change every energy using 1 kcal = 4.184 kJ. Choose ΔG, ΔG‡ for a free-energy diagram, as used in organic chemistry and biochemistry.
Can I make an orbital energy diagram or an MO energy diagram here?
No. Those plot the energies of electrons in orbitals, not the energy of a reaction. Use the orbital diagram generator for the electron configuration of an atom, such as cobalt, and the molecular orbital diagram tool for diatomic molecules.
Can I edit the diagram in ChemDraw, PowerPoint or Illustrator?
Download the SVG: every curve, arrow and label is a separate vector object you can restyle in Illustrator, Inkscape, PowerPoint or Keynote. The PDF and 300 dpi PNG are ready to paste into a report or an energy diagram you would otherwise build by hand in ChemDraw.
Related tools
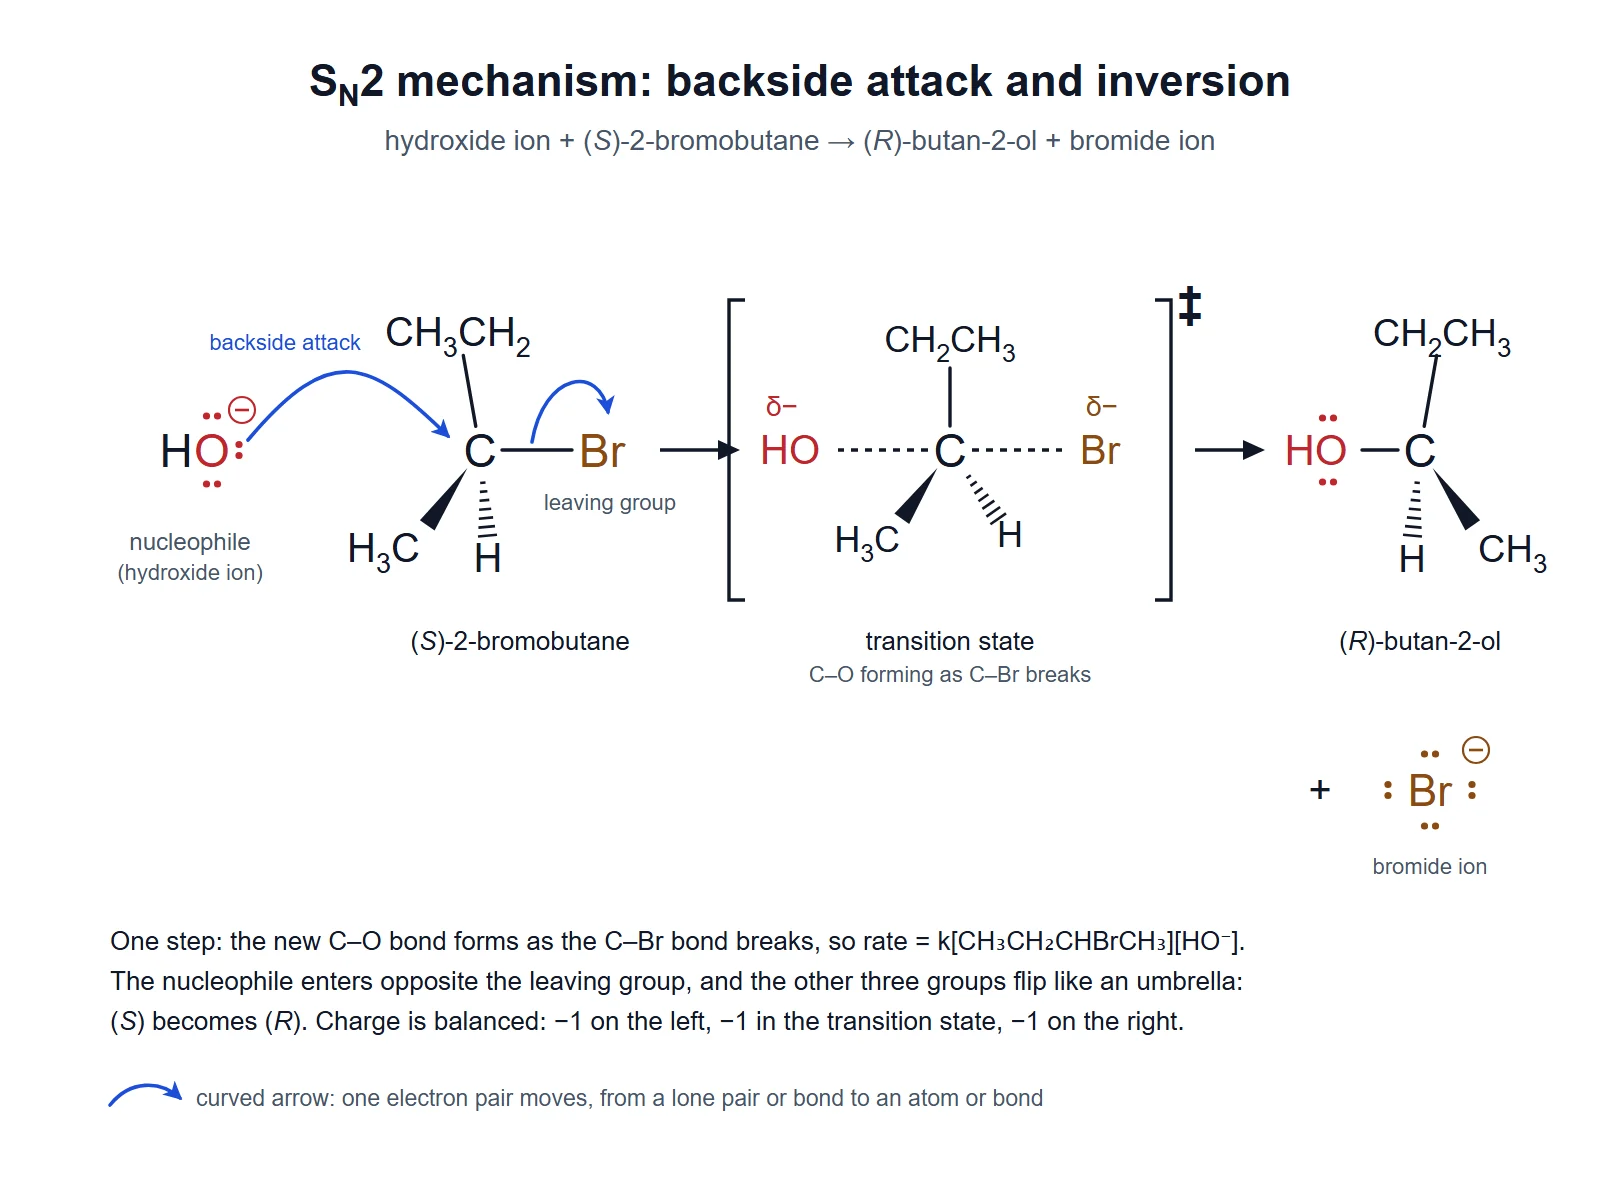
Reaction Mechanism Diagram
Curved-arrow mechanisms that go with each step of your energy profile.
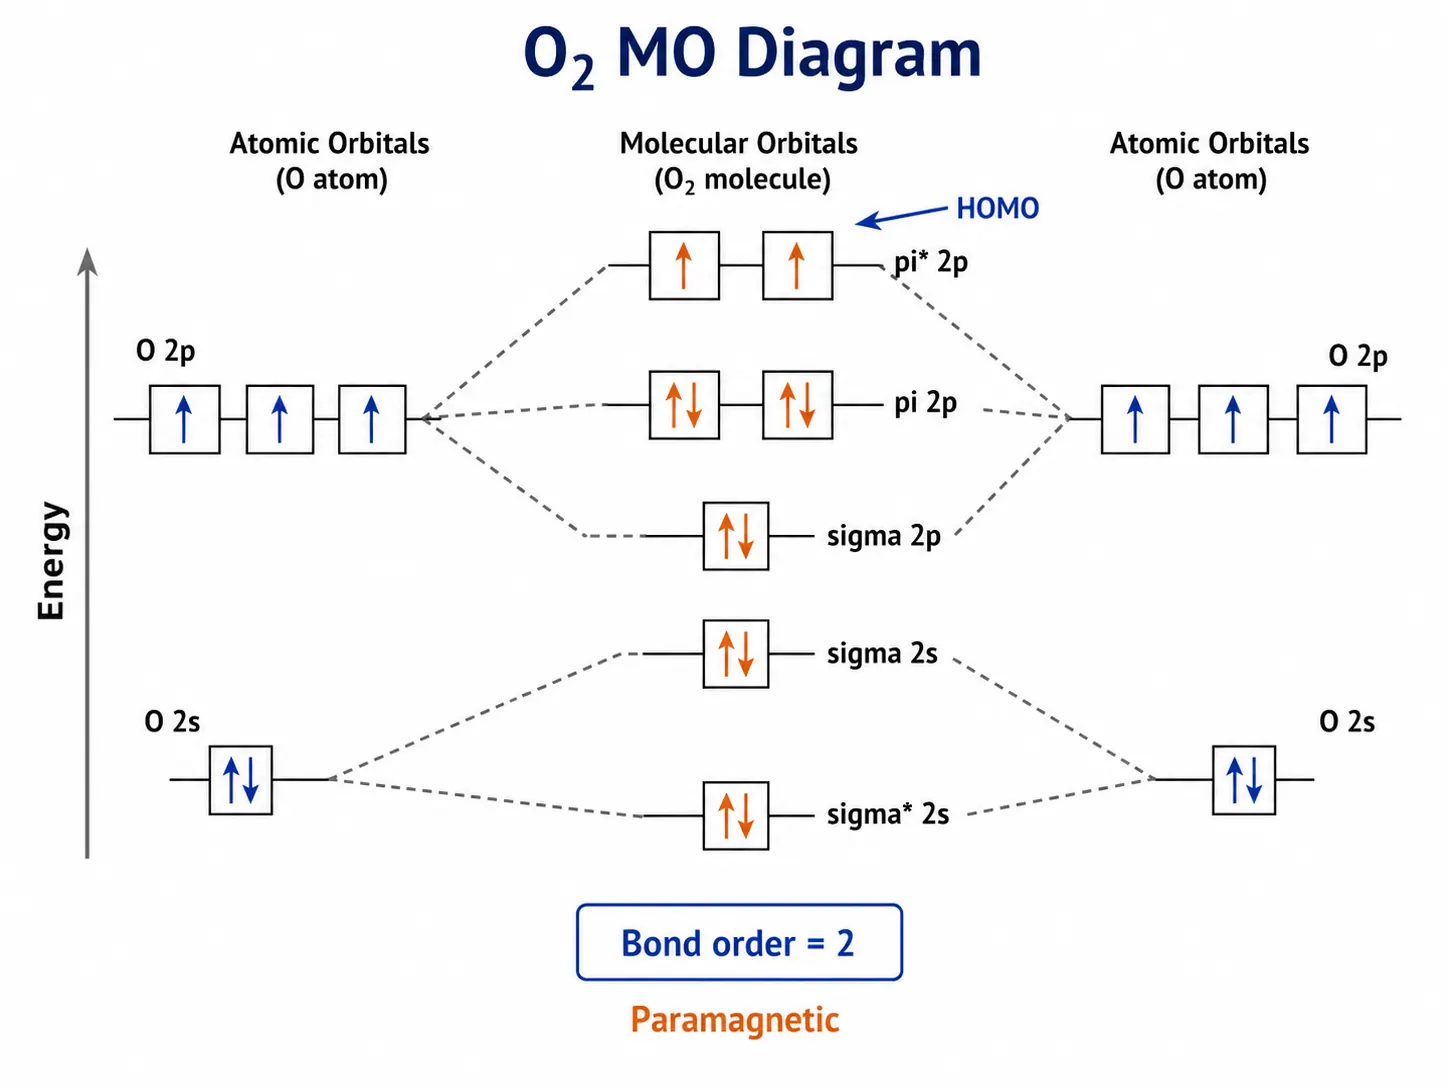
Molecular Orbital Diagram
MO energy diagrams for period 2 diatomic molecules, with bond order and magnetism.
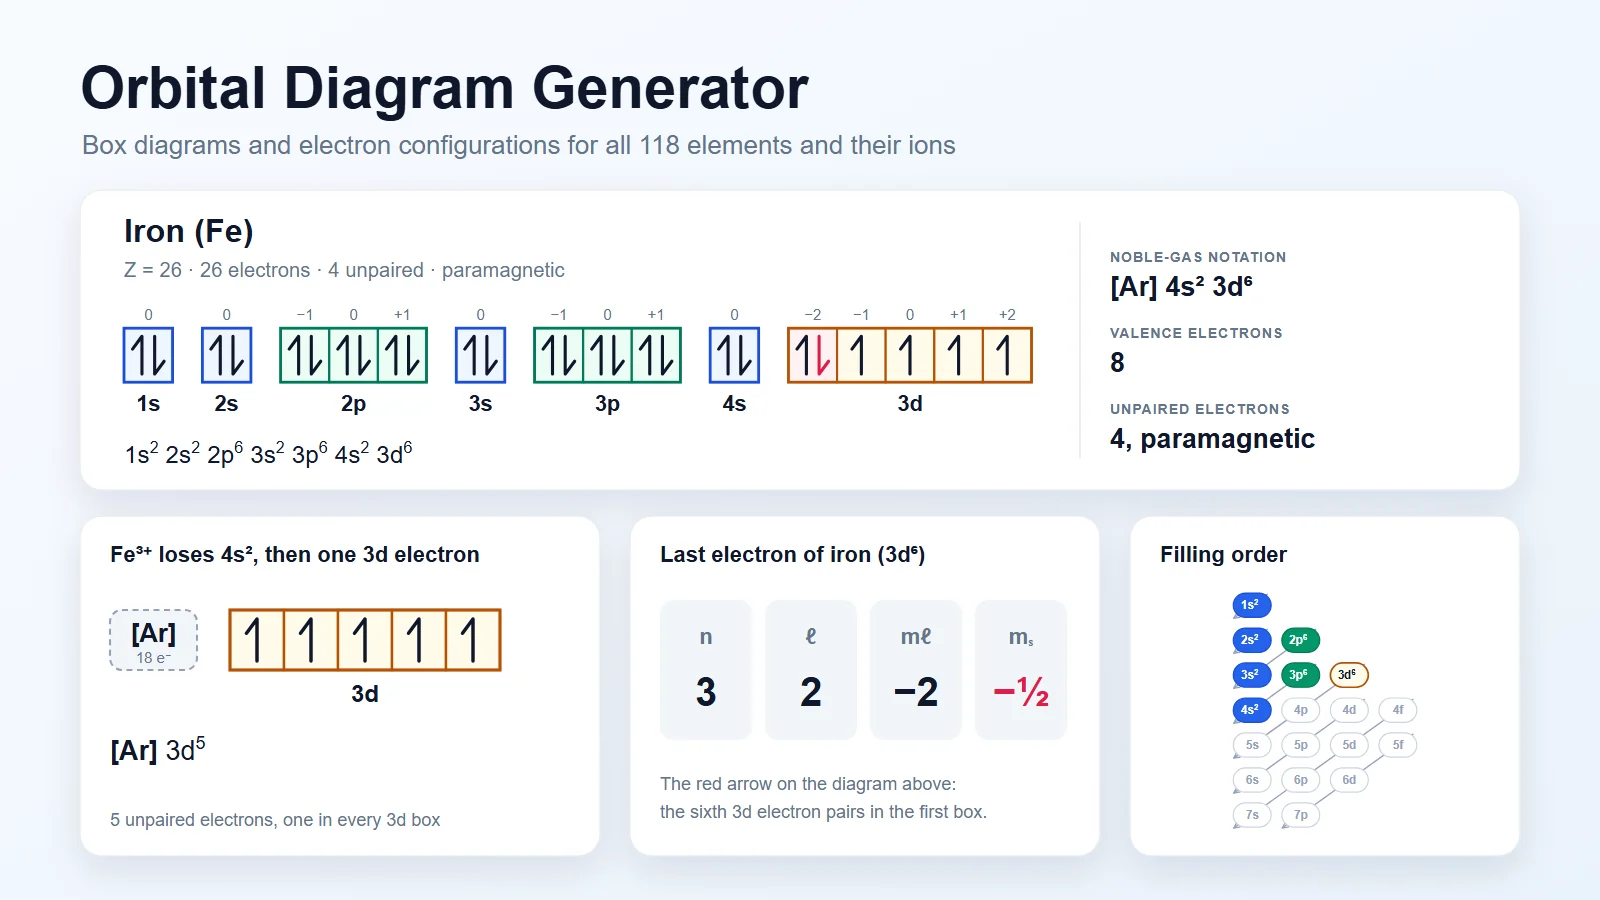
Orbital Diagram Generator
Electron configurations as box-and-arrow orbital diagrams for any element.
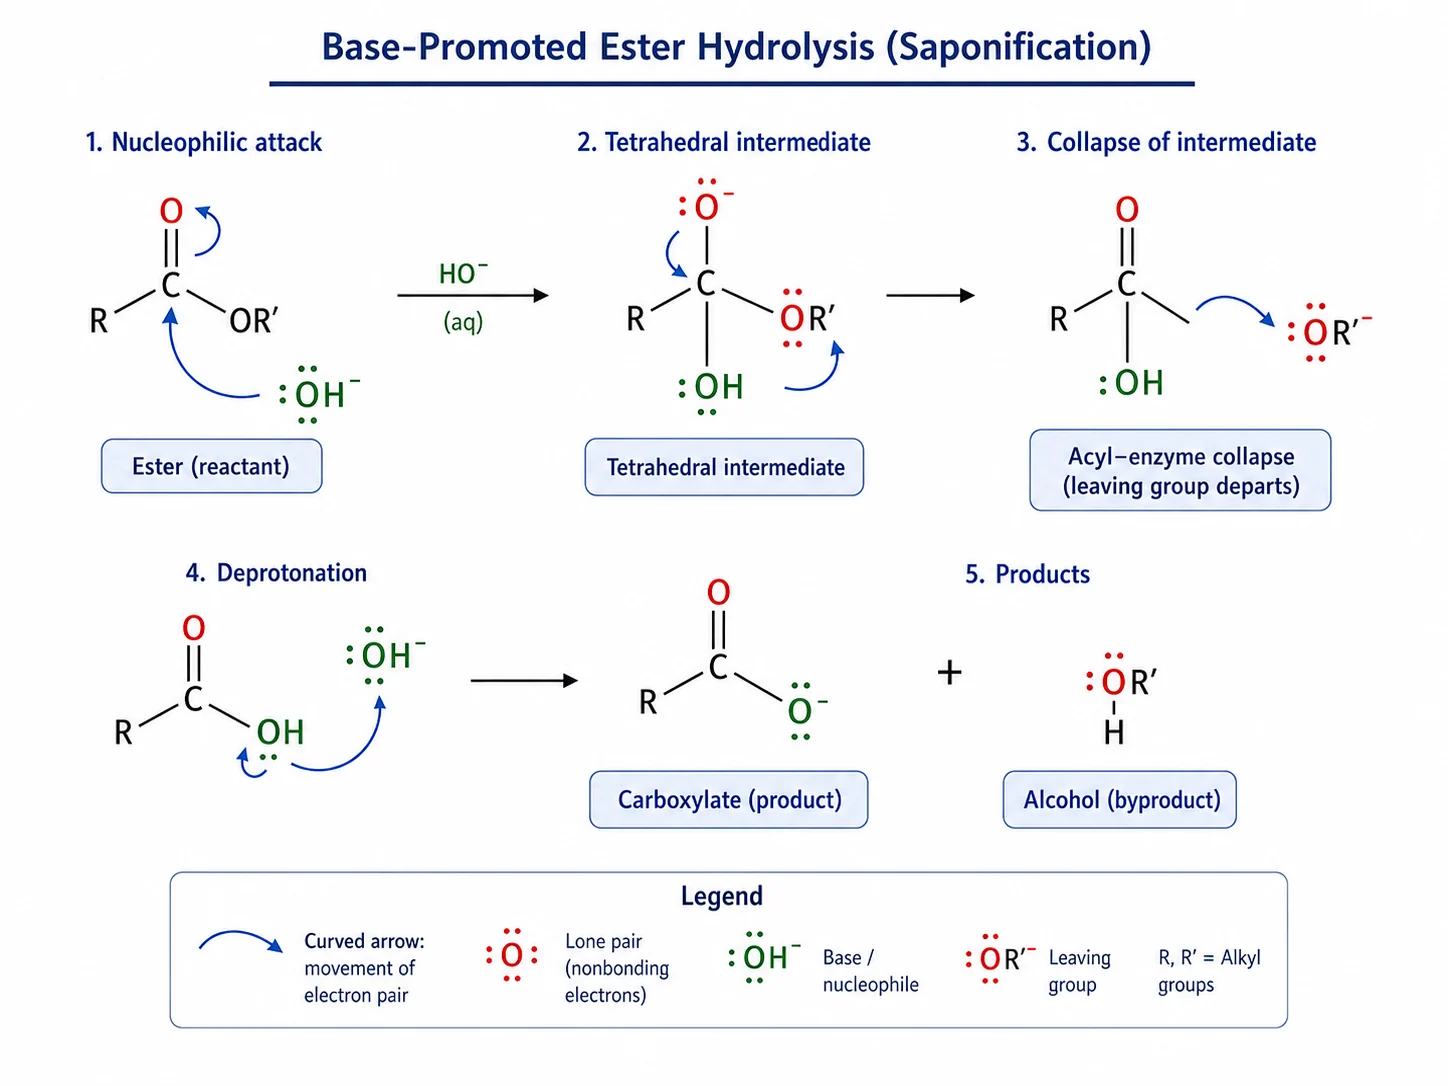
Chemistry Diagram Generator
Reaction schemes, lab setups and chemistry figures drawn from a description.
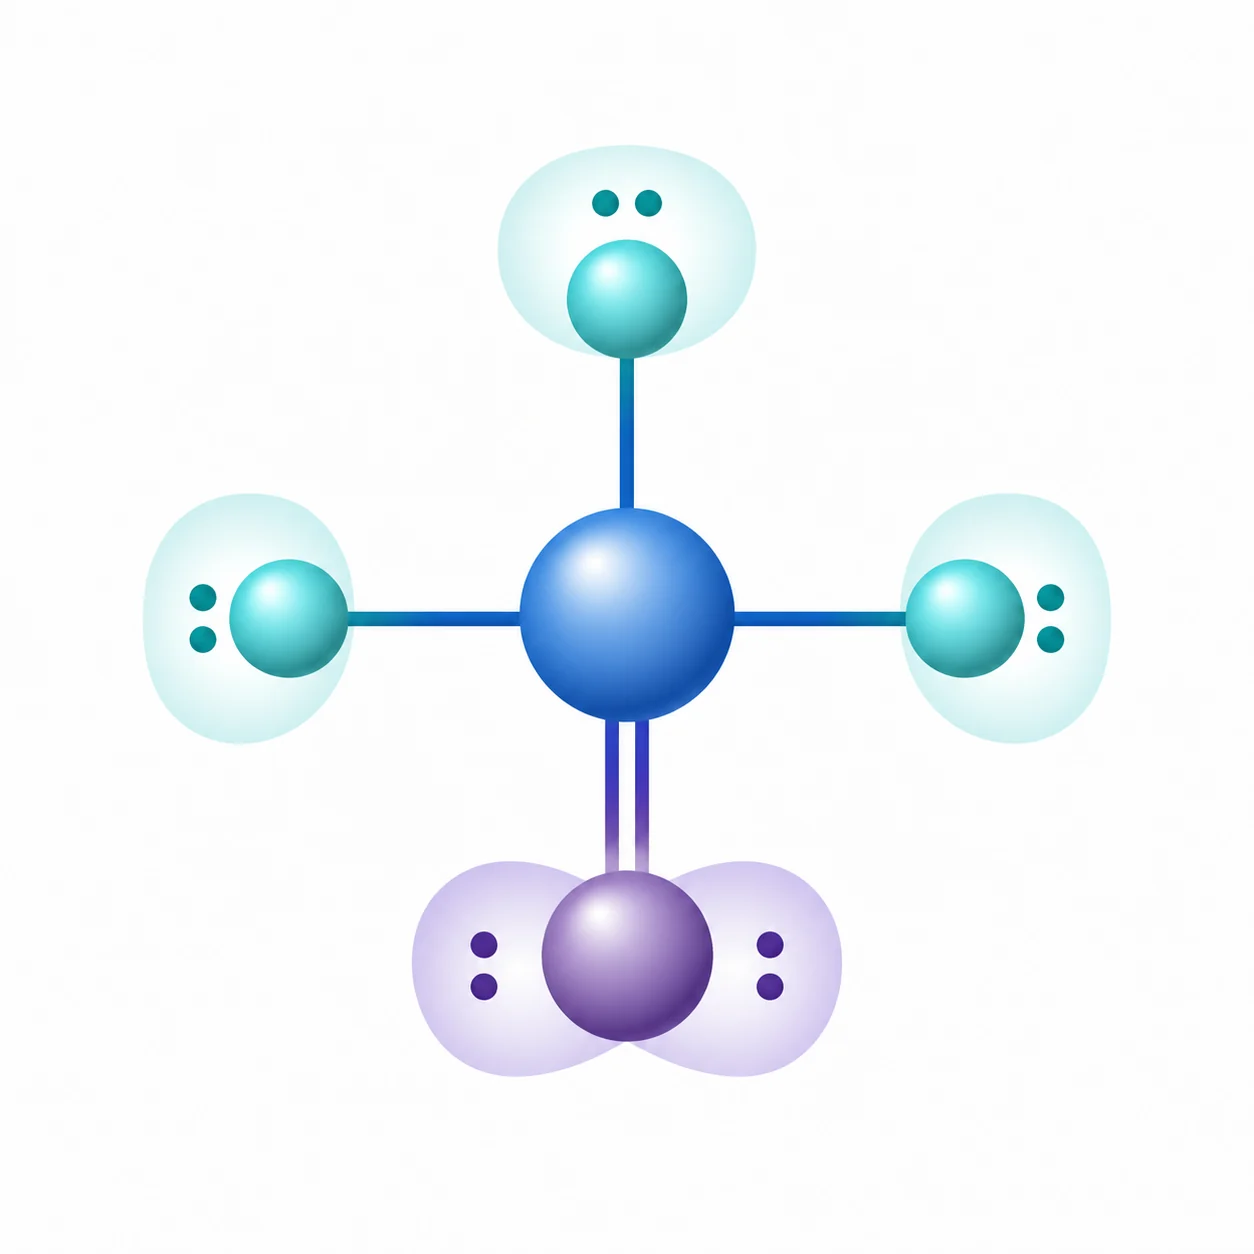
Lewis Dot Structure Generator
Lewis structures with lone pairs, formal charges and resonance.
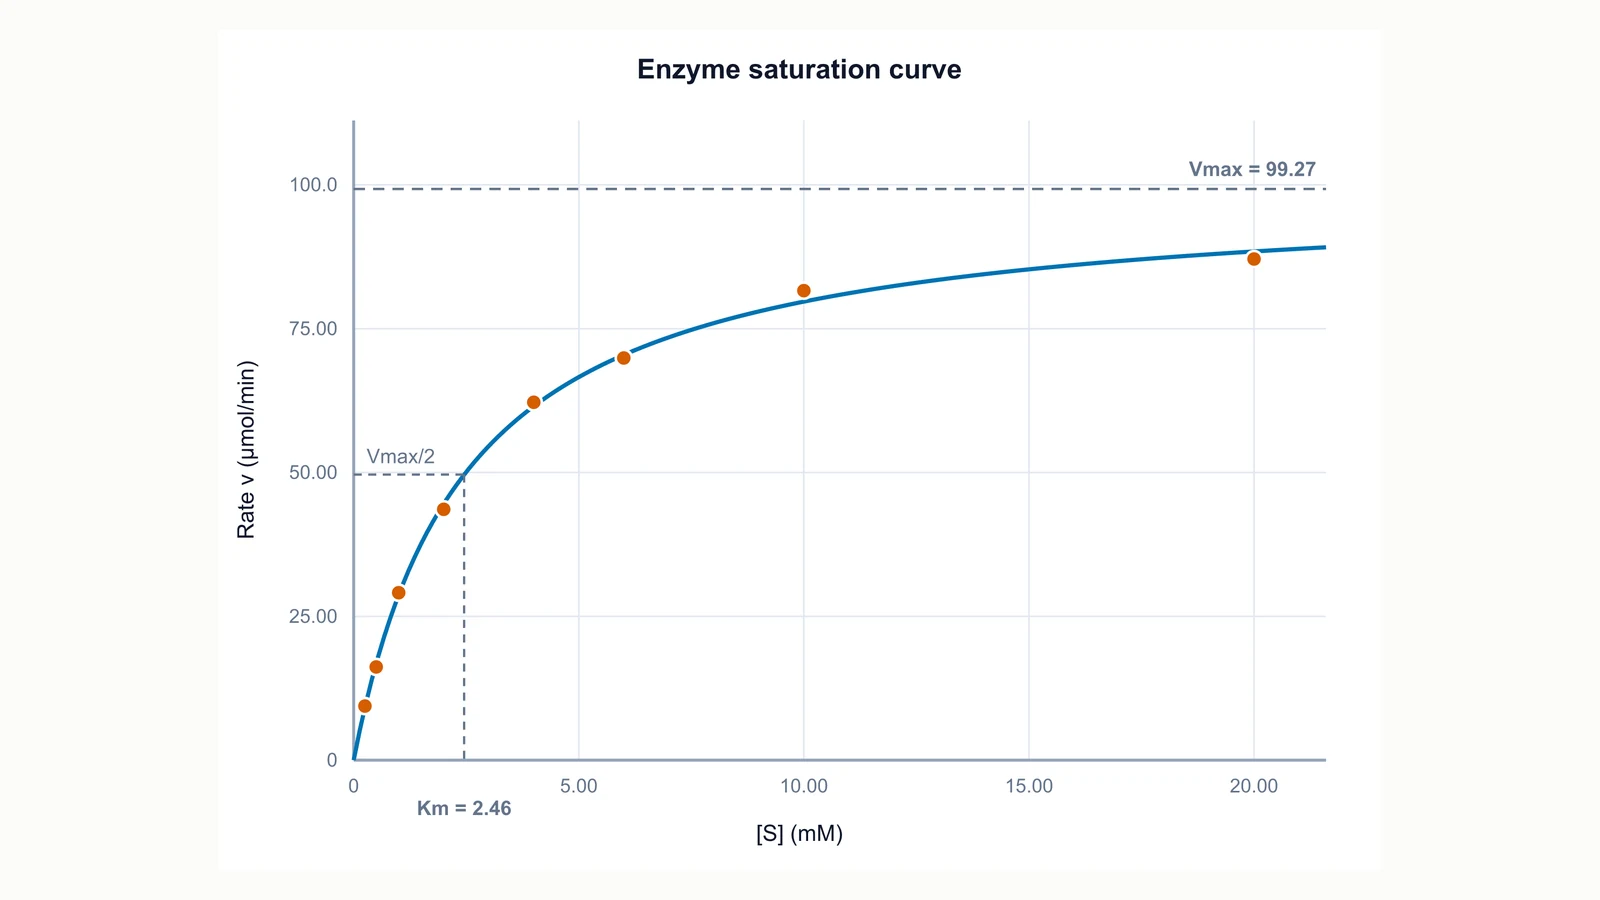
Michaelis–Menten Plot Generator
Fit Vmax and Km to enzyme rate data, the kinetics behind the enzyme profile.
More free chemistry tools
Orbital diagrams, molecular orbitals, Lewis structures and particle diagrams, free to use and print.
Browse the free toolsLast checked: November 17, 2026. Sources: OpenStax Chemistry 2e, 12.5 Collision Theory; 12.6 Reaction Mechanisms; 12.7 Catalysis; 5.3 Enthalpy; OpenStax Biology 2e, 6.5 Enzymes.