Scientific Diagram AI

Scientific Diagram Maker

Describe a pathway, a mechanism, an experimental workflow, an apparatus or a cycle, and get a clean labelled science diagram back. Built for the drawings that explain how something works, rather than the charts that plot what you measured.

Pathways and mechanismsWorkflows and apparatusLabelled and print-ready

AI Scientific Diagram Generator

Name the parts, say how they connect, and say which way the process runs.

618 / 2000 characters

Generate a publication-ready PNG from your description.

Preview

Scientific Diagram Examples

Target aspect ratio: 4:3

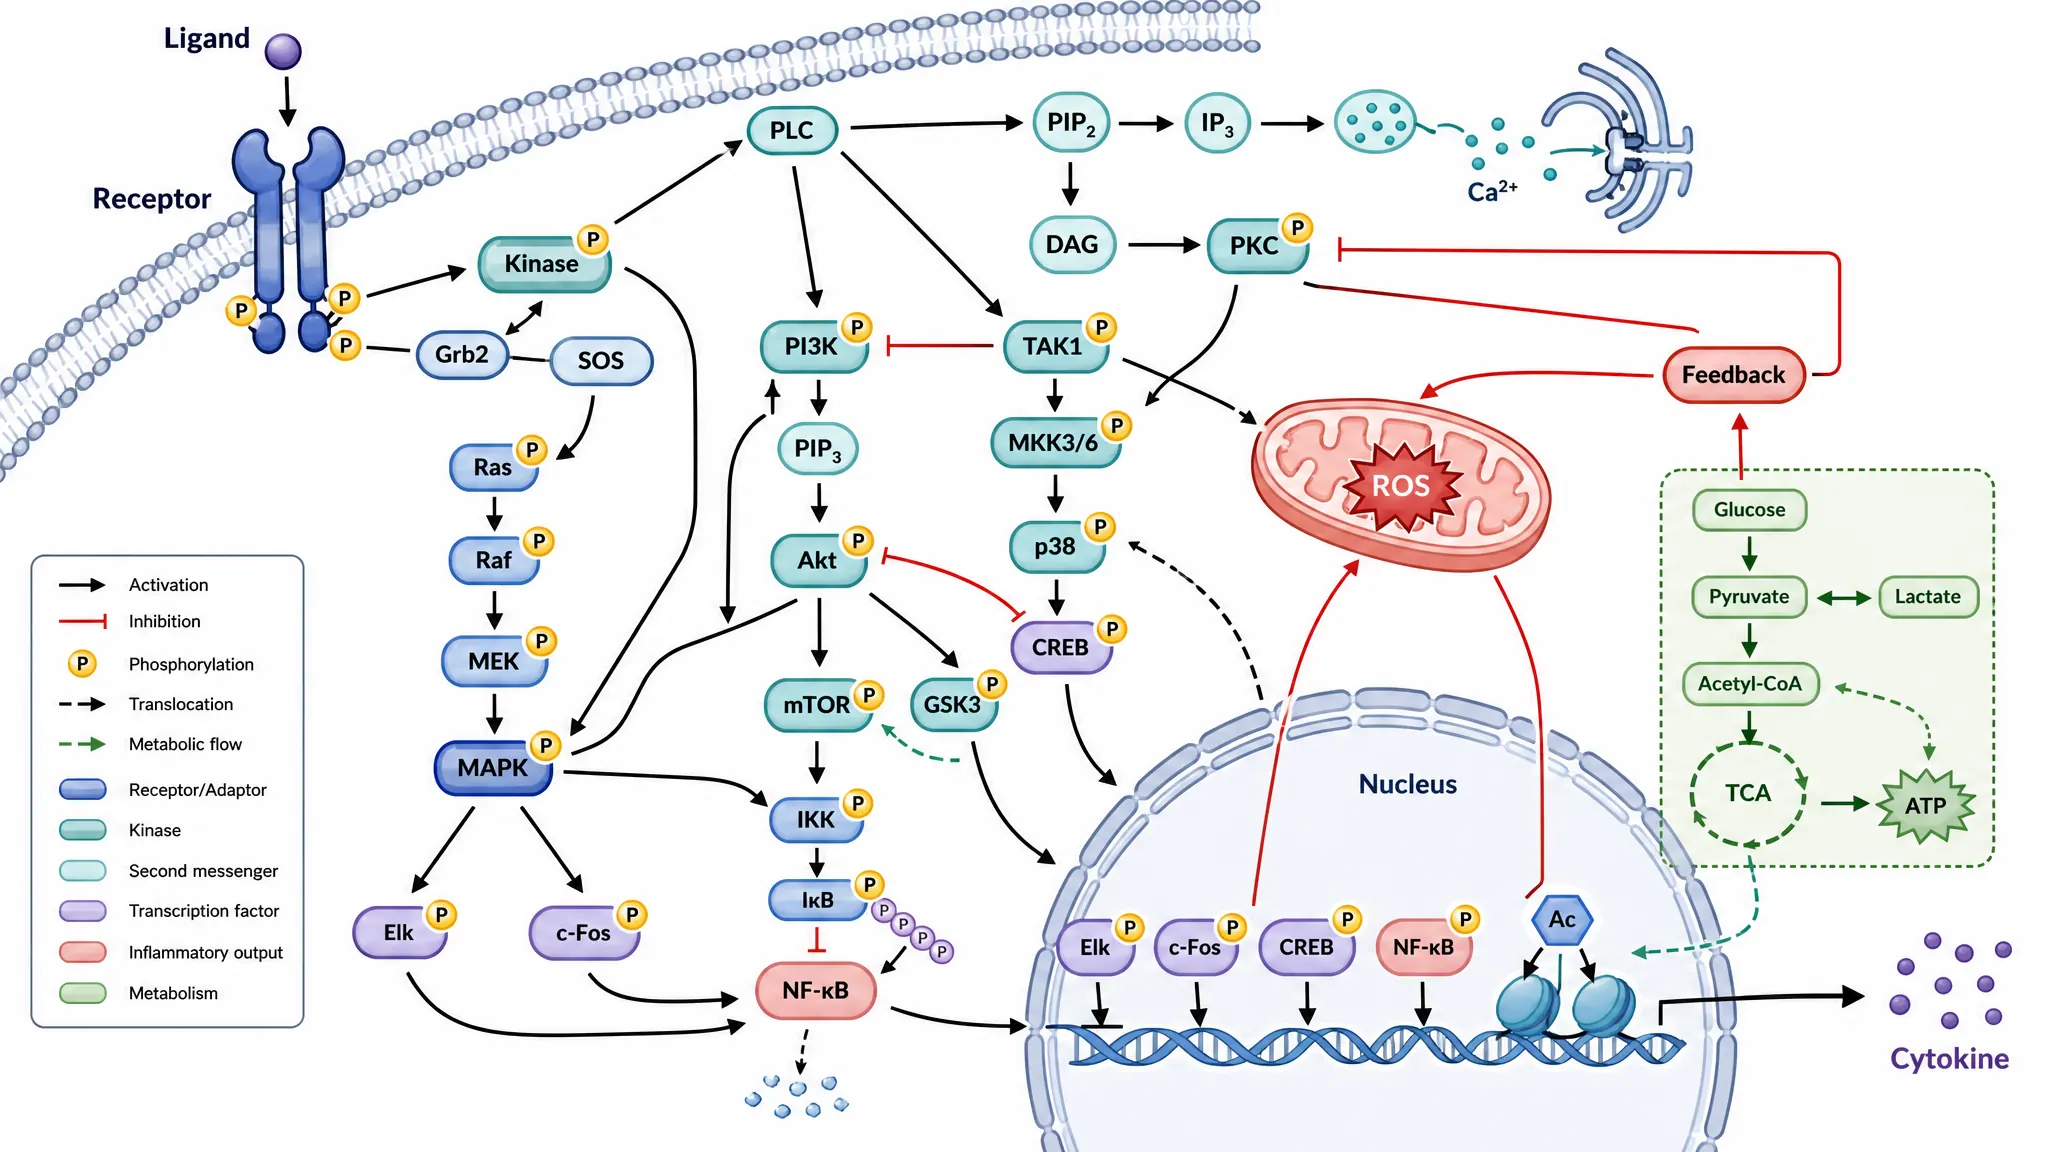
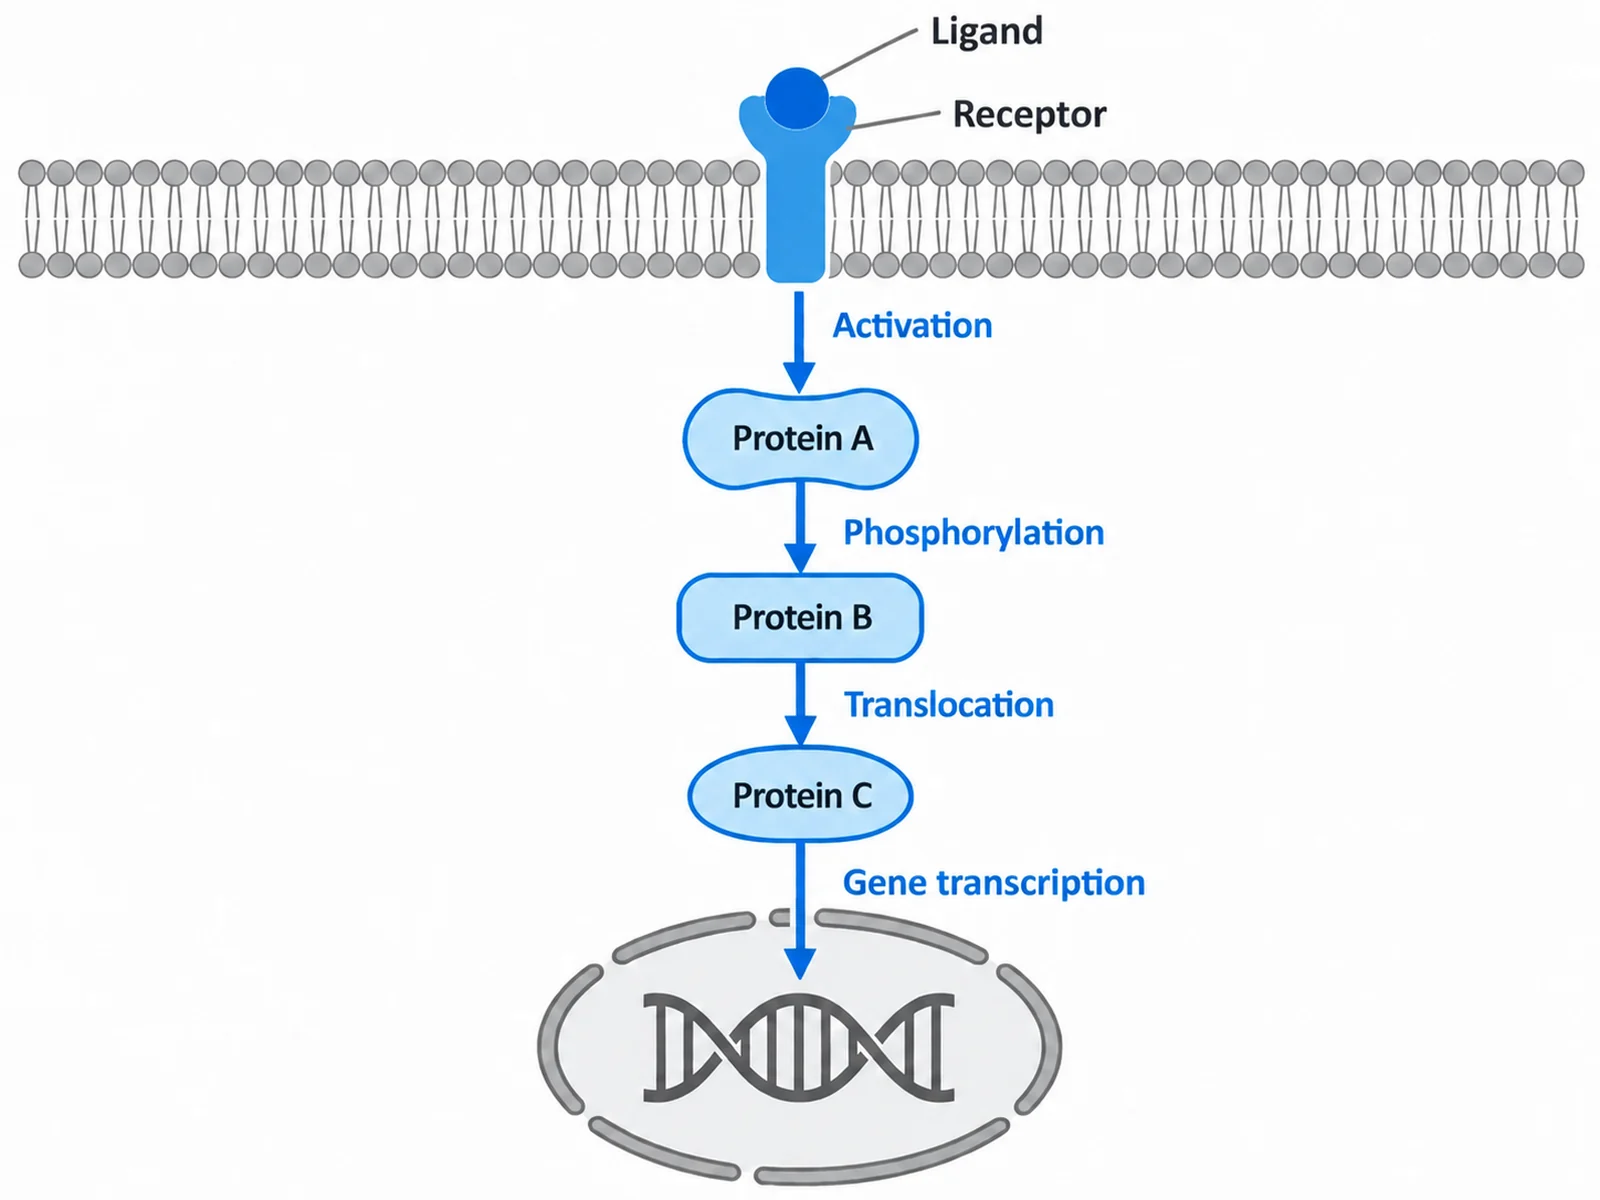
Cell signalling pathway diagram with a ligand binding a membrane receptor and a labelled cascade running to gene transcription in the nucleus
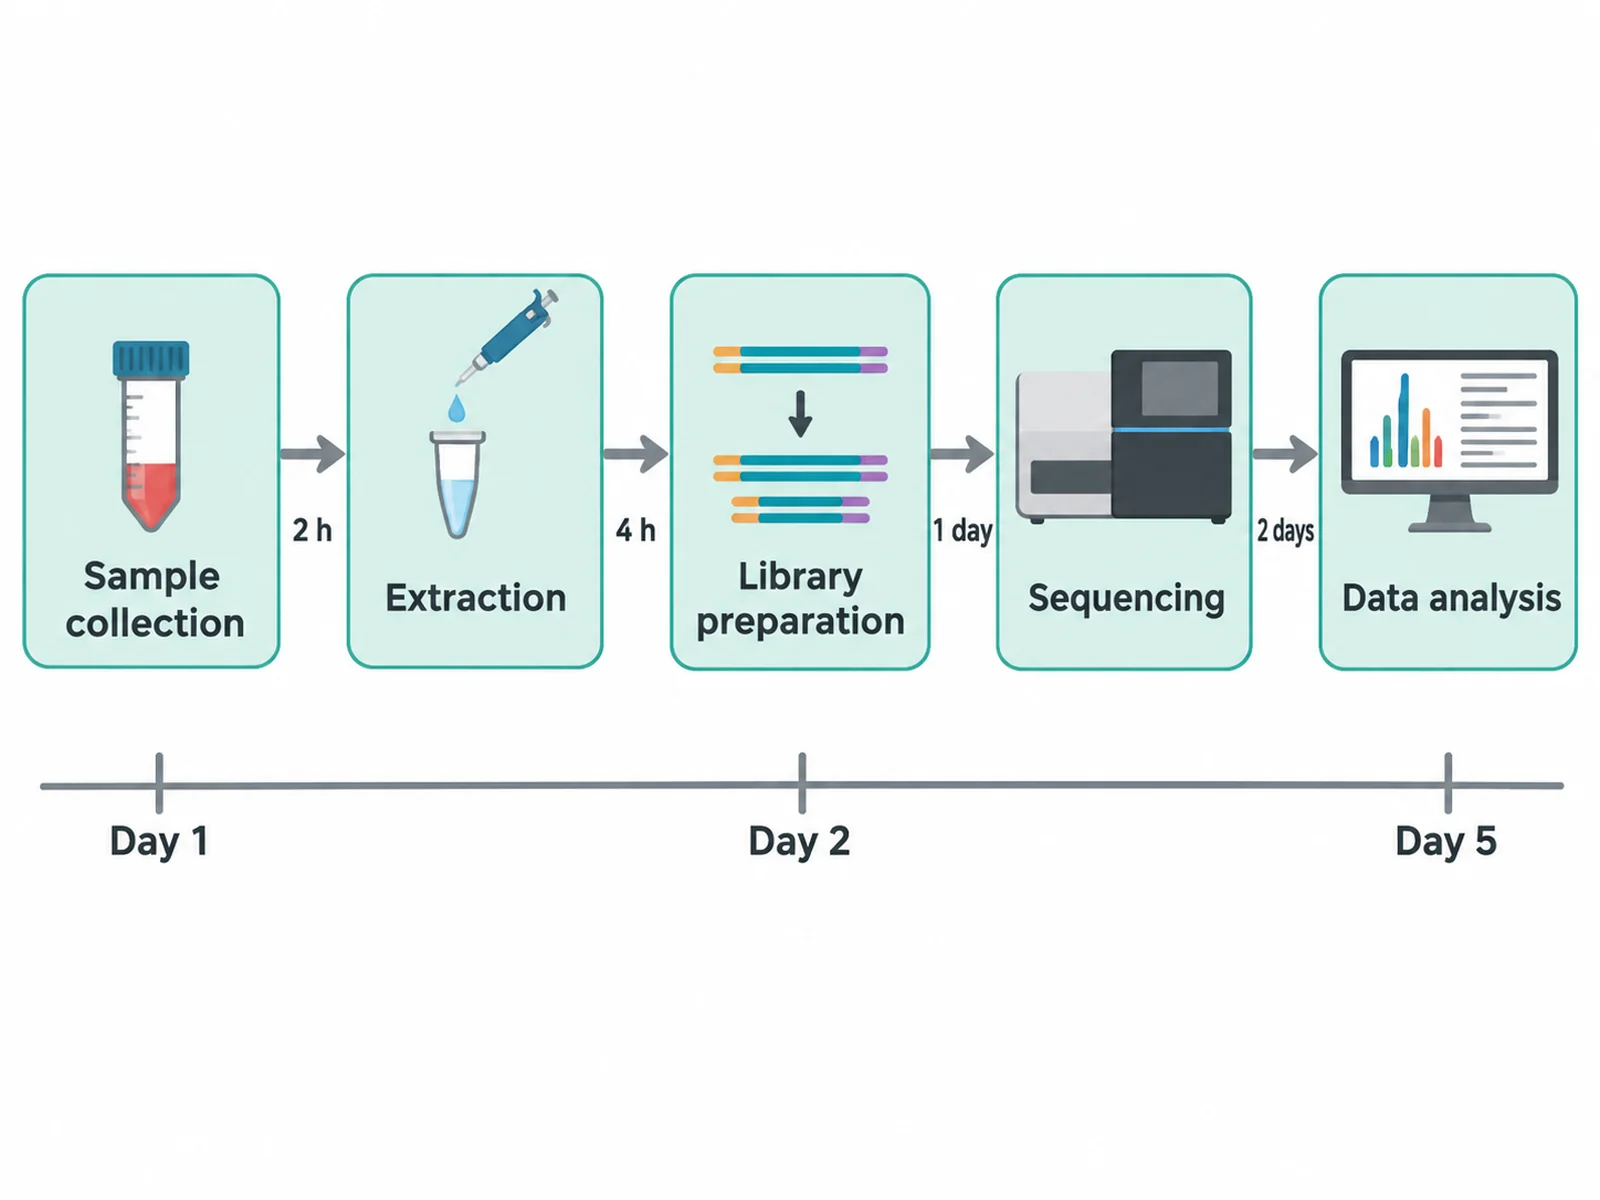
Five-step experimental workflow diagram running left to right from sample collection to data analysis with labelled arrows between steps
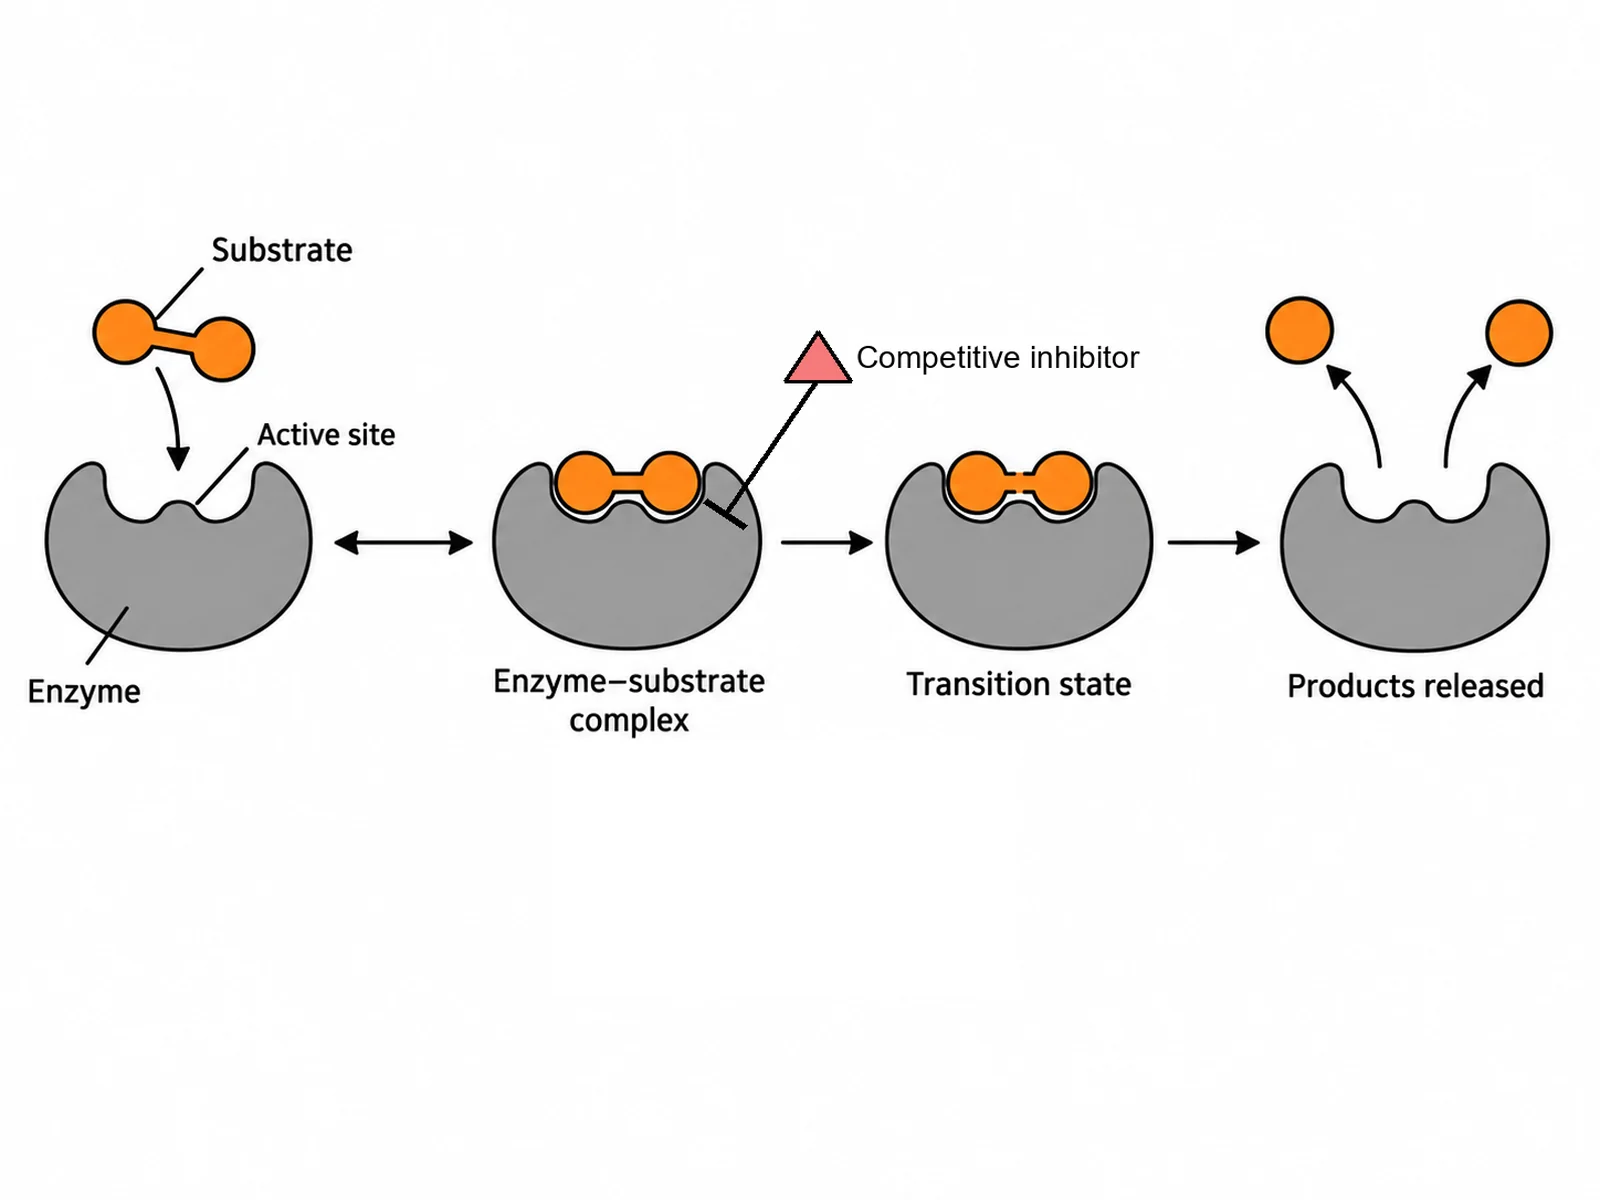
Enzyme mechanism schematic showing substrate binding, the transition state, and product release with a reversible arrow and an inhibition bar

Sample previews. Describe your diagram to generate your own.

Science Diagram Examples

Six kinds of scientific diagram, with the prompt that produced each one: signalling pathways, experimental workflows, mechanism schematics, labelled apparatus, cycles and side-by-side comparisons.

Cell signalling pathway diagram with a ligand binding a membrane receptor and a labelled cascade running to gene transcription in the nucleus

Prompt

Create a labelled cell signalling pathway diagram in flat vector style on a white background. Draw a horizontal band of phospholipid bilayer across the upper third, with a receptor protein spanning it. Outside the cell, draw a small ligand binding to the receptor and label both "Ligand" and "Receptor". Inside the cell, draw a cascade of three labelled protein shapes connected by single-headed arrows, each arrow labelled with the action it performs. End the cascade at a rounded nucleus containing a DNA double helix, with an arrow into it labelled "Gene transcription". Use one blue accent for the active signal path and mid-grey for all other structures. Every arrow must have exactly one source and one target.
Five-step experimental workflow diagram running left to right from sample collection to data analysis with labelled arrows between steps

Prompt

Create a five-step experimental workflow diagram running left to right on a white background. Draw five evenly spaced rounded rectangles labelled "Sample collection", "Extraction", "Library preparation", "Sequencing" and "Data analysis", each with a simple flat icon above its label. Connect them with single-headed arrows, and write the time or throughput for each transition in small grey text beneath its arrow. Add a thin horizontal timeline beneath the whole row marked Day 1, Day 2 and Day 5. Use one teal accent for the boxes and grey for the connectors. Keep every label horizontal and large enough to read at a single journal column width.

Enzyme mechanism schematic showing substrate binding, the transition state, and product release with a reversible arrow and an inhibition bar

Prompt

Create a labelled enzyme mechanism schematic on a white background, drawn as four stages left to right. Stage one: a free enzyme with a shaped active site, labelled "Enzyme" and "Active site". Stage two: a substrate fitting into that site, labelled "Enzyme–substrate complex", joined to stage one by a double-headed arrow to show the step is reversible. Stage three: the same complex with the substrate bond stressed, labelled "Transition state". Stage four: two product shapes leaving a free enzyme, labelled "Products released", joined by a single-headed arrow. Beneath stage two add a small inhibitor shape connected to the active site by a blunt bar, not an arrowhead, labelled "Competitive inhibitor". Flat colours, one accent for the substrate, grey enzyme.

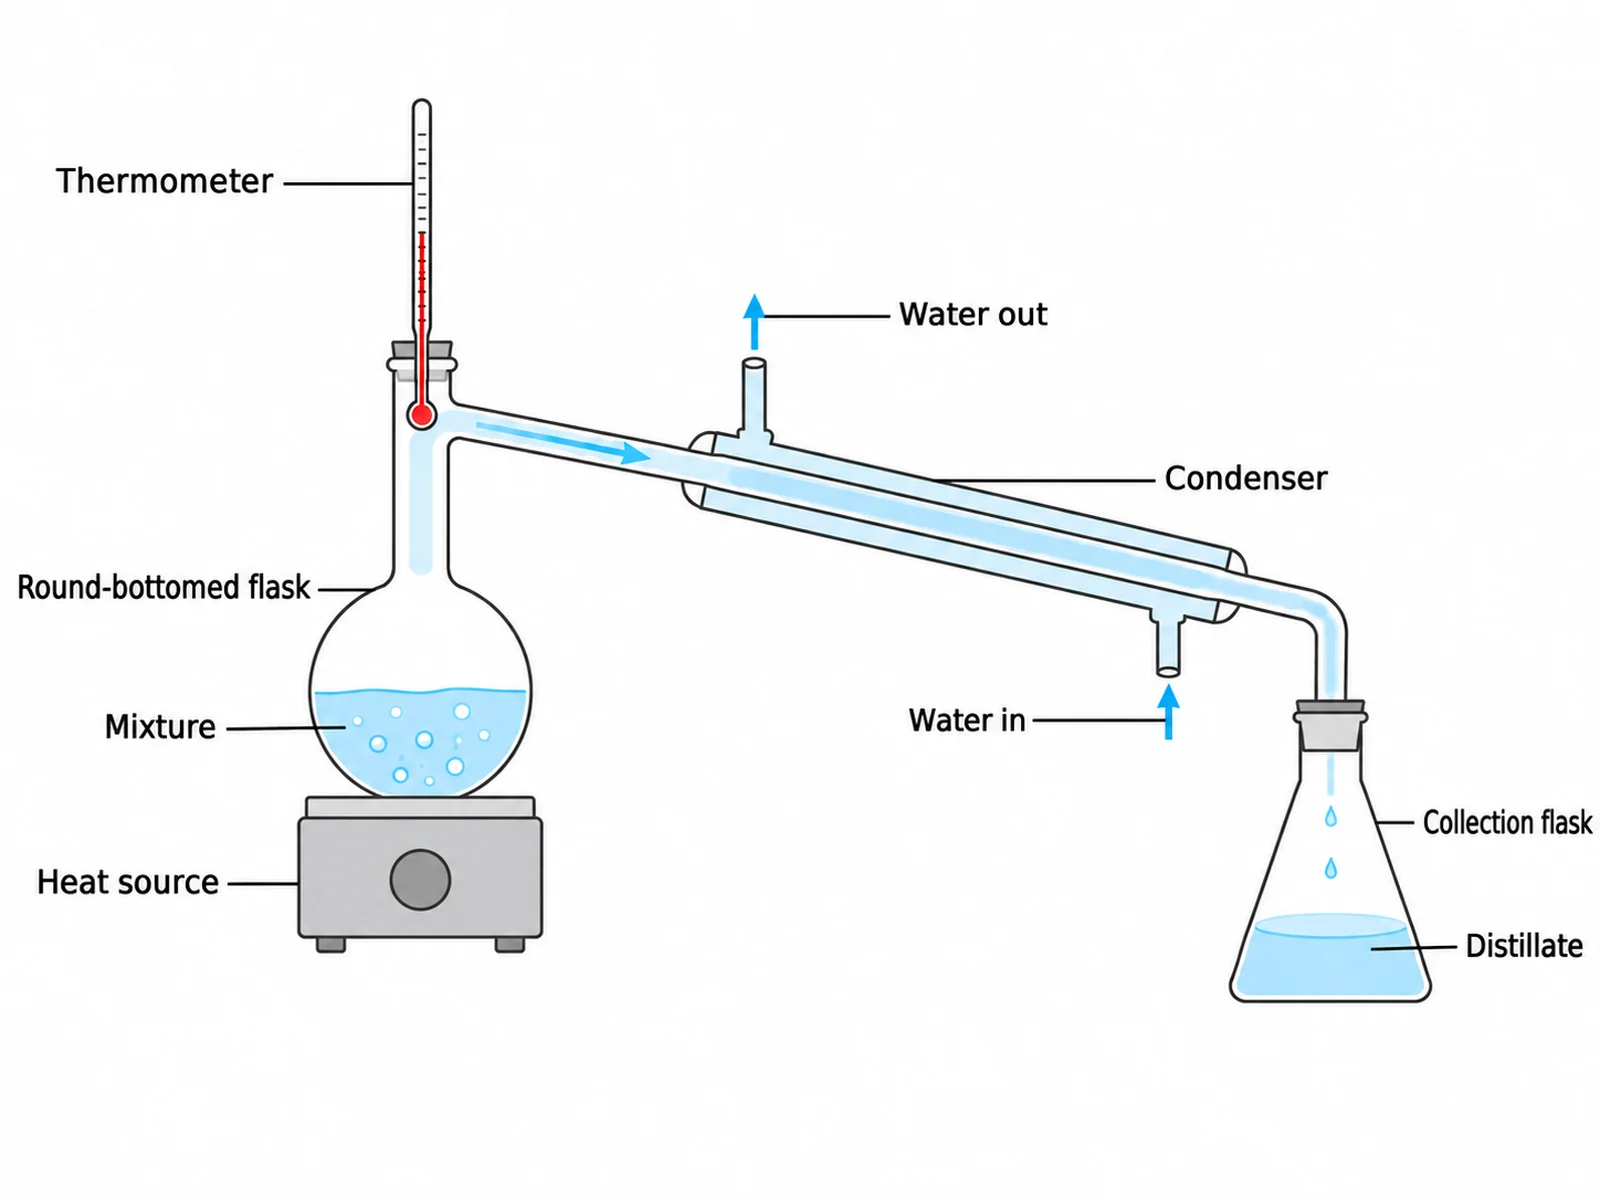
Labelled laboratory apparatus diagram of a distillation setup drawn in cross section with every component named by a straight leader line

Prompt

Create a labelled laboratory apparatus diagram of a simple distillation setup, drawn in clean two-dimensional cross section on a white background in the style of a school science textbook. Show a round-bottomed flask on a heat source, a thermometer with its bulb at the side-arm, a condenser with water in at the bottom and out at the top, and a collection flask. Draw the liquid levels and shade the vapour path in a pale accent colour with a single-headed arrow showing its direction of travel. Label every component with a straight horizontal leader line that touches the part it names: heat source, round-bottomed flask, mixture, thermometer, condenser, water in, water out, distillate, collection flask. No leader lines may cross.

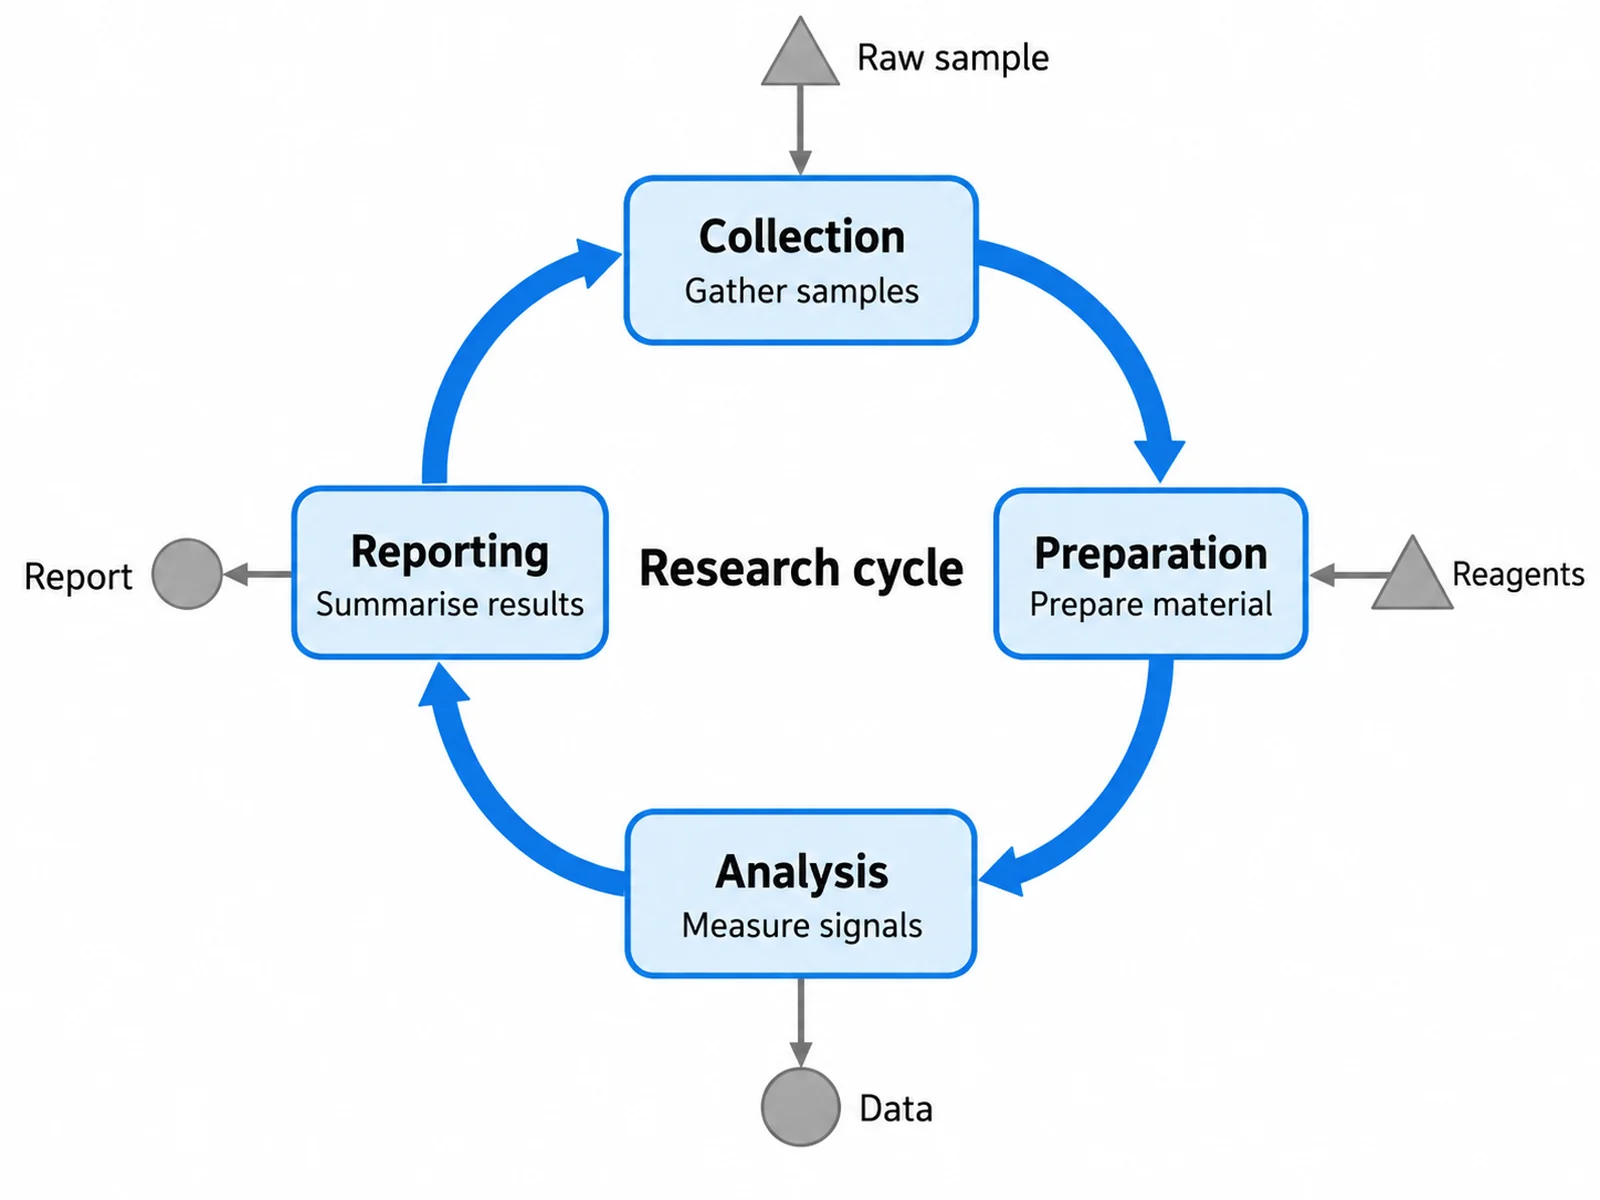
Circular process diagram with four labelled stages connected by curved arrows running clockwise, with inputs and outputs branching off each stage

Prompt

Create a circular process diagram on a white background with four labelled stages arranged around a ring and connected by thick curved single-headed arrows running clockwise, so the direction of the cycle is unmistakable. Give each stage a rounded box, a short title and one line of description beneath it. From each stage, branch one thin straight arrow outward to a small labelled shape showing what enters or leaves at that point, and mark inputs and outputs with different shapes rather than colour alone. Place a short title in the middle of the ring. Use one accent colour for the ring and grey for the branches, flat vector style, no gradients or shadows.

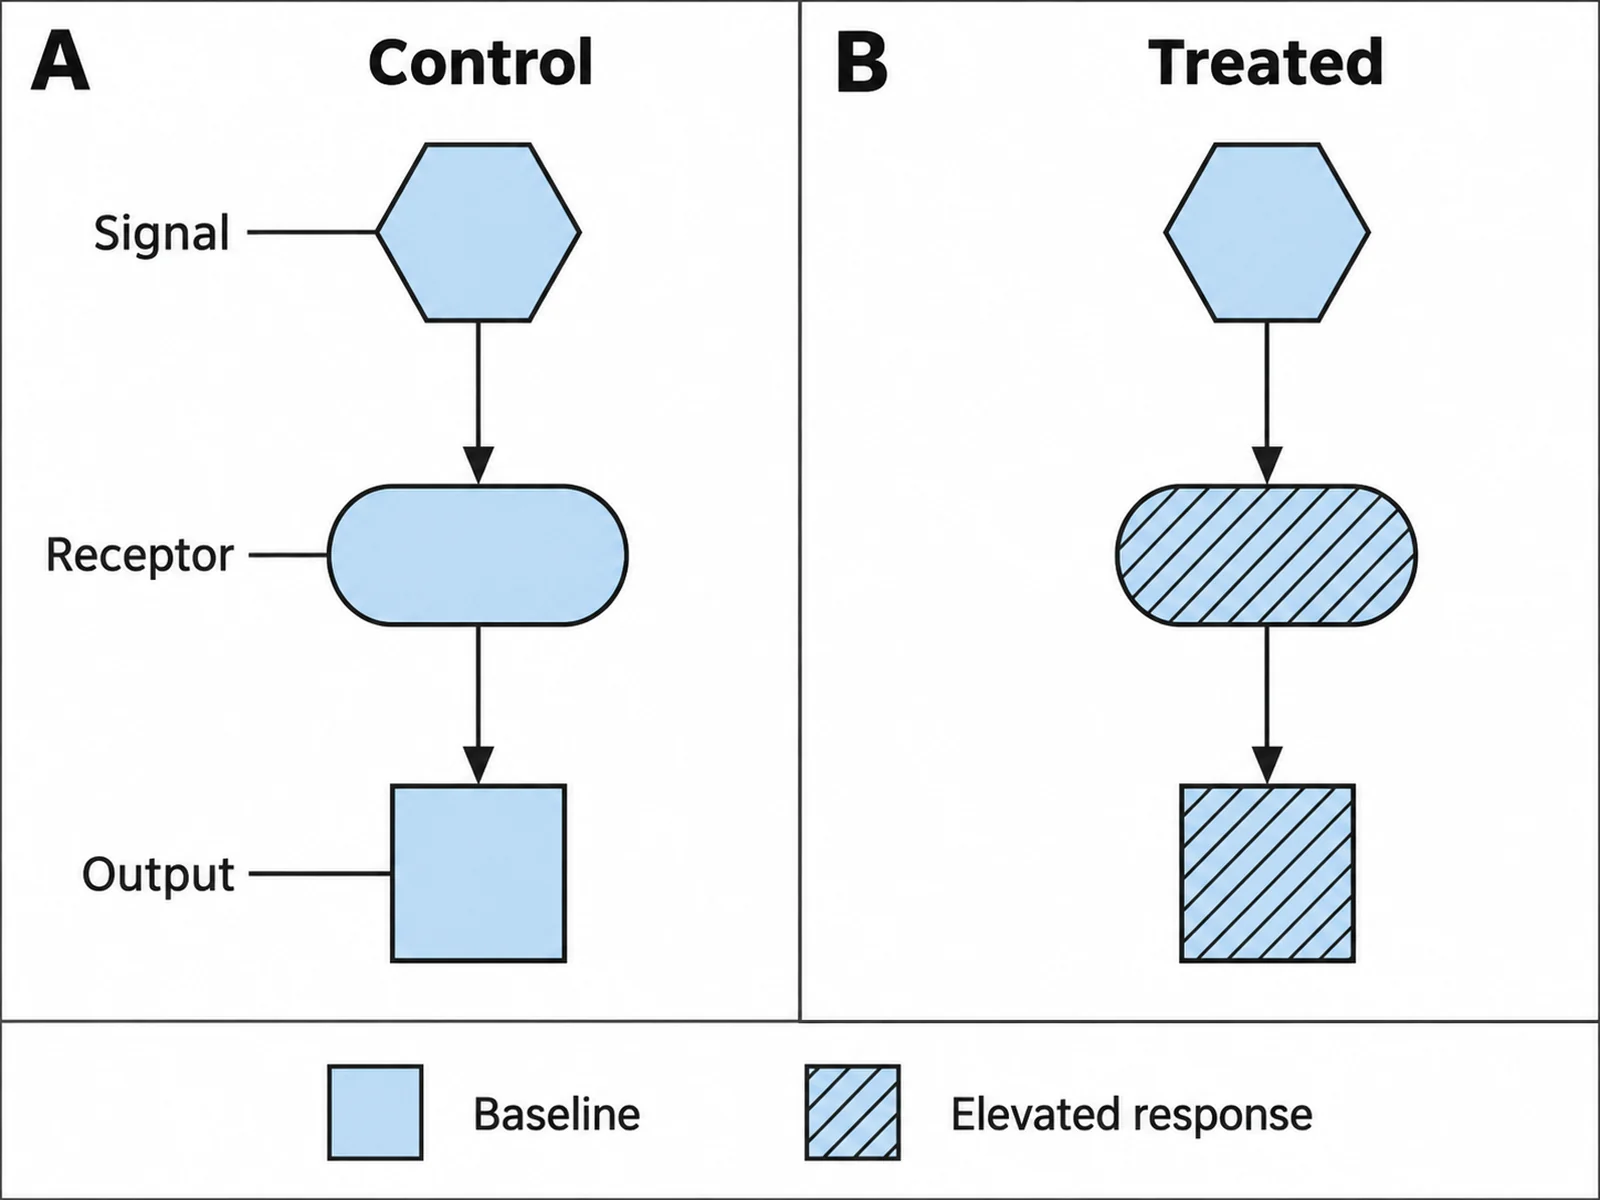
Side-by-side comparison schematic with two labelled panels sharing one legend and aligned rows so equivalent parts sit level with each other

Prompt

Create a side-by-side comparison schematic on a white background. Split the canvas into two equal panels separated by a thin vertical rule, headed "Control" and "Treated". Draw the same three-part structure in both panels — the same shapes, the same sizes, the same positions — and change only what the comparison is about, so equivalent parts sit exactly level with each other across the divide and a reader can scan a row straight across. Label each part once, on the left panel only, with straight leader lines. Beneath both panels place a single shared legend keyed by shape and fill pattern as well as colour, so the difference survives greyscale printing. Mark the panels "A" and "B" in bold at their top-left corners.

How to make a scientific diagram

1

Write the diagram as a sentence first

Say out loud what the reader has to understand: what the parts are, how they connect, and which way the process runs. If you cannot say it in one sentence, the diagram is carrying two ideas and should be two diagrams.

2

Name the boxes and the arrows

Give the generator the actual labels you want, not a topic. "Ligand binds receptor, cascade of three steps, arrow into the nucleus labelled gene transcription" produces a usable diagram; "a cell signalling diagram" produces decoration.

3

Check the arrows, then export

Read every arrow and ask whether its direction is a claim you would defend, confirm no leader line crosses another, then download the PNG at the aspect ratio your journal or slide needs.

What counts as a scientific diagram

A scientific diagram explains structure or process. It is the drawing you reach for when the point is how things relate to each other rather than how large they measured. Five kinds cover almost everything asked for in a paper or a lecture.

  • Pathway diagrams: what acts on what, and in which order — signalling cascades, metabolic routes, regulatory networks.
  • Mechanism schematics: how one thing works, drawn as a sequence of states rather than a network.
  • Workflow and flow diagrams: the order steps were performed in, often with timing, throughput or sample counts attached.
  • Apparatus diagrams: what the equipment was and how it was connected, drawn in flat cross section so the path through it is visible.
  • Cycle diagrams: a process with no beginning, drawn as a ring so the reader does not look for a start.

Diagram, figure, illustration: which one do you need

These three words get used interchangeably and they are not the same thing. Picking the wrong one is why a request comes back looking nothing like what was wanted.

  • A diagram carries relationships. Boxes, arrows, labels. No measured values. That is this page.
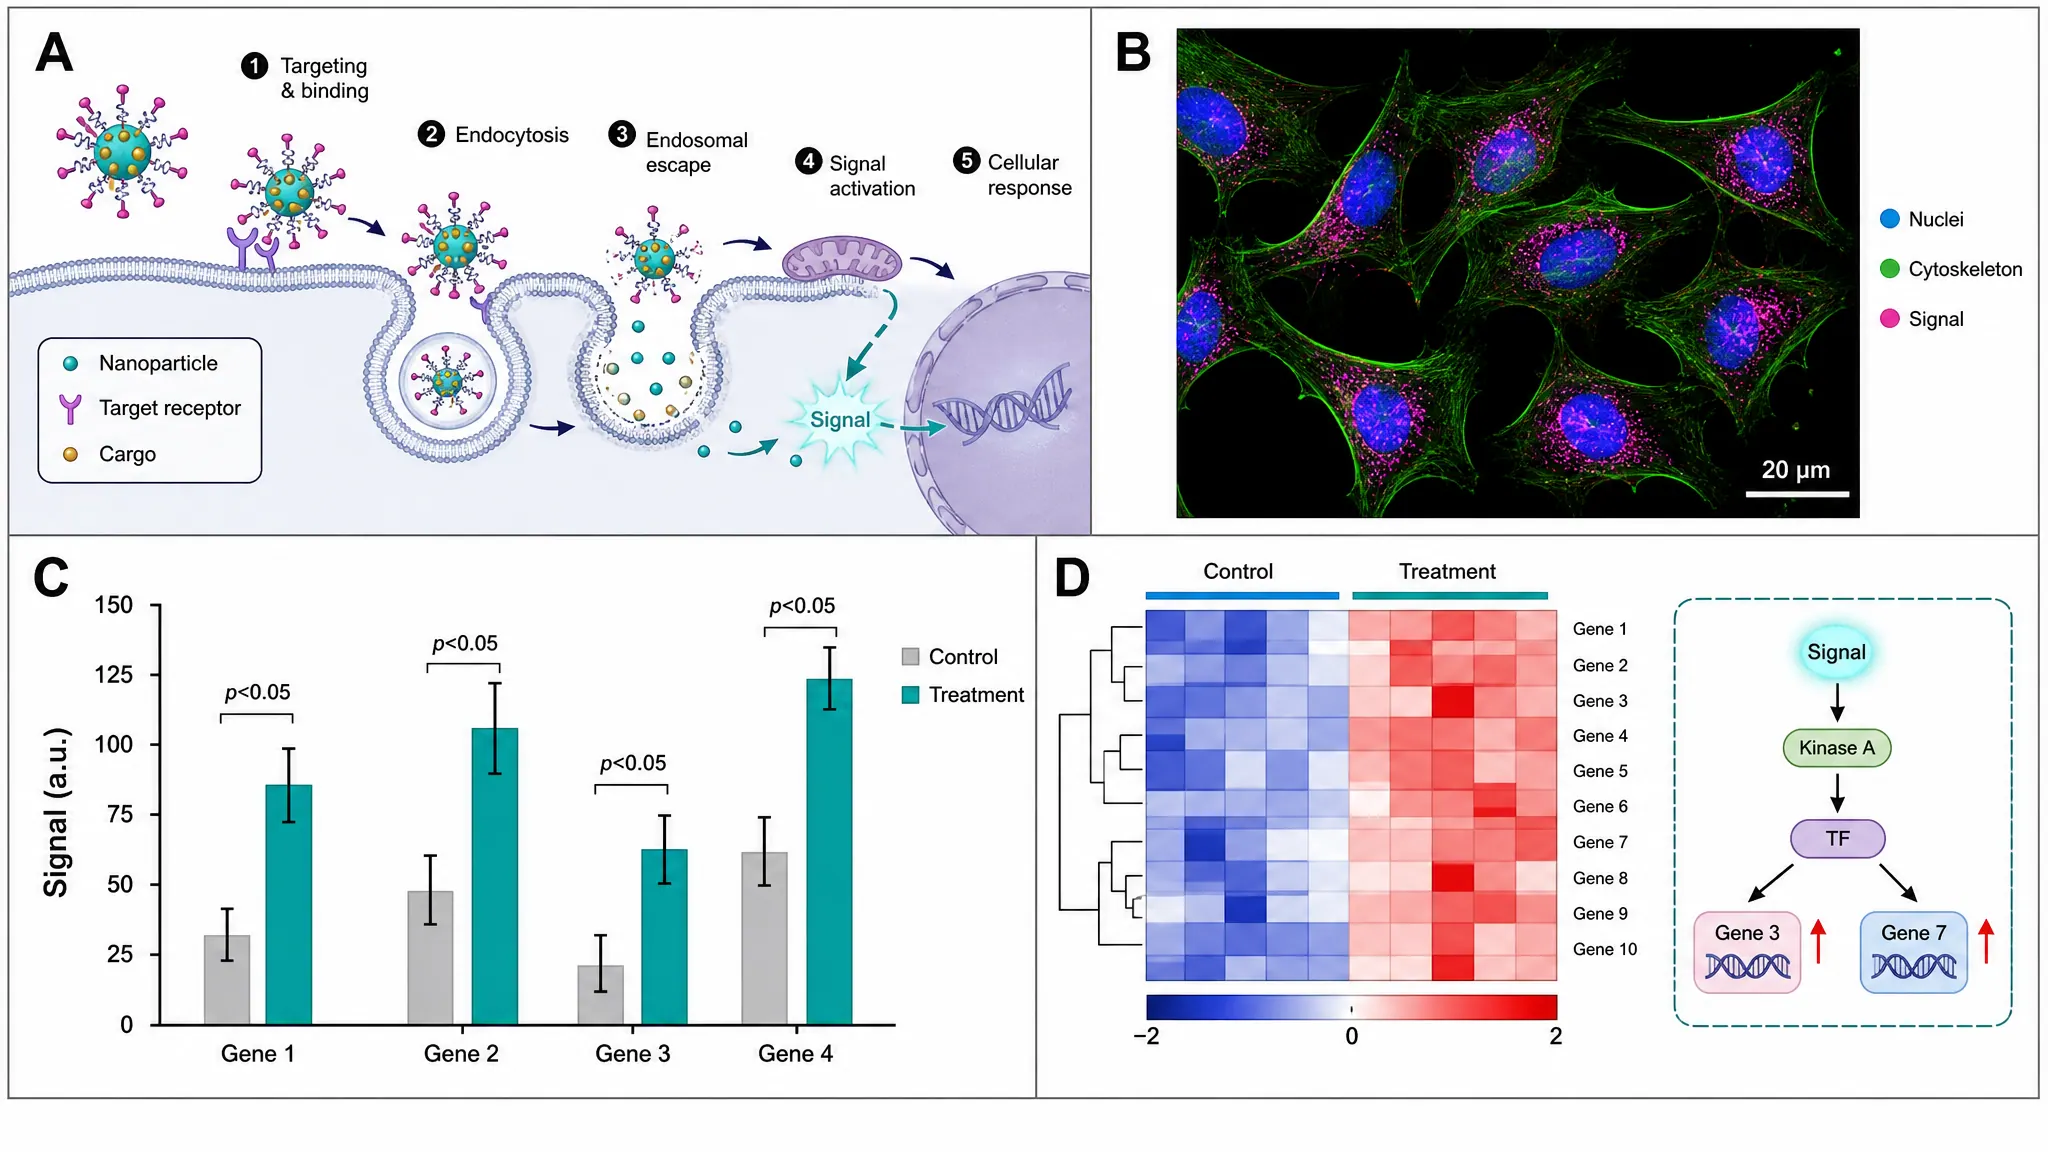
  • A figure is the numbered item in a manuscript, usually assembled from data — plots, gels, micrographs — often across several panels with A, B, C labels. The scientific figure maker handles those.
  • An illustration depicts a thing as it looks: an organism, an organ, a structure, drawn with form and shading. The AI scientific illustration page handles those.
  • One figure can contain all three. A diagram panel beside a plot panel beside a micrograph is an ordinary arrangement, and each panel should be made with the right tool.

What makes a diagram readable

Most diagrams fail on the same handful of mechanical points, and every one of them is checkable without knowing the science.

  • Arrow direction is a claim. A single head means one way, a double head means reversible, a blunt bar means inhibition. An arrow pointing the wrong way is a wrong statement, not a style slip.
  • Leader lines must be straight, must touch what they name, and must never cross. Crossing lines make it ambiguous which label belongs to which part, and an ambiguous label carries no information.
  • One shape must mean one kind of thing throughout. If a rounded box is a process on the left of the diagram, it cannot be a molecule on the right.
  • Colour must never be the only difference between two elements. Around one man in twelve cannot separate red from green, and any diagram may be printed in greyscale.
  • Set the type for the final width. A single journal column is about 85 mm; text that is comfortable on your screen can be illegible once the diagram is placed.

Getting a usable diagram out of a description

The generator draws what it is told. The difference between a diagram you can use and one you throw away is almost always in the request rather than the model.

  • Give the real labels. Write the words you want on the drawing, in the order they should be read.
  • State the direction explicitly: "left to right", "clockwise", "top-down". A diagram with no stated direction gets an arbitrary one.
  • Say what should be emphasised and what should recede. One accent colour on the path being explained, grey for context, is the convention and it works.
  • Name the style: flat vector, textbook line art, cross section. Leaving style unstated is how a schematic comes back as a 3D render with shadows.
  • Ask for the aspect ratio you will actually place: 4:3 for a slide, a taller ratio for a single-column figure, wide for a poster band.

Scientific Diagram Maker FAQ

A drawing that explains how something is arranged or how a process runs, using shapes, arrows and labels rather than measured data. A signalling pathway, an experimental workflow, a labelled apparatus and a nitrogen cycle are all scientific diagrams. If the picture plots numbers you collected, it is a figure or a chart instead.

Need a figure or an illustration instead?

The scientific figure maker assembles multi-panel figures for a manuscript, and the scientific illustration generator draws organisms, anatomy and structures as artwork rather than schematics.