Action Potential AI

Action Potential Graph Generator

Plot a labeled action potential trace with the resting potential at −70 mV, the threshold at −55 mV, a peak at +30 mV, and the hyperpolarisation undershoot to about −80 mV. Ask for the five phases, the ion channels behind each one, a simple curve, or a blank one for students to label.

−70 mV rest to a +30 mV peakUndershoot to −80 mV shownLabeled or blank

AI Action Potential Graph Generator

Describe which phases, ion movements, and axis values to plot.

Costs 5 credits577 / 2000 characters

Generate a publication-ready PNG from your description.

Preview

Action Potential Graph Example Previews

Target aspect ratio: 16:9

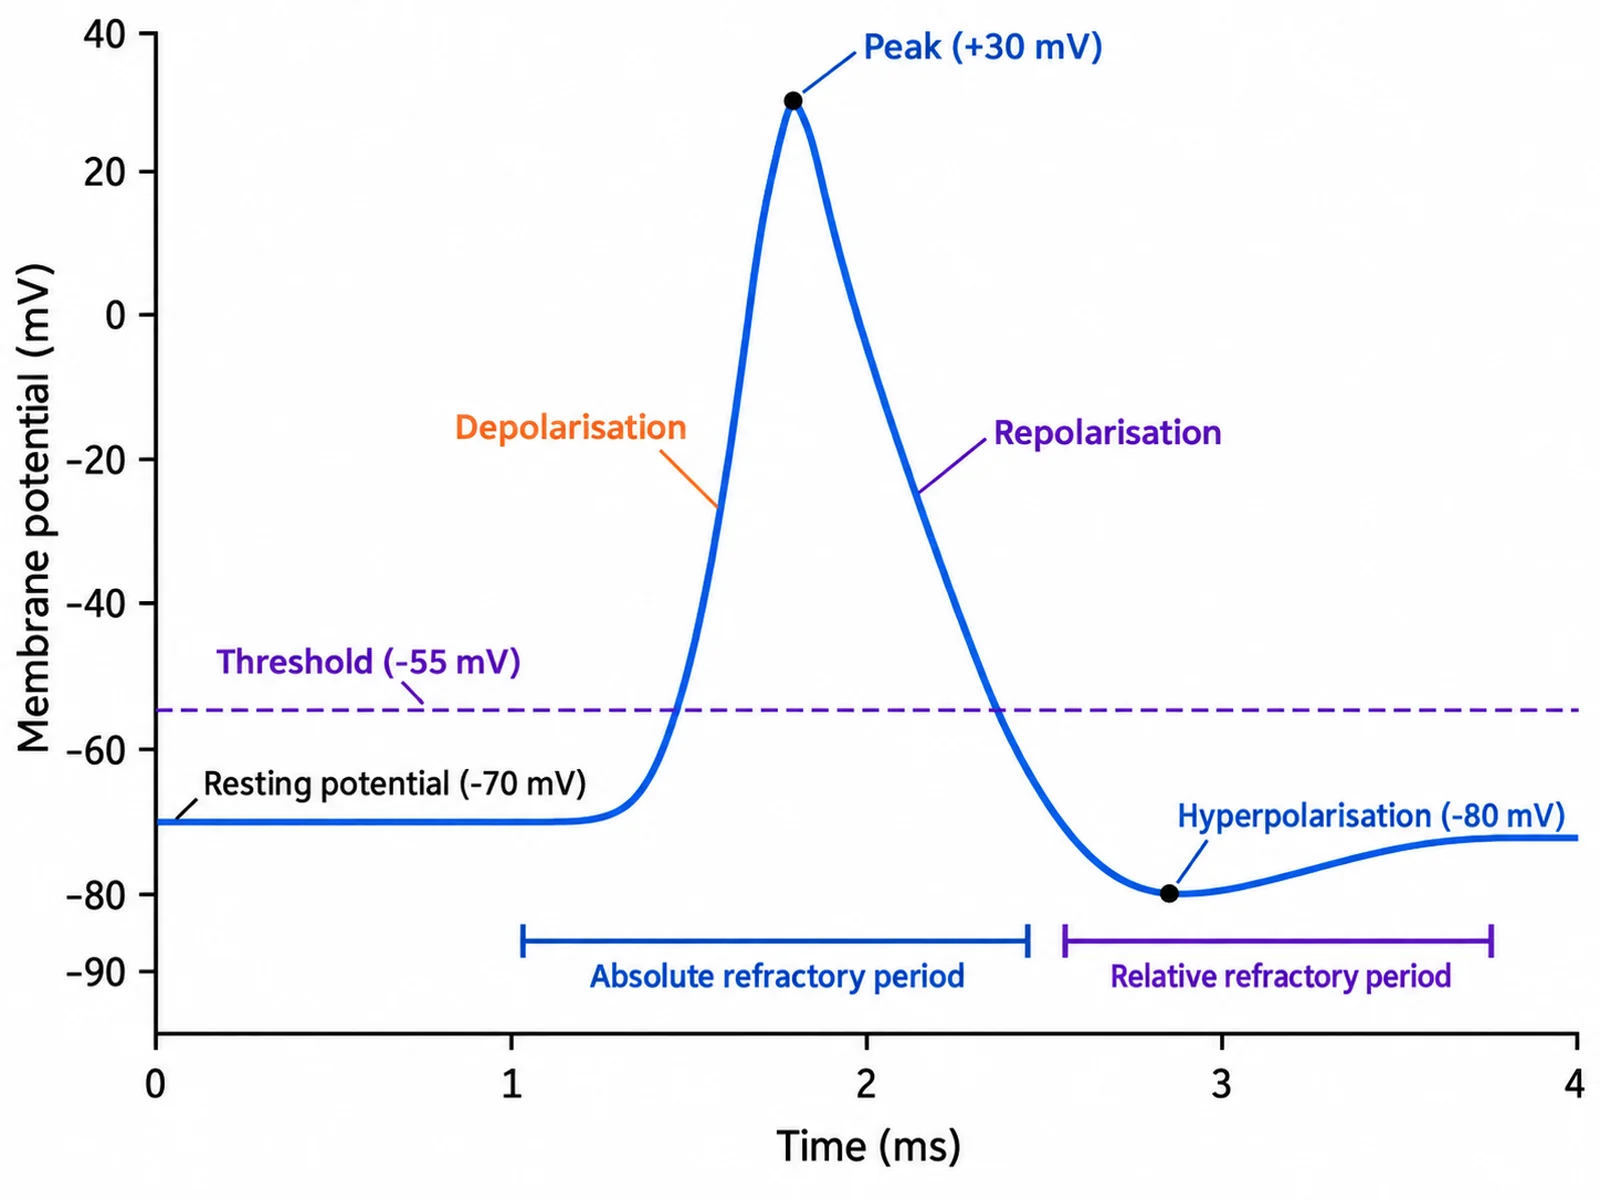
Labeled action potential graph plotting membrane potential in millivolts against time in milliseconds, with the resting potential at −70 mV, threshold at −55 mV, peak at +30 mV, and hyperpolarisation undershoot to −80 mV
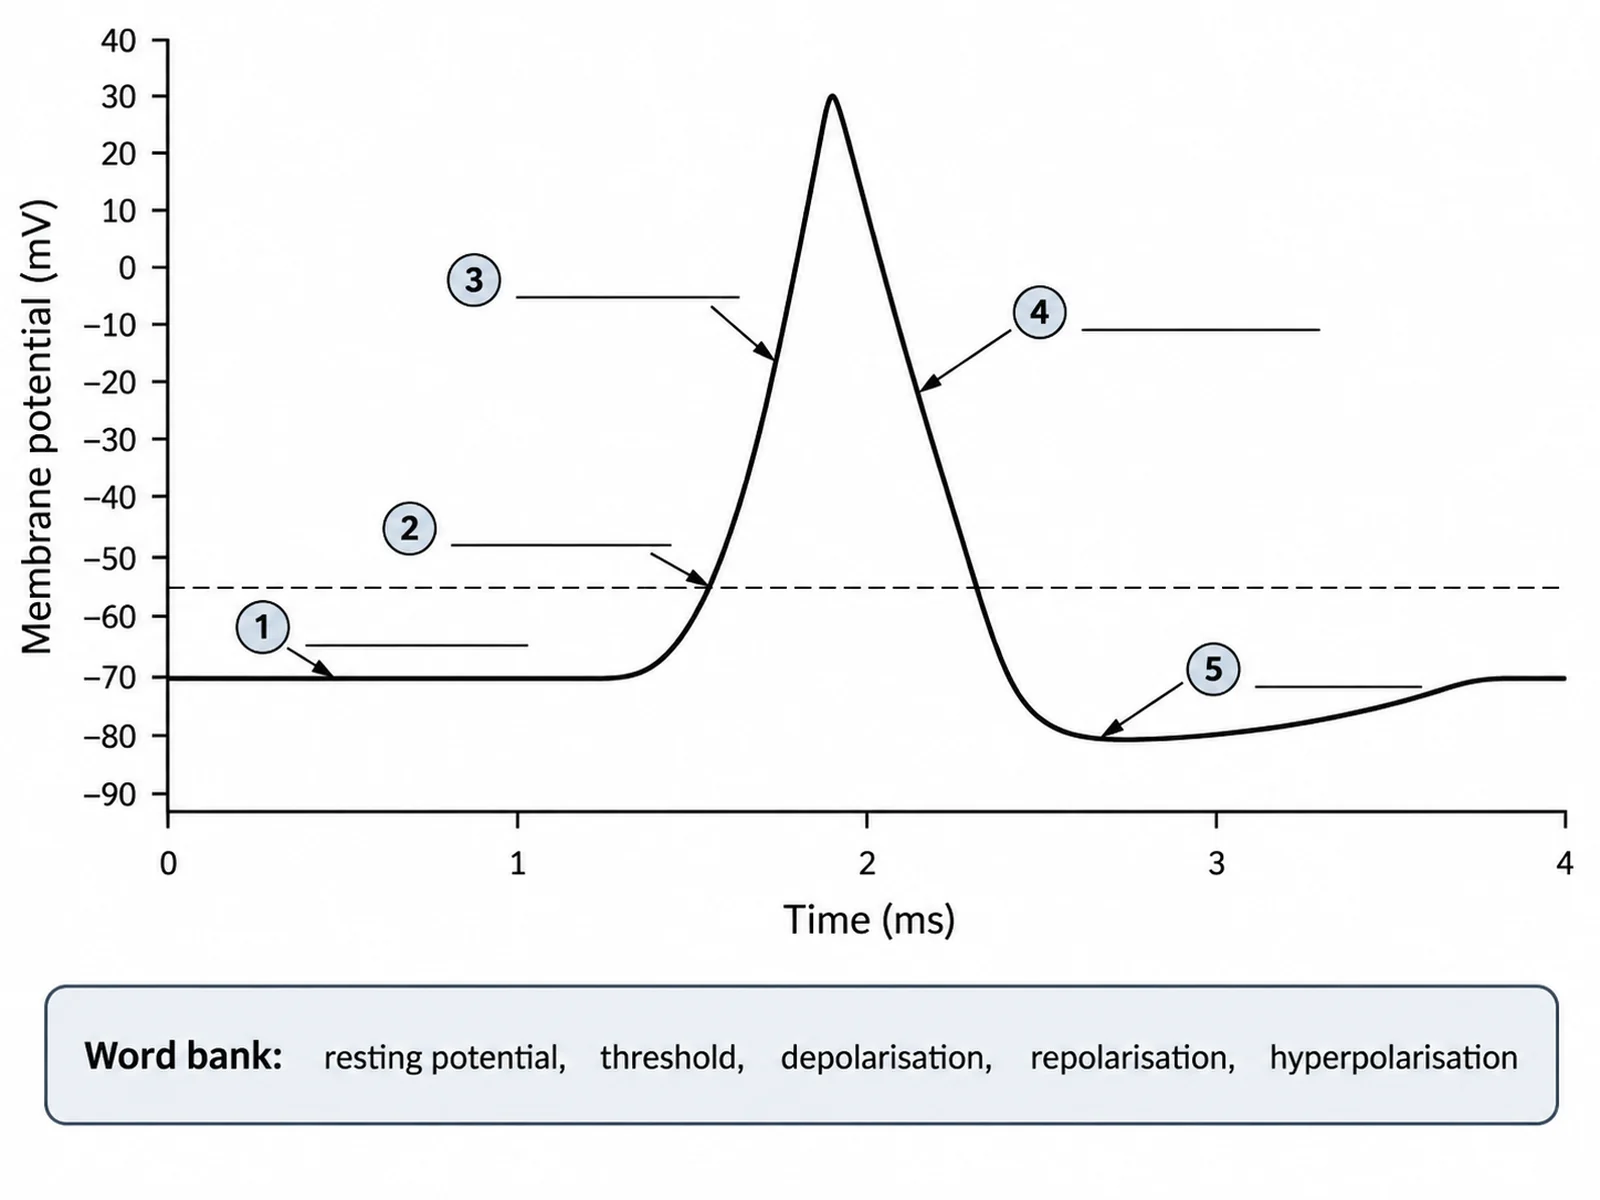
Blank unlabeled action potential graph with numbered millivolt and millisecond axes, empty label lines, and a word bank for students to complete
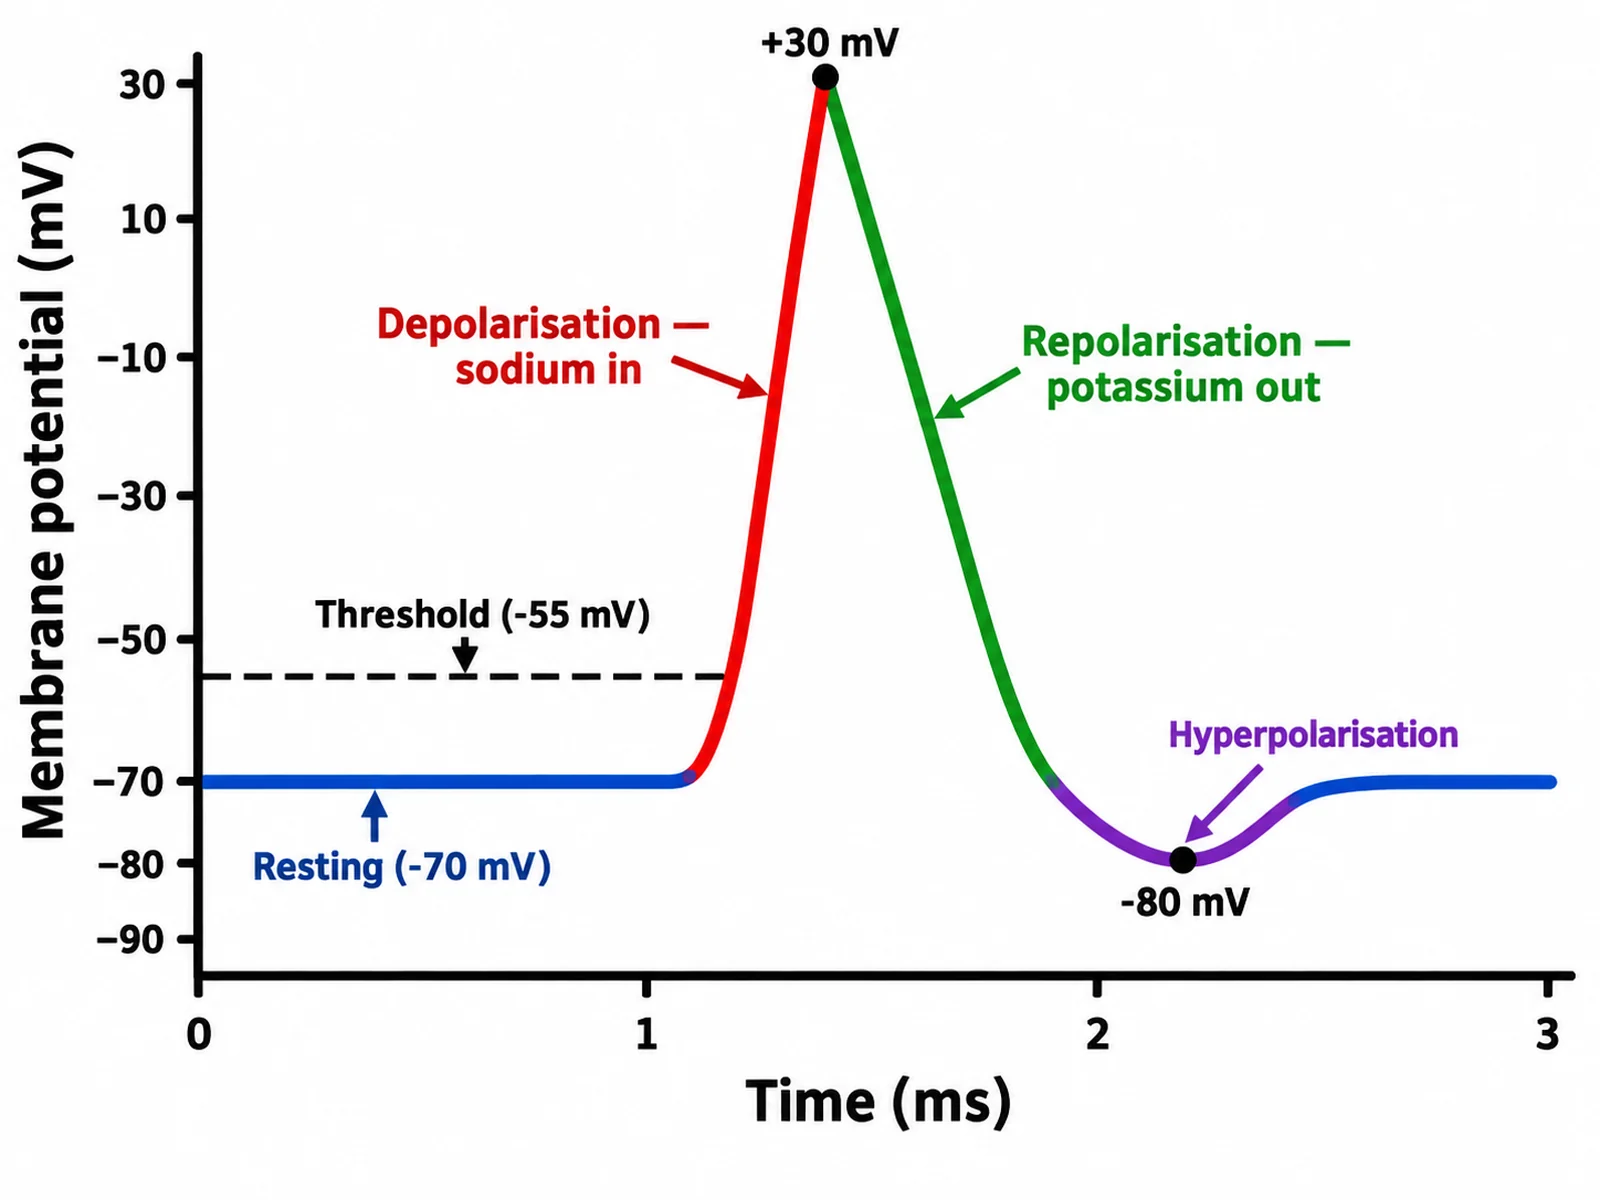
Simple bold action potential curve for younger students with five large labels and the key millivolt values marked

Sample previews. Describe your graph to generate your own action potential figure.

Action Potential Graph Examples

Use these as visual directions for labeled traces, blank worksheets, simple curves, five-phase breakdowns, ion channel figures, and saltatory conduction diagrams.

Labeled action potential graph plotting membrane potential in millivolts against time in milliseconds, with the resting potential at −70 mV, threshold at −55 mV, peak at +30 mV, and hyperpolarisation undershoot to −80 mV

Prompt

Create a labeled action potential graph on a white background in clean biology textbook style. Label the y axis "Membrane potential (mV)", scaled −90 to +40, and the x axis "Time (ms)", 0 to 4. Draw a flat line at −70 mV labeled "Resting potential (−70 mV)", a dashed line at −55 mV labeled "Threshold (−55 mV)", a very steep rise to a sharp peak at +30 mV labeled "Depolarisation", a slightly less steep fall labeled "Repolarisation", and a dip to about −80 mV labeled "Hyperpolarisation" before the trace returns to rest. Bracket "Absolute refractory period" under the rise and most of the fall, "Relative refractory period" under the rest. Never a rounded bell.
Labeled Action Potential Graph

Blank unlabeled action potential graph with numbered millivolt and millisecond axes, empty label lines, and a word bank for students to complete

Prompt

Create a blank action potential worksheet. Draw the curve in plain black line art with both axes numbered — y axis "Membrane potential (mV)", −90 to +40, x axis "Time (ms)", 0 to 4 — and no phase names on the figure. The trace must still start flat at −70 mV, cross a dashed threshold line at −55 mV, rise very steeply to a sharp peak at +30 mV, fall, dip below rest to about −80 mV, then return to −70 mV. Draw thin leader lines from five points on the trace to numbered ruled blanks, 1 to 5. Add a word bank reading "resting potential, threshold, depolarisation, repolarisation, hyperpolarisation". No answer key.

Blank Action Potential to Label

Simple bold action potential curve for younger students with five large labels and the key millivolt values marked

Prompt

Create a simple action potential graph for younger students in bold flat colours with thick outlines and large text. Plot one curve: a flat start at −70 mV labeled "Resting (−70 mV)", a dashed line at −55 mV labeled "Threshold (−55 mV)", a steep rise to a sharp peak at +30 mV labeled "Depolarisation — sodium in", a gentler fall labeled "Repolarisation — potassium out", and a clear dip to about −80 mV labeled "Hyperpolarisation" before the return to rest. Label the y axis "Membrane potential (mV)" and the x axis "Time (ms)", about 2 to 3 ms in total. Only these five labels. Sharp peak, not a rounded hump.

Simple Action Potential Curve

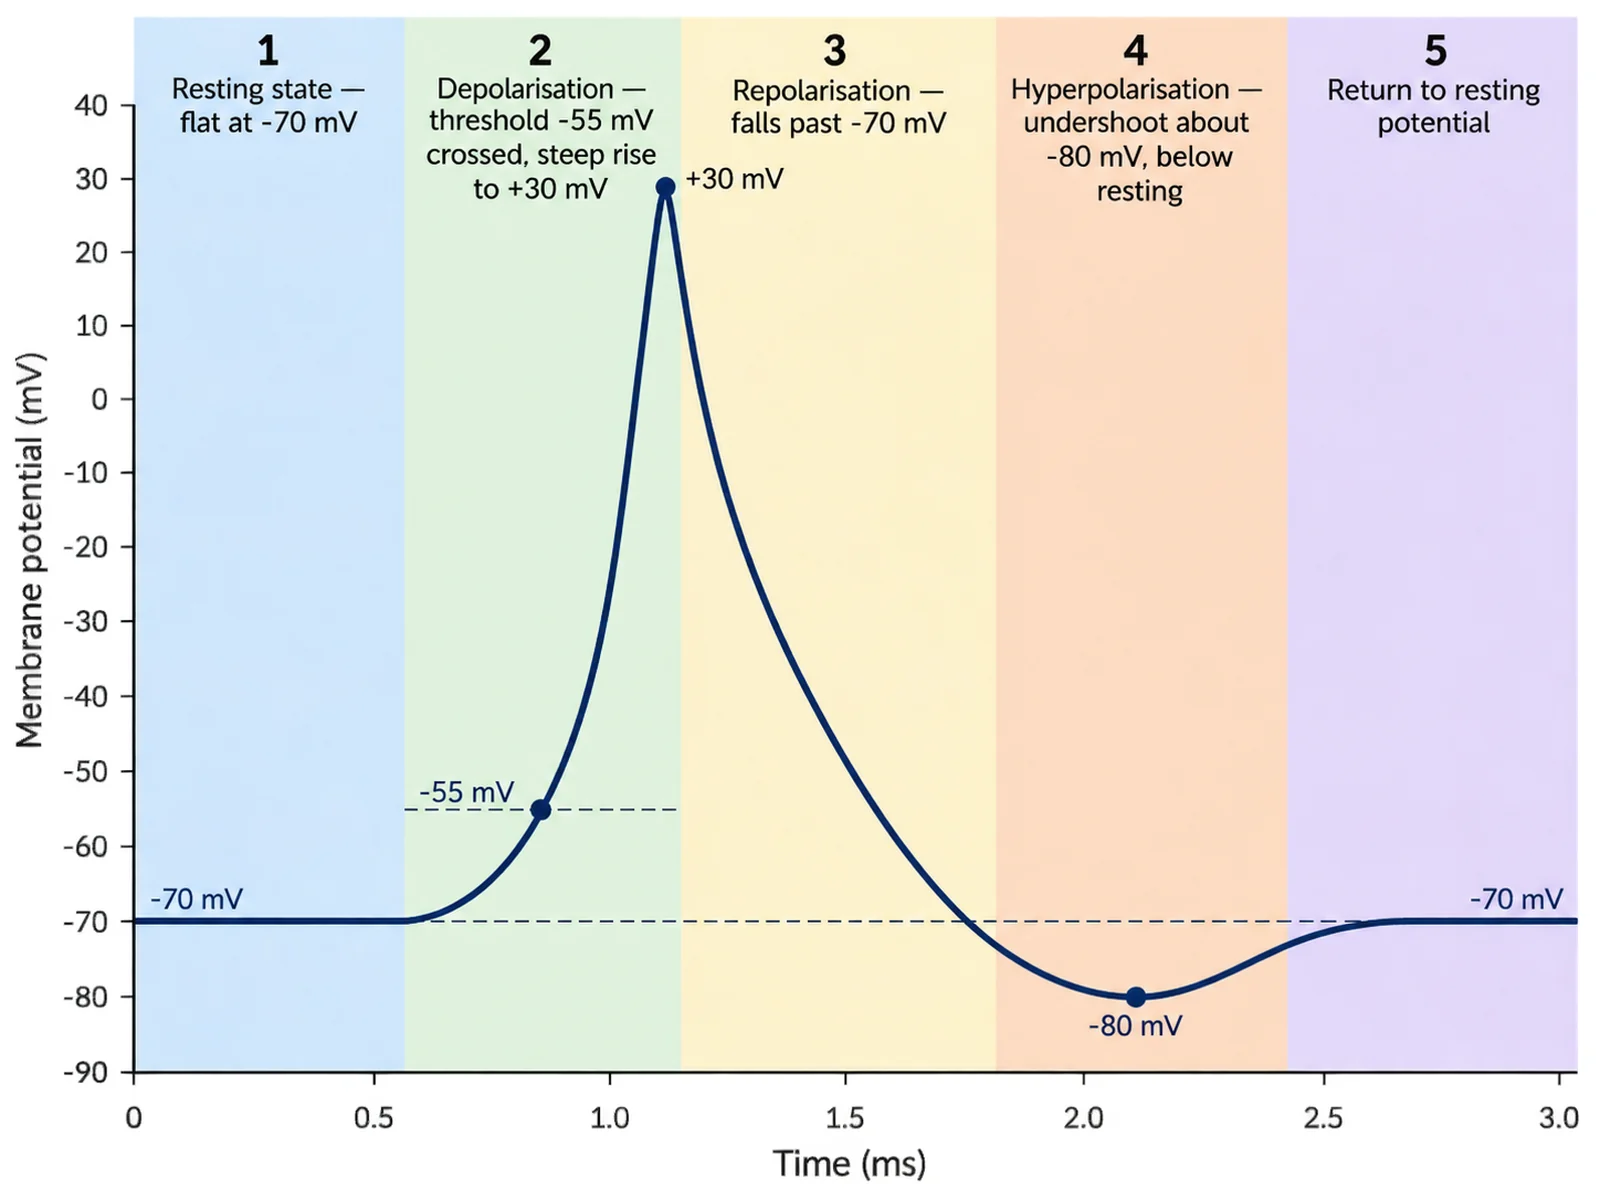
Action potential graph split into five shaded phases from the resting state through depolarisation, repolarisation, and hyperpolarisation back to rest

Prompt

Create a labeled action potential graph divided into five numbered phases by shaded vertical bands with captions: "1 Resting state — flat at −70 mV", "2 Depolarisation — the −55 mV threshold is crossed and the trace climbs steeply to +30 mV", "3 Repolarisation — the trace falls back down past −70 mV", "4 Hyperpolarisation — the undershoot to about −80 mV, below resting", "5 Return to the resting potential". Label the y axis "Membrane potential (mV)", −90 to +40, and the x axis "Time (ms)", about 3 ms. Keep the rise steeper than the fall and the peak sharp; the undershoot is required, not optional.

The Five Phases

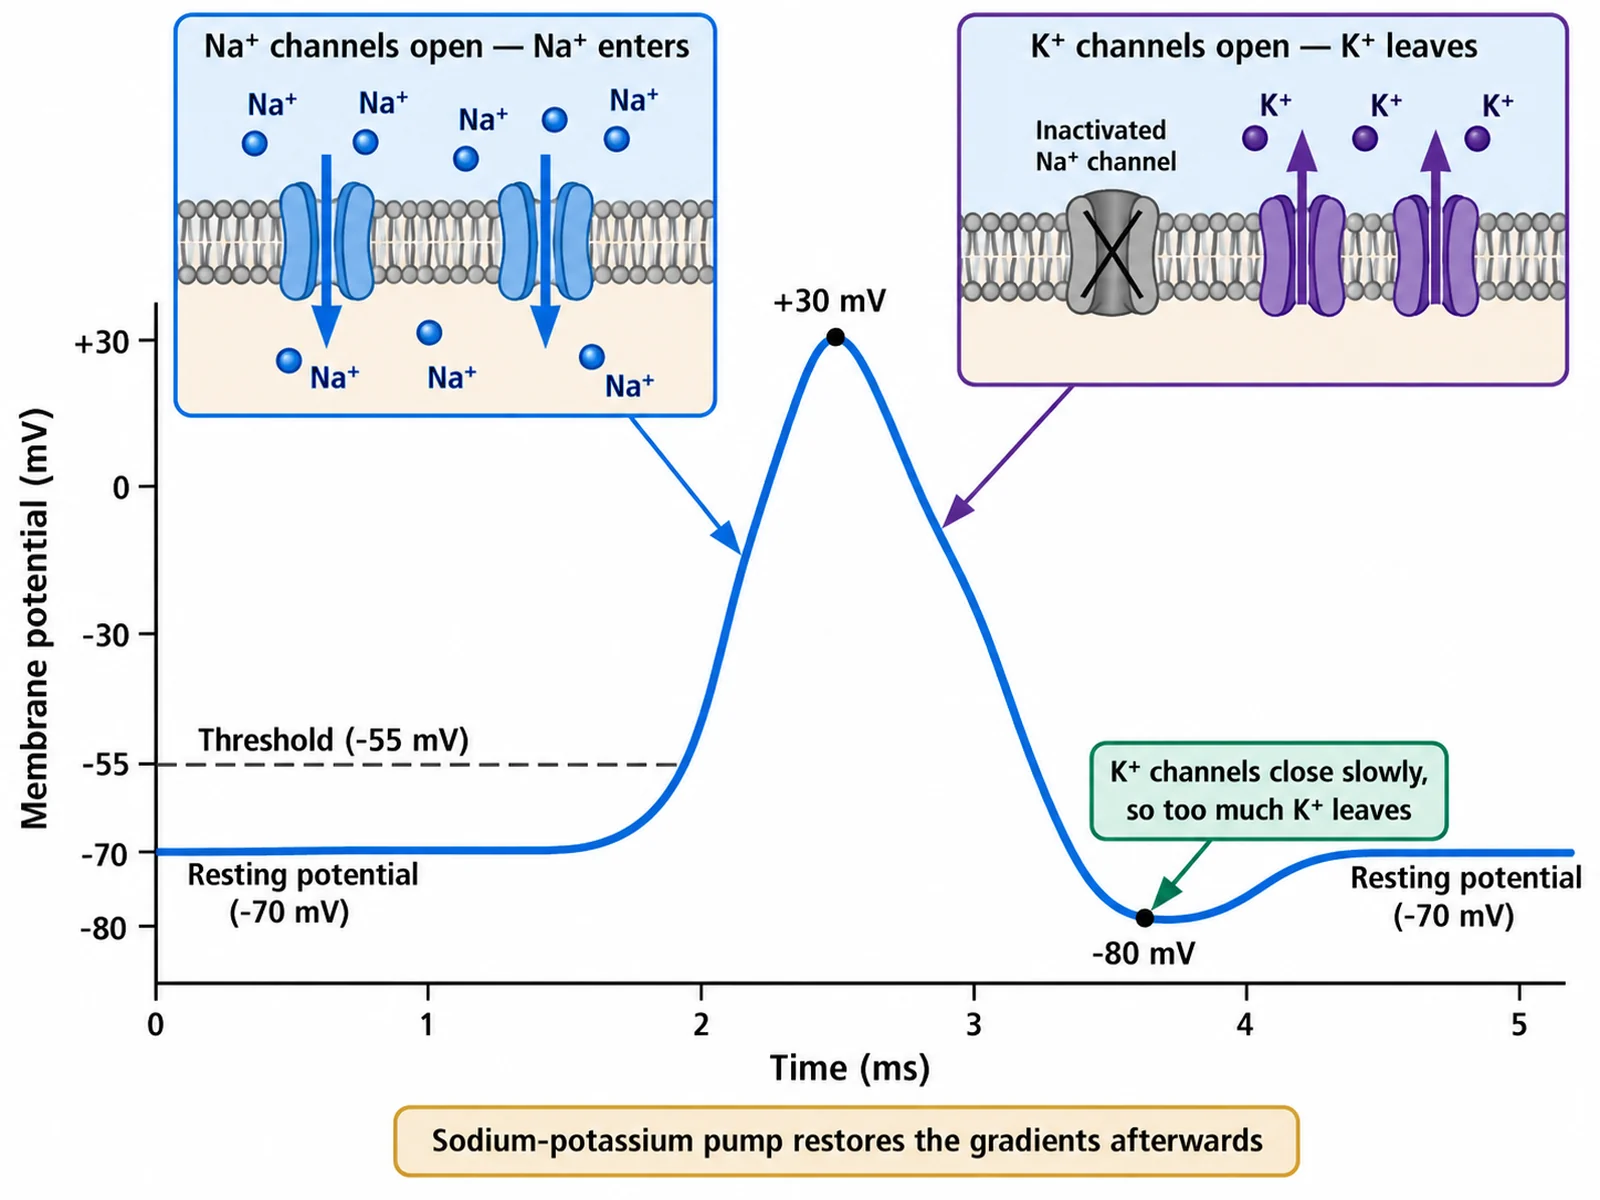
Action potential graph with membrane insets showing sodium entering the cell during depolarisation and potassium leaving during repolarisation

Prompt

Create an action potential graph with ion channel insets. Plot the trace: rest at −70 mV, threshold at −55 mV, a steep rise to a sharp +30 mV peak, a gentler fall, an undershoot to about −80 mV, then return to rest. Above the rising phase draw a membrane inset with open voltage-gated sodium channels and arrows pointing INTO the cell, labeled "Na⁺ channels open — Na⁺ enters". Above the falling phase draw inactivated sodium channels beside open potassium channels with arrows pointing OUT of the cell, labeled "K⁺ channels open — K⁺ leaves". Over the undershoot add "K⁺ channels close slowly, so too much K⁺ leaves". Note "Sodium-potassium pump restores the gradients afterwards". Never reverse these arrows.

Ion Channels at Each Phase

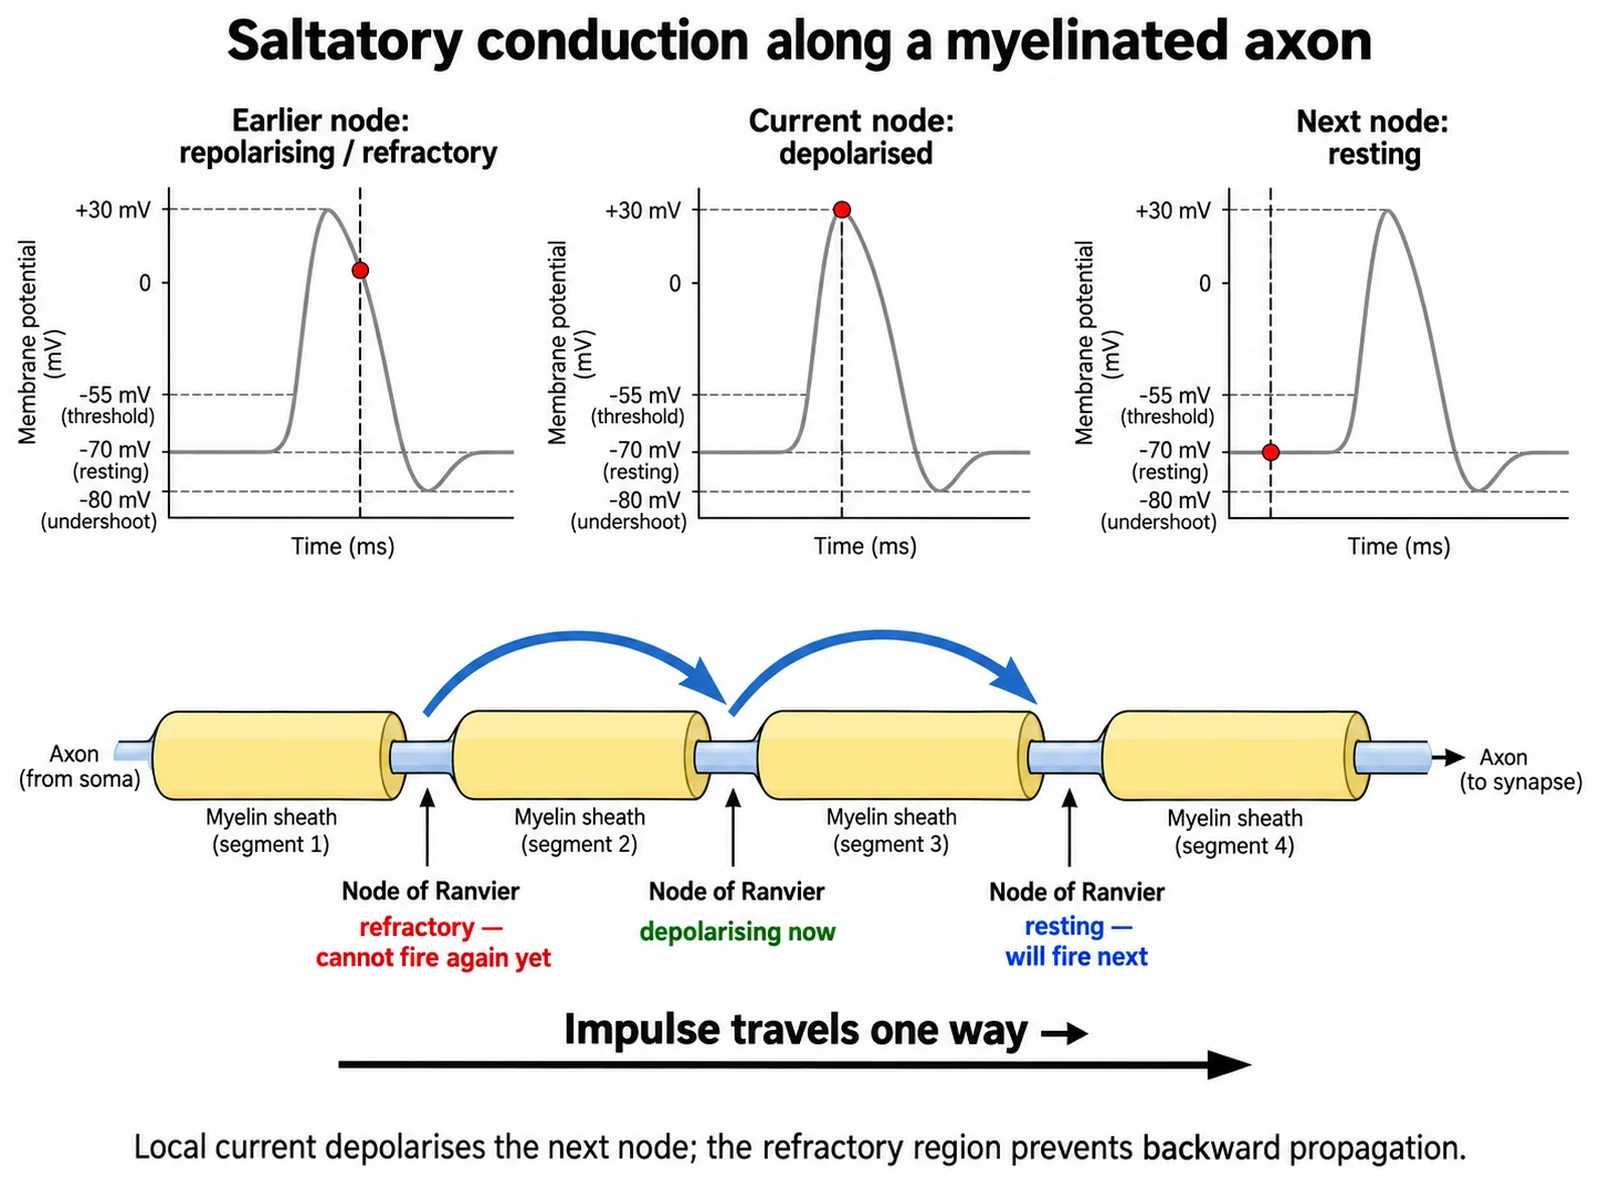
Saltatory conduction diagram showing an action potential jumping between nodes of Ranvier along a myelinated axon in one direction only

Prompt

Create a saltatory conduction diagram on a white background. Draw a myelinated axon left to right with four separate myelin segments and clearly visible bare gaps labeled "Node of Ranvier", and curved arrows arcing from node to node away from the cell body, captioned "The impulse travels one way only — the region behind it is refractory". Above three successive nodes draw small action potential traces caught at different moments, each with its y axis in millivolts showing rest at −70 mV, threshold at −55 mV, a sharp peak at +30 mV and an undershoot to about −80 mV before the return to rest. Mark the trailing node "Refractory — cannot fire yet".

How the Impulse Travels

How to draw a labeled action potential graph

1

Choose the level of detail

A simple curve with five labels for younger classes, a full labeled trace with the refractory periods bracketed, a five-phase breakdown, an ion channel version, or a blank one for students to label.

2

Generate the graph

The generator keeps the y axis in millivolts and the x axis in milliseconds, pins rest at −70 mV, threshold at −55 mV, the peak at +30 mV, and the undershoot at about −80 mV, and keeps the rise steeper than the fall.

3

Check the numbers, then export

Confirm the axis values, the sharp peak rather than a rounded bell, the dip below resting potential, and that sodium arrows point in on the rise while potassium arrows point out on the fall, then download the PNG.

What is an action potential?

An action potential is the brief electrical spike a neuron fires when its membrane is depolarised past threshold. Plotted properly it is a graph, not a drawing: membrane potential in millivolts on the y axis, running roughly −90 to +40 mV, against time in milliseconds on the x axis, with the whole event over in about 2–3 ms. The membrane sits at a resting potential of −70 mV. If a stimulus pushes it to the threshold of −55 mV, voltage-gated sodium channels open and the trace shoots up to a sharp peak of +30 mV; the sodium channels then inactivate, potassium channels open, and the trace falls back down, overshooting to about −80 mV before settling at rest again. Because the shape and the numbers carry all the meaning, a beautifully drawn curve with the wrong values on the axis tells a student nothing.

What to label on the graph

  • Y axis: membrane potential in millivolts, scaled roughly −90 to +40 mV so both the peak and the undershoot fit.
  • X axis: time in milliseconds, with the whole action potential lasting about 2–3 ms.
  • Resting potential: the flat baseline at −70 mV, best drawn as a horizontal reference line.
  • Threshold: a dashed line at −55 mV, above resting by a small margin and far below the peak.
  • Peak: the sharp turning point of the spike at +30 mV, never a rounded symmetrical hump.
  • Hyperpolarisation: the undershoot below the baseline to about −80 mV before the return to rest.
  • Refractory periods: absolute across depolarisation and most of repolarisation, relative across the rest of repolarisation and the undershoot.

The five phases, step by step

  • Resting state: the membrane sits at −70 mV, with the sodium and potassium gradients held by the sodium-potassium pump.
  • Depolarisation: a stimulus takes the membrane past −55 mV, voltage-gated sodium channels open, Na⁺ floods into the cell, and the trace rises very steeply to +30 mV.
  • Repolarisation: the sodium channels inactivate and voltage-gated potassium channels open, so K⁺ leaves the cell and the trace falls back down, slightly less steeply than it rose.
  • Hyperpolarisation: the potassium channels are slow to close, a little too much K⁺ leaves, and the potential undershoots to about −80 mV — below the resting value.
  • Return to resting: the potassium channels close and the sodium-potassium pump restores the gradients, bringing the membrane back to −70 mV and ready to fire again.

All-or-nothing, and why the impulse only travels one way

  • All-or-nothing: the cell either reaches −55 mV and fires a full spike to +30 mV, or it fires nothing at all.
  • A subthreshold stimulus produces only a small local depolarisation that decays back to −70 mV, so it must never be followed by a spike in a figure.
  • A bigger stimulus does not make a bigger spike; it makes action potentials fire more often.
  • During the absolute refractory period — depolarisation and most of repolarisation — the sodium channels are inactivated and no second spike is possible.
  • During the relative refractory period — the rest of repolarisation and the hyperpolarisation — only a stronger than normal stimulus can fire one.
  • Because the stretch of membrane behind the impulse is refractory, the impulse can only travel forward, away from the cell body.
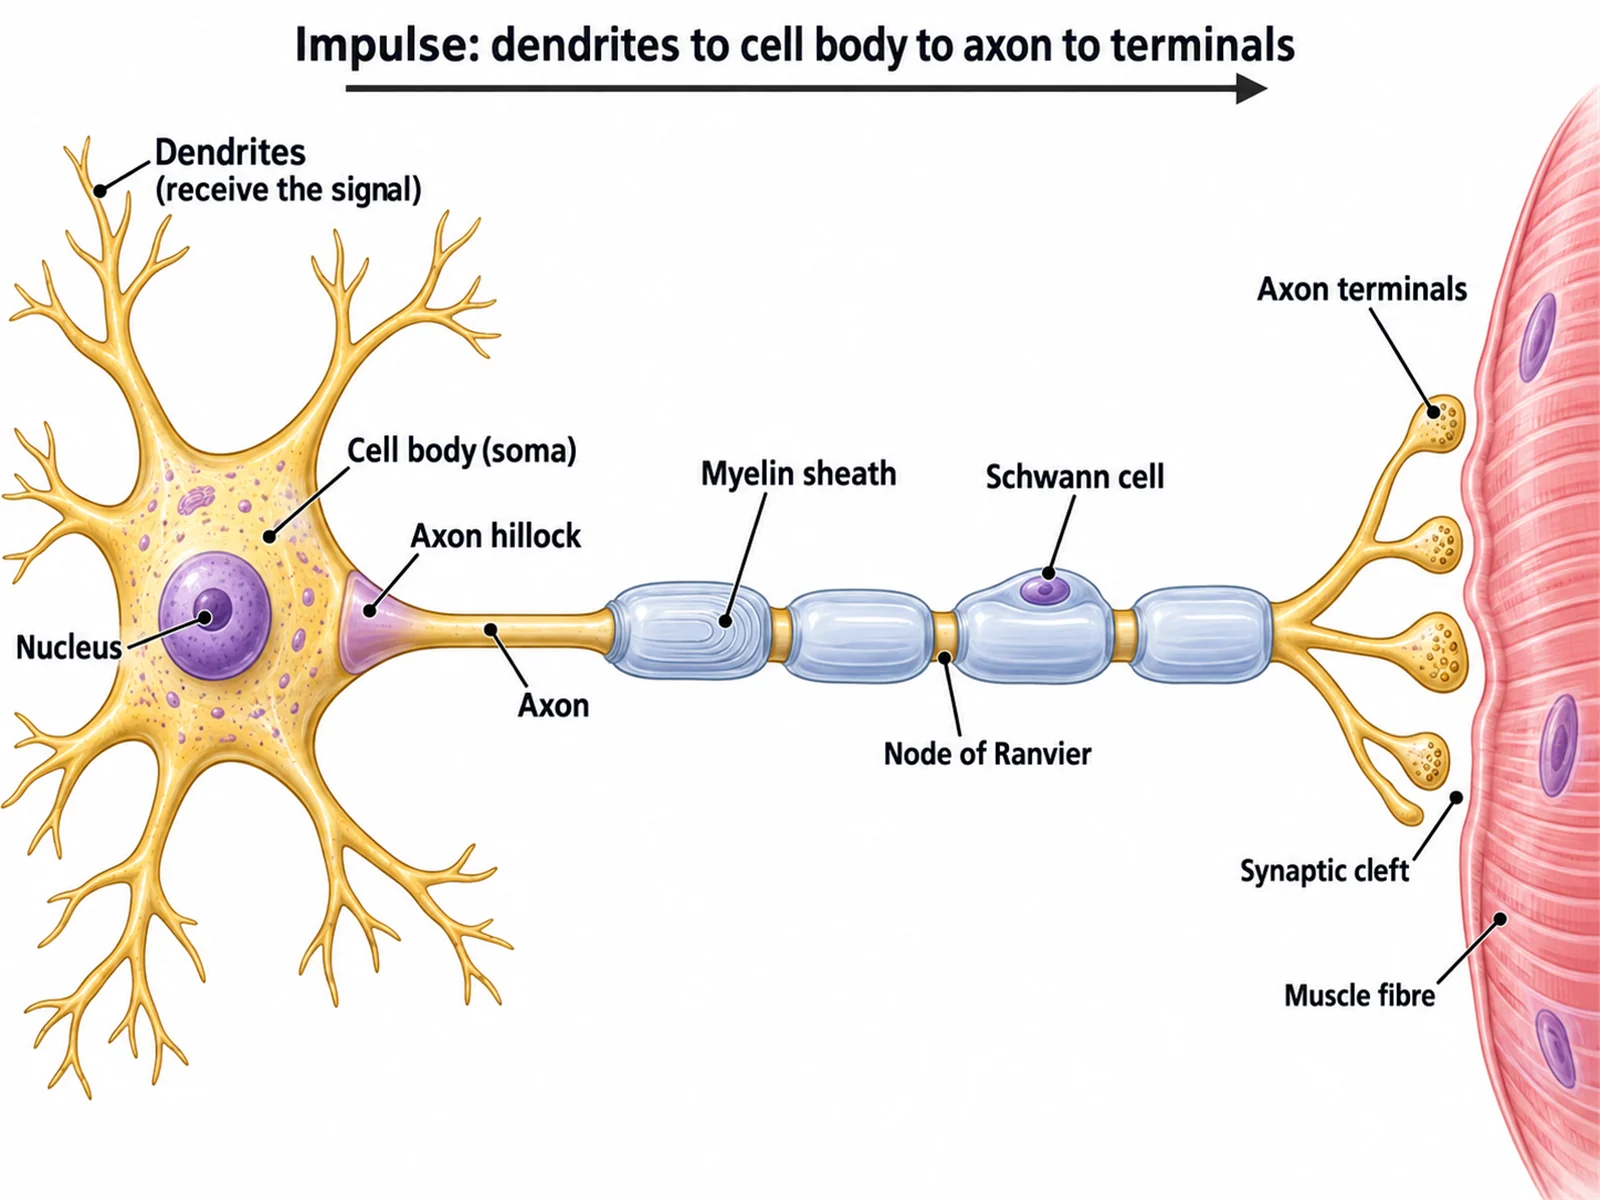
  • On a myelinated axon it jumps from one node of Ranvier to the next, which is saltatory conduction, so the nodes must be drawn as visible bare gaps between the myelin segments.

Action Potential Graph FAQ

Both axes first: membrane potential in millivolts on the y axis, running roughly −90 to +40 mV, and time in milliseconds on the x axis, with the whole event lasting about 2–3 ms. Then the five phases and the four values that pin them down: the resting potential at −70 mV, the threshold at −55 mV, the peak of the spike at +30 mV, and the hyperpolarisation undershoot at about −80 mV. A fuller graph also brackets the absolute and relative refractory periods under the curve. This is a graph, not a drawing, so a figure with the wrong numbers on the axis is useless no matter how neat the line looks.

Need other biology figures?

Generate nerve cell close-ups, membrane figures, organ diagrams, and worksheet-ready illustrations with the same SciFigure AI workflow.