
Free flowchart creator
Flowchart maker with standard symbols, yes/no decisions and lab templates
Draw a flowchart the way textbooks and standards do: a terminator to start and end, rectangles for steps, diamonds for yes/no decisions, parallelograms for input and output, plus documents, databases, predefined processes and connectors. Type one line per step or click shapes in with the builder, and a flowchart check flags dead ends and decisions with a missing branch. Start from a lab, clinical, algorithm or sign-up template, then export SVG, PNG or PDF.
Flowchart check: no problems found
Everything runs in your browser: nothing is uploaded, and the diagram is drawn exactly from your code. Undo with Ctrl+Z.
Step by step
How to make a flowchart
Six steps from a list of actions to a clean, standard flowchart for a protocol, a report, a programming assignment or a slide.
- 1
List the steps in order
Write down where the process starts, where it can end and every step in between, each as a short verb + object: Scan barcode, Centrifuge, Store at −80 °C. One step per shape.
- 2
Give each step its symbol
Rectangle for an action, parallelogram for data going in or out, document for a printed form or report, cylinder for a database, double-sided rectangle for a step with its own SOP. The Symbol list in the Build tab has all of them.
- 3
Turn questions into decisions
Every point where the path splits becomes a diamond with a question that has a clear answer: Label matches the request? Label each exit (Yes, No, or the condition) so no reader has to guess.
- 4
Connect the flowlines
Arrows run from each step to the next; a loop is an arrow back to an earlier step. When a line would cross the chart, use a pair of connector circles with the same letter, or an off-page connector to another page.
- 5
Set direction and style
Top to bottom suits most procedures; left to right suits wide slides and short processes. Pick right-angled lines for a printed, engineering look, and a figure style and text size for the journal or the slide.
- 6
Clear the check and export
Fix what the flowchart check lists under the drawing (a step that leads nowhere, a decision with one exit, an unlabelled branch), then download SVG or PDF for a report and PNG for slides.
Templates
Flowchart templates for the lab, the clinic and the classroom
Eight complete flowcharts, each passing the flowchart check: sample processing, a failed PCR, trial screening, cell passage, choosing a statistical test, peer review, an algorithm and a sign-up flow. Open one and change the steps.
Symbol reference
Flowchart symbols and their meanings (ISO 5807 and ANSI)
Every symbol this flowchart creator draws, with its meaning and the line of code for it. Add puts a working example into the sample processing template.
| Symbol | Element and meaning | Code in this tool |
|---|---|---|
Terminator (start / end) Where the process starts and every place it can end. | start(["Start"]) | |
Process One action or operation, named verb + object. | thaw["Thaw on ice"] | |
Decision A question with two or more exits, each labelled with its answer. | vol{"Volume ≥ 2 mL?"} | |
Input / output (data) Data entering or leaving the process: scan, read, print a value. | read[/"Read absorbance"/] | |
Document A printed or human-readable document: a form, report or labels. | req@{ shape: doc, label: "Requisition form" } | |
Multiple documents Several documents, such as a set of reports or consent forms. | forms@{ shape: docs, label: "Consent forms" } | |
Predefined process A step defined elsewhere: an SOP, a subroutine or another flowchart. | sop[["Aliquot (SOP-12)"]] | |
Database Data kept in a database or other stored data. | lims[("LIMS")] | |
Manual input Data typed in by hand at the time, such as a keyboard entry. | typed@{ shape: sl-rect, label: "Type sample ID" } | |
Preparation Setting up before a step: initialising a counter, preparing a reagent. | init{{"i ← 1"}} | |
Manual operation Work done by hand, without a machine. | look[\"Inspect the tube"/] | |
Delay Waiting before the next step: incubation, a courier, a queue. | clot@{ shape: delay, label: "Clot 30 min" } | |
Display Information shown on a screen or monitor. | warn@{ shape: curv-trap, label: "Show warning" } | |
Connector (on-page) Exit to, or entry from, another part of the same chart; pairs share a letter. | a1(("A")) | |
Off-page connector The flow continues on another page (ANSI pentagon; ISO 5807 uses the circle for both). | p2["p. 2"]:::offpage | |
Annotation A comment beside a step, joined by a dashed line. | n1@{ shape: brace, label: "Within 2 h" }
spin -.- n1 | |
Flowline with a label The order of steps; label decision exits with the answer. | match -->|Yes| quality |
Which diagram?
Flowchart vs workflow diagram vs data flow diagram
Three tools on this site draw boxes and arrows. Pick by what the arrows mean: the next step, the next stage of a method, or data on the move.
| Property | Flowchart (this page) | Workflow diagram generator | Data flow diagram generator |
|---|---|---|---|
| Shows | Steps in order and the decisions between them | How work, samples or data move through a method | Which data moves between processes, stores and outside entities |
| Arrows mean | “Then”, or the answer to a decision | The next stage of the workflow | Data in motion, named with a noun |
| Symbols | ISO 5807 / ANSI: terminator, process, decision, I/O, document, database… | Icons and illustrations, free layout | Entities, process circles, data stores (Yourdon–DeMarco) |
| Made from | Your steps, as text or with the builder: exact | A written description, drawn by AI | Your entities and flows, as text or with the builder: exact |
| Best for | SOPs, troubleshooting, algorithms, user flows, exam answers | Graphical abstracts, methods figures, posters | Systems analysis, data mapping, privacy reviews |
Common mistakes
Six flowchart mistakes and how to fix them
Decisions with a missing branch
WrongA diamond Haemolysed? with one arrow out, or two unlabelled arrows.
RightEvery decision has at least two exits, each labelled with its answer: Yes and No, or the conditions.
Steps that lead nowhere
WrongReject sample is a dead end: the reader cannot tell whether the process stops or goes on.
RightEvery path reaches an End terminator or loops back to an earlier step.
A rectangle for everything
WrongQuestions, printed forms and the database all drawn as plain boxes.
RightDiamond for questions, parallelogram for input/output, document and cylinder for forms and data, so the chart reads at a glance.
Paragraphs inside the shapes
WrongCentrifuge at 1,500 × g for 10 minutes at room temperature, then transfer the plasma with a sterile pipette…
RightCentrifuge (SOP-07) as a predefined process, or a short step with the detail in an annotation.
Crossing and tangled lines
WrongLong return arrows that cross half the chart to reach the start.
RightReorder the steps, switch to left to right, or use a pair of connector circles with the same letter.
Data drawn as control flow
WrongArrows labelled sample record or results file between steps, with no order between them.
RightA flowchart shows the order of steps. To show which data goes where, draw a data flow diagram instead.
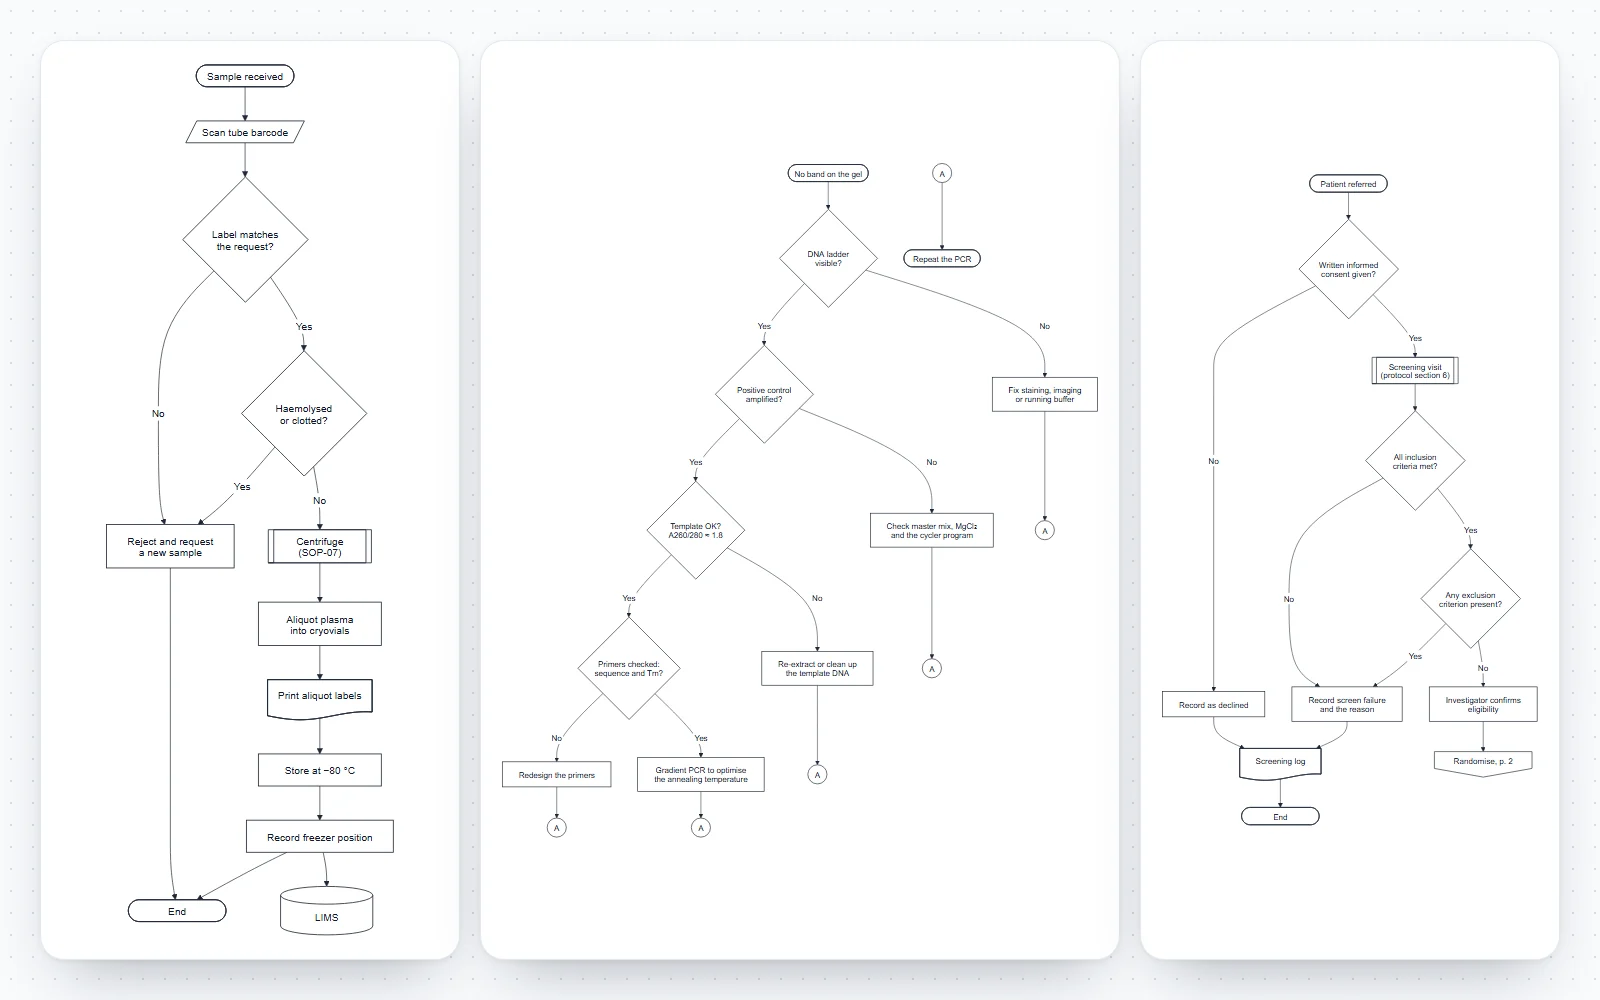
How this flowchart maker works
Each step and each arrow is a short line of text. The chart is redrawn as you type, laid out automatically, and every change can be undone.
- Code tab: one step or arrow per line, a chain such as start --> scan --> check on one line, line numbers, and plain-English errors that point to the line to fix.
- Build tab, for anyone who does not want to write code: add a step in any of 15 symbols and join it to the step before it, add a yes/no decision with both branches in one go, connect two steps, add connectors, annotations and titled groups.
- Flowchart check: a live list under the drawing of steps that lead nowhere, steps nothing leads to, decisions with fewer than two exits or unlabelled exits, and a missing start or end. It never stops the chart from drawing.
- Style tab: top to bottom, left to right, bottom to top or right to left, right-angled flowlines, four figure styles (publication, grey fill, blue accent, dark) and the text size.
- Eight templates: blood sample processing, troubleshooting a failed PCR, clinical trial eligibility screening, passaging adherent cells, choosing a statistical test, journal peer review, Euclid’s algorithm and an account sign-up flow.
What is a flowchart?
A flowchart is a diagram of a process as a sequence of steps, drawn as standard shapes joined by arrows, with the decisions that send the process one way or another. It answers “what happens next, and under what condition?”.
- Frank and Lillian Gilbreth presented process charts to the American Society of Mechanical Engineers in 1921, as a way to record and improve industrial work.
- Herman Goldstine and John von Neumann used flow diagrams in 1947 to plan programs for early electronic computers, which made flowcharts the standard way to design and teach algorithms.
- The symbols were standardised in the United States as ANSI X3.5 and internationally as ISO 5807:1985, which is still current (last confirmed by ISO in 2019).
- Today flowcharts document standard operating procedures, troubleshooting guides, clinical pathways, user flows and algorithms; students meet them first in biology practicals and programming courses.
Standard flowchart symbols (ISO 5807 and ANSI)
Most flowcharts need only five or six symbols. The full set below follows ISO 5807, with the ANSI off-page connector that many templates still use; the symbol table above shows each one with its code.
- Terminator (rounded “stadium”): the start and every end of the process. Label it Start, End, or with the event that starts it.
- Process (rectangle): one action or operation. Predefined process (rectangle with double sides): a step defined elsewhere, such as an SOP or a subroutine.
- Decision (diamond): a question with two or more exits, each labelled with its answer.
- Input/output (parallelogram): data entering or leaving the process, such as Scan barcode or Output result. Manual input (sloped top): data typed in by hand.
- Document (wavy bottom) and multiple documents: printed or human-readable output, such as a report, a form or labels. Display (curved side): data shown on a screen.
- Database (cylinder) and stored data: where data is kept. Preparation (hexagon): setting up before a step, such as initialising a counter. Manual operation (trapezoid): work done by hand. Delay (D shape): waiting, such as incubation.
- Connector (small circle) and off-page connector (pentagon): the flow continues at the matching letter on the same page, or on another page. Annotation (open bracket with a dashed line): a comment.
Yes/no decisions and branches
Decisions are what make a flowchart more than a list. A good decision asks one question with answers that cover every case.
- Phrase it as a question: Haemolysed or clotted? rather than Check sample.
- Label every exit. Yes and No are the usual pair; a decision can have more exits when the answers are distinct, such as Accept, Revise and Reject in the peer review template.
- Draw one branch straight on (usually the expected path) and the other to the side, so the main path reads down the page.
- A chain of decisions makes a decision flowchart or key: the statistics template chooses between four tests with three yes/no questions.
- The Add yes/no decision form in the Build tab writes the diamond, both labelled branches and their next steps at once.
Rules for a clear flowchart
These conventions come from the standard and from long practice, and they are what a reviewer or examiner checks first.
- One start, and every path reaches an end: no step may lead nowhere.
- Flow runs top to bottom or left to right; arrowheads show any other direction, such as a loop back up.
- Each process has one exit; only decisions branch. Several arrows may enter a step.
- Flowlines should not cross. Rearrange the steps, or replace a long line with a pair of connectors.
- Use the same symbol for the same kind of step throughout, keep shapes a similar size, and keep the text short: details belong in an annotation or a predefined process.
Types of flowchart
The same symbols serve several kinds of chart. Knowing which one you are drawing tells you how much detail to put in.
- Process flow chart: the steps of a job or procedure in order, such as sample reception or manuscript submission. Engineers also use “process flow diagram” for a different chart of plant equipment and streams.
- Program flowchart: the logic of an algorithm, with input, output, loops and assignments, as in the Euclid template.
- System flowchart: how data moves between programs, files, documents and devices, using the storage and document symbols.
- Decision flowchart: a chain of yes/no questions that ends in an answer, such as choosing a statistical test or identifying a sample.
- Swimlane (cross-functional) flowchart: the same steps arranged in lanes for each person or department.
- Reporting flow diagrams such as PRISMA (systematic reviews) and CONSORT (randomised trials) are specialised flowcharts with fixed boxes; they have their own tools on this site.
Flowchart, workflow diagram or data flow diagram?
Three tools on this site draw boxes and arrows, for different jobs. The table above sums up the difference; in short:
- Flowchart (this page): exact, standard symbols from your own steps, drawn from code or the builder. Best when the steps and decisions are known and the notation must be right.
- Workflow diagram generator: an AI tool that turns a written description of a method or pipeline into an illustrated workflow figure, with icons and visual style for a paper or poster.
- Data flow diagram generator: which data moves between processes, data stores and outside entities, with no order and no decisions. If an arrow can be labelled “then” or “yes”, it belongs in a flowchart; if it can only be labelled with the name of some data, it belongs in a DFD.
- UML activity diagrams are the UML relative of the flowchart, with forks and joins for parallel work; the UML diagram generator covers the other UML diagrams.
Flowcharts for experiments and lab procedures
A one-page flowchart is often the clearest form of a protocol: people at the bench follow arrows faster than paragraphs.
- Sample processing: reception checks, rejection criteria, the SOP for each step and where each aliquot is recorded. Used in quality manuals and lab inductions.
- Troubleshooting: an experiment that failed, worked through as a chain of checks from the most likely and cheapest cause to the least, as in the failed PCR template.
- Experimental workflows in a methods section or a thesis: sample collection, processing, measurement and analysis, with decisions where samples are excluded.
- Clinical pathways and screening: consent, inclusion and exclusion criteria and what happens to each participant, before the CONSORT diagram reports the numbers.
- Safety and waste procedures, where a missed branch matters: every path must end in a defined action.
Algorithm flowcharts for programming courses
Before writing code, students are often asked to draw the algorithm. The program flowchart conventions are simple and strict.
- Start and End terminators, a parallelogram for each input and output (Input a, b; Output a), rectangles for assignments (r ← a mod b) and diamonds for conditions (b = 0?).
- A loop is a decision with one exit going back to an earlier step; a counting loop usually starts with a preparation hexagon that sets the counter (i ← 1).
- Write the same logic in pseudocode next to the chart: each diamond becomes an if or a while, each loop arrow the end of a loop body.
- Keep one statement per rectangle unless the steps always run together, as the three assignments in the Euclid template do.
A flow chart generator from text, or with AI
Because the chart is drawn from a few lines of text, anything that writes text can draw it.
- Ask a chat assistant to list the steps and decisions of a process in the format shown in the syntax cheat sheet, paste the lines into the Code tab and adjust them there.
- Then read the flowchart check: generated charts often have dead ends, unlabelled branches or a decision with one exit.
- The code is Mermaid flowchart syntax, so the same chart can live in GitHub and GitLab Markdown, Notion and Obsidian. The Mermaid to PNG converter turns any Mermaid code into an image.
- For an illustrated figure rather than a standard flowchart, describe the process to the AI workflow diagram generator instead.
A free flowchart maker with exact, editable output
Nothing is guessed or added: each line of code is one shape or one arrow in the drawing.
- Free and private: no sign-up, no watermark, no limit on the number of charts; the chart is drawn in your browser and saved on your device, and nothing is uploaded.
- SVG and PDF keep every label as real text, so the chart can be edited in Illustrator, Inkscape or PowerPoint and stays sharp at any size; PNG at 2× or 4× suits slides and web pages.
- Text is set in Arial, the font most journals ask for, and the publication style prints in black and white.
Frequently asked questions
Is this flowchart maker free?
Yes. There is no sign-up, no watermark and no limit on charts or exports. The flowchart is drawn in your browser and saved on your device, so nothing you type is uploaded.
How do I make a flowchart?
List the start, the end and the steps in order; give each step its symbol (rectangle for an action, diamond for a decision, parallelogram for input or output); connect them with arrows and label the exits of every decision. Here each step is one line of code, or use the Build tab to add steps and yes/no decisions with forms. The flowchart check under the drawing points out dead ends and missing branches.
What are the standard flowchart symbols?
The core set is the terminator (start/end), process (rectangle), decision (diamond), input/output (parallelogram), document, predefined process, database, connector and the flowline (arrow). ISO 5807 adds manual input, manual operation, preparation, display, stored data and others; the notation table on this page shows each one with the code that draws it.
What is the difference between ISO 5807 and ANSI flowchart symbols?
They are nearly the same. ANSI X3.5 was the American standard (its last edition dates from 1970); ISO 5807:1985 consolidated the international symbols, and the US has since adopted ISO 5807 itself. The main visible difference is the off-page connector: older ANSI and IBM templates draw it as a pentagon, while ISO 5807 uses the circle connector for both cases.
How do I add yes/no branches?
Write a diamond, then one labelled arrow per answer: check{"Haemolysed?"}, check -->|Yes| reject and check -->|No| spin. Or open the Build tab and use Add yes/no decision, which writes the diamond, both labelled branches and their next steps at once.
Can a decision have more than two exits?
Yes, as long as the answers do not overlap and together cover every case, such as Accept, Revise and Reject after peer review. Label each exit. If a question has many answers, a chain of yes/no decisions is often easier to read.
How do I show a loop?
Draw an arrow from a later step back to an earlier one, usually from a decision: test -->|No| step --> test repeats until the answer is Yes. The Euclid, cell passage and sign-up templates all contain loops.
When do I use a connector or an off-page connector?
Use a pair of small circles with the same letter when a line would cross the chart: the flow leaves at one A and resumes at the other. Use the pentagon off-page connector, labelled with the page, when a chart continues on another page. Write it as p2["p. 2"]:::offpage.
What is a process flow chart?
A flowchart of the steps of a job or procedure in the order they happen, with the decisions that change the path: sample reception, onboarding, manufacturing or peer review. In chemical and process engineering, a “process flow diagram” (PFD) is a different chart of equipment and material streams.
What is the difference between a flowchart and a workflow diagram?
A flowchart uses standard symbols to show steps and decisions exactly, as here. “Workflow diagram” usually means a broader, often illustrated figure of how work or samples move through a method or pipeline; the AI workflow diagram generator on this site draws that kind of figure from a description.
What is the difference between a flowchart and a data flow diagram?
A flowchart shows the order of steps and the decisions between them. A data flow diagram shows which data moves between processes, data stores and outside entities, with no order and no decisions. Use the data flow diagram generator for the second.
Can I generate a flowchart from text or with AI?
Yes. The chart is drawn from plain lines of text, so you can type them, paste them from notes, or ask a chat assistant to write the steps in the format shown in the syntax cheat sheet and paste the result here. The drawing is exact, and the flowchart check flags the usual gaps in generated charts.
Does the code work in GitHub, GitLab, Notion or Obsidian?
Yes: it is Mermaid flowchart syntax, which all four render in a mermaid code block (More, then Copy as Markdown block). Two details depend on their renderer version: shapes written with @{ shape: … } need a recent version, and the off-page pentagon is drawn by this tool, so elsewhere it appears as a small box.
Which file format should I use for a paper, a thesis or slides?
SVG or PDF for papers and theses: they are vector files with real text, sharp at any size and editable in Illustrator, Inkscape or PowerPoint. PNG at 2× or 4× for slides, posters made in PowerPoint, and web pages.
Can I draw the flowchart left to right?
Yes. In the Style tab choose LR (left to right), TB (top to bottom), BT or RL; the first line of the code changes to match, for example flowchart LR. Turn on right-angled lines for straight flowlines with square bends.
Related diagram tools
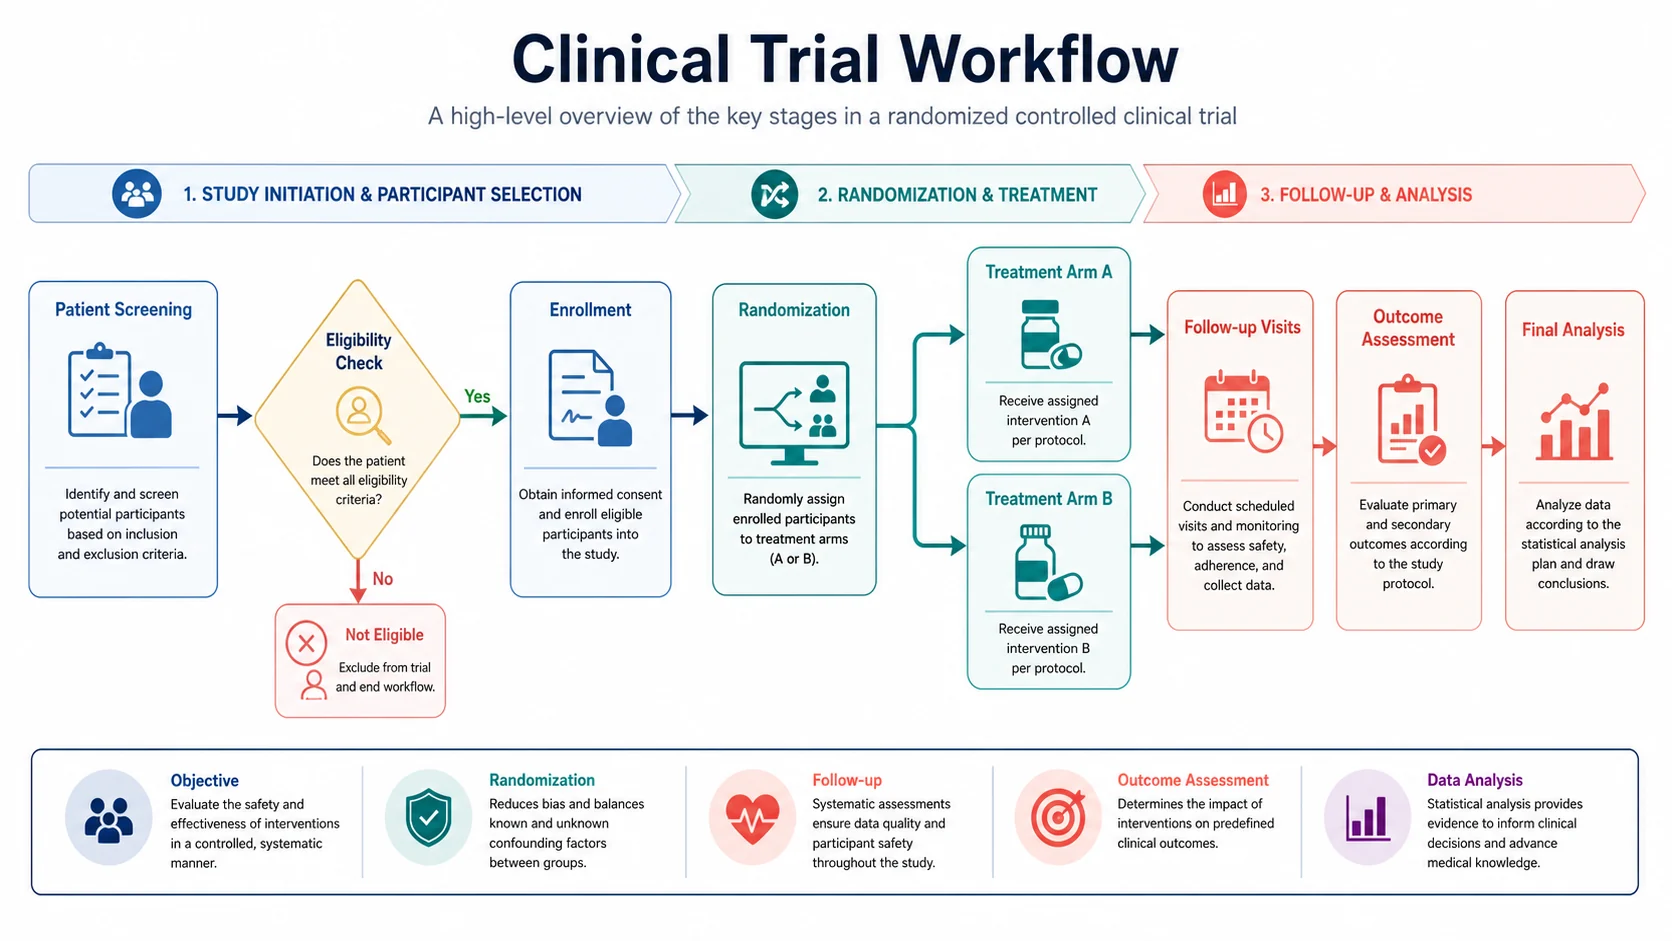
Workflow Diagram Generator
AI-drawn, illustrated workflow figures of a method or pipeline from a written description.
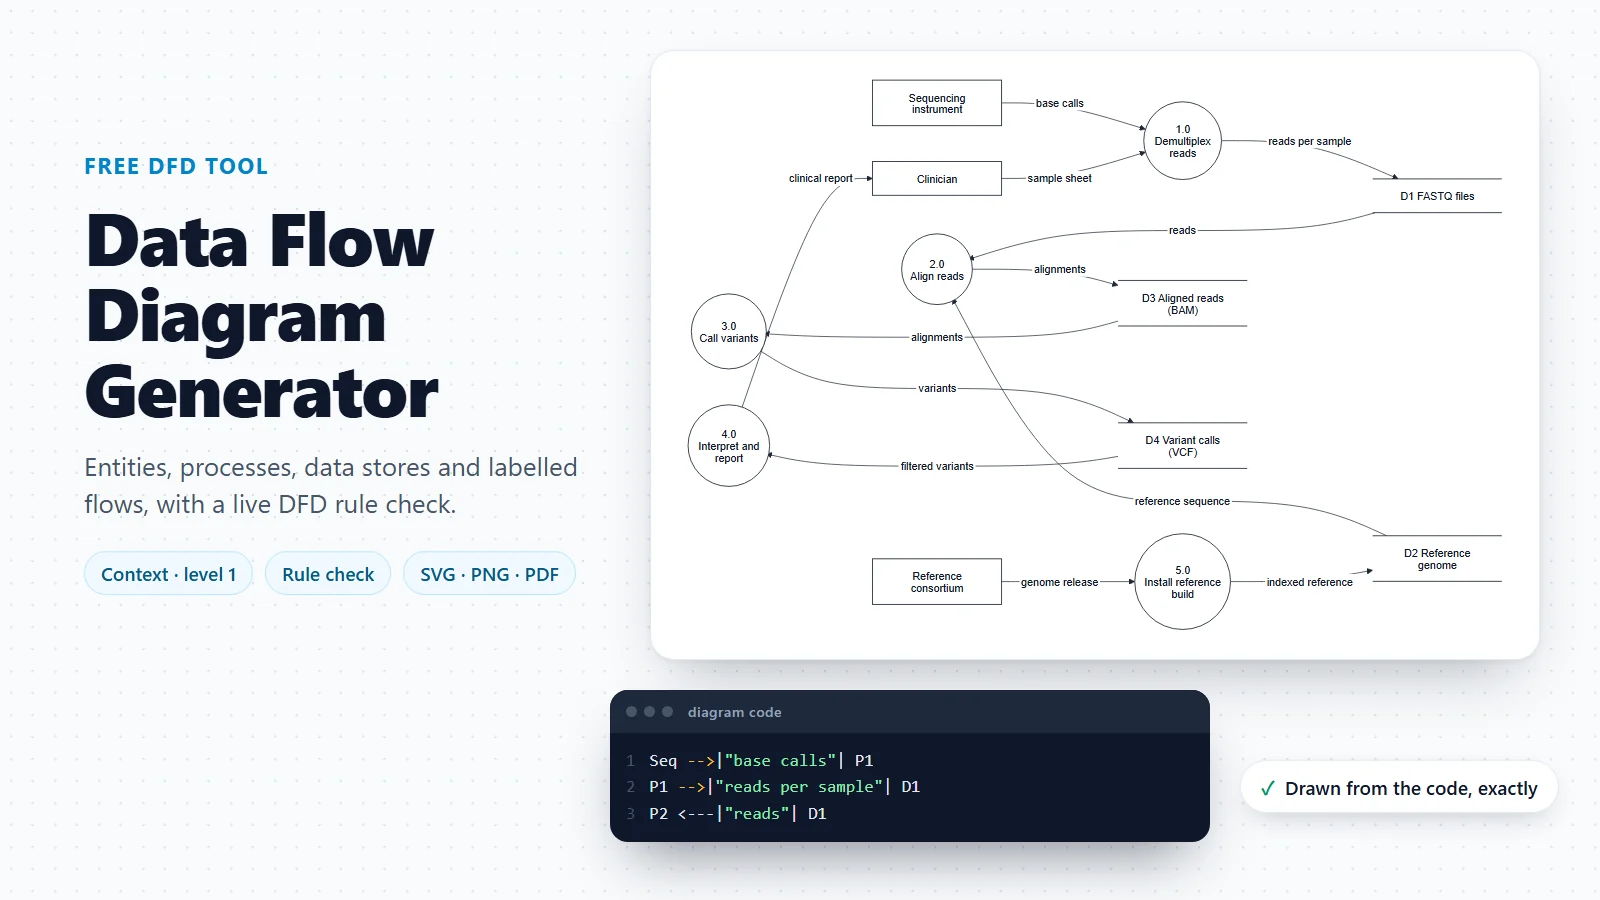
Data Flow Diagram Generator
Which data moves between processes, stores and entities, with a DFD rule check.
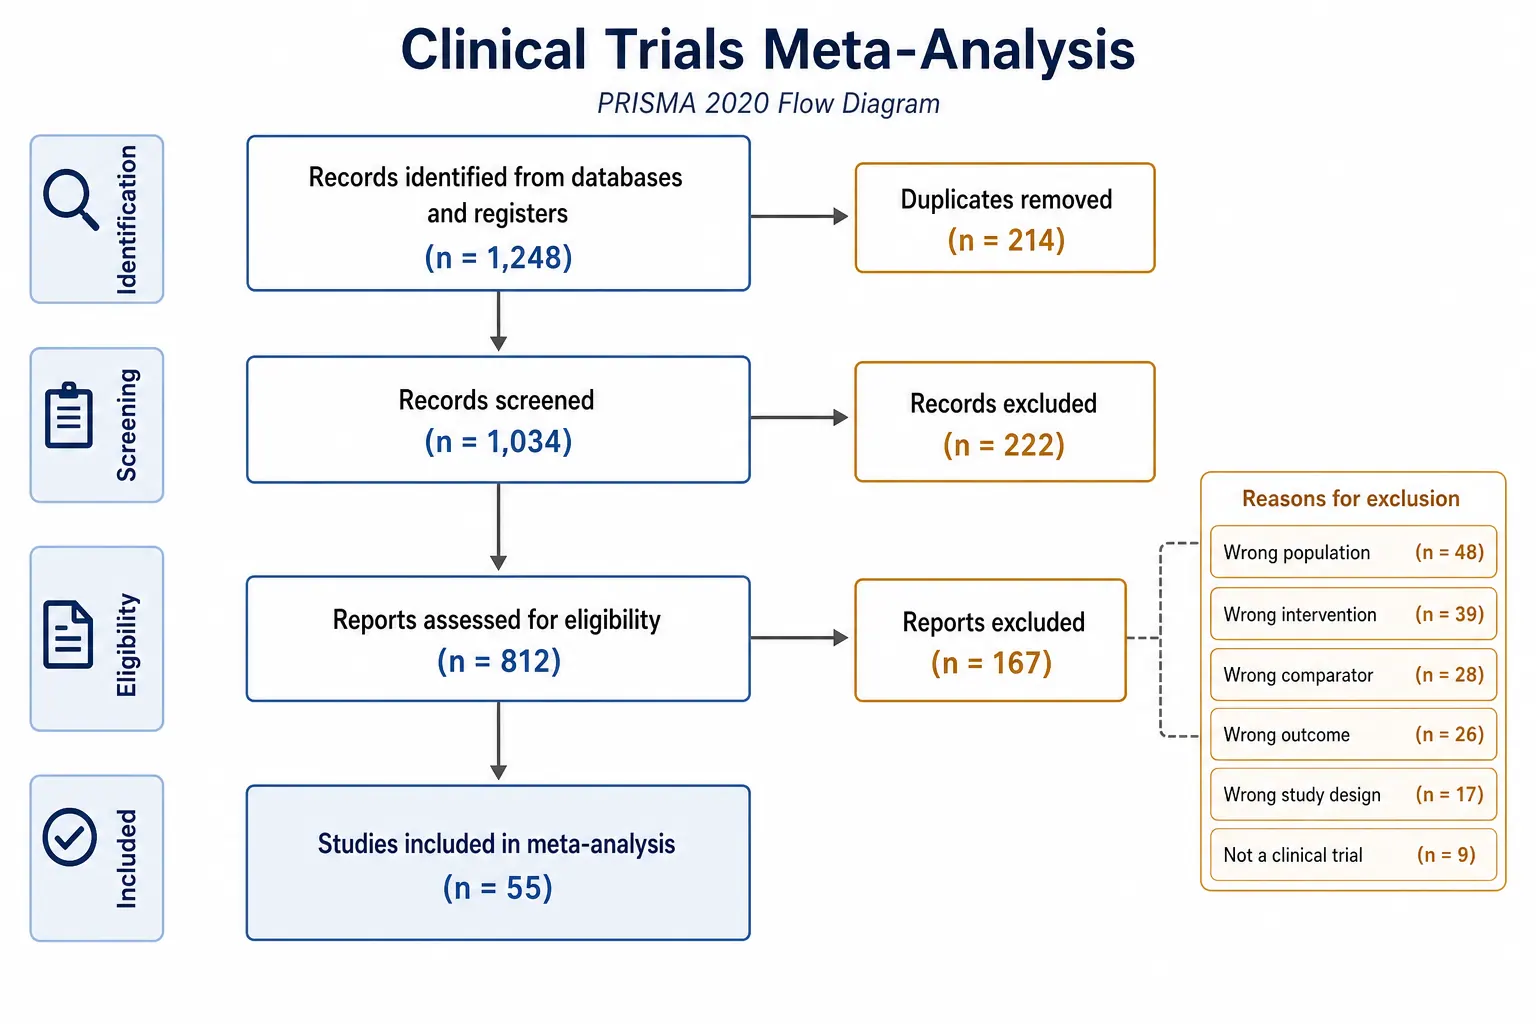
PRISMA Flow Diagram
The PRISMA 2020 flow diagram for systematic reviews, with the record counts.
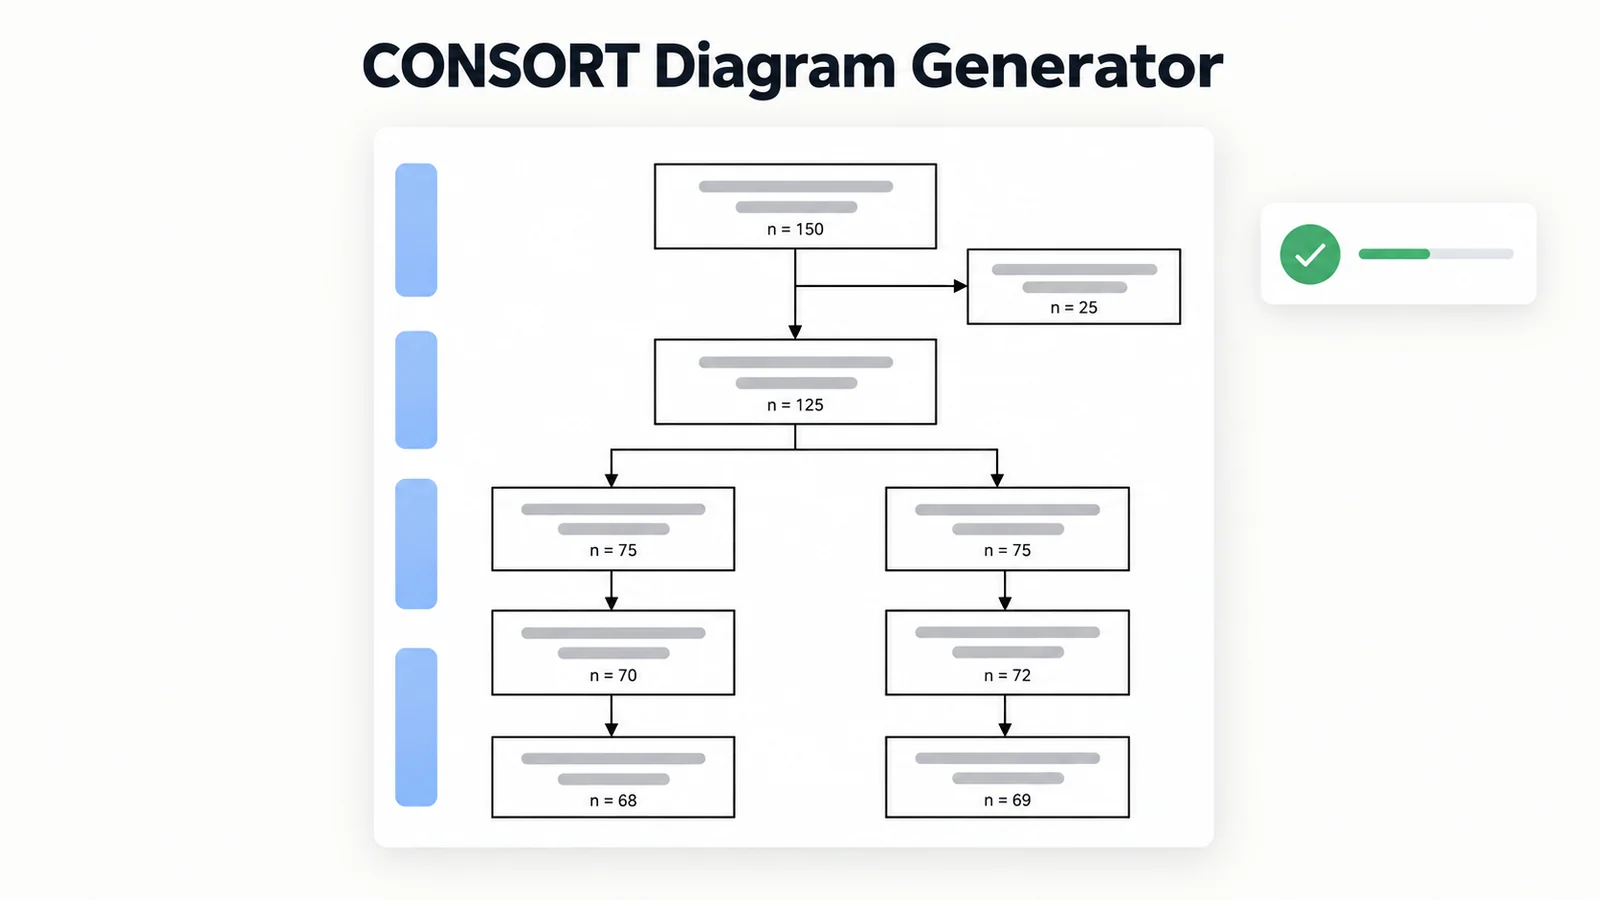
CONSORT Diagram Generator
The participant flow of a randomised trial, from enrolment to analysis.
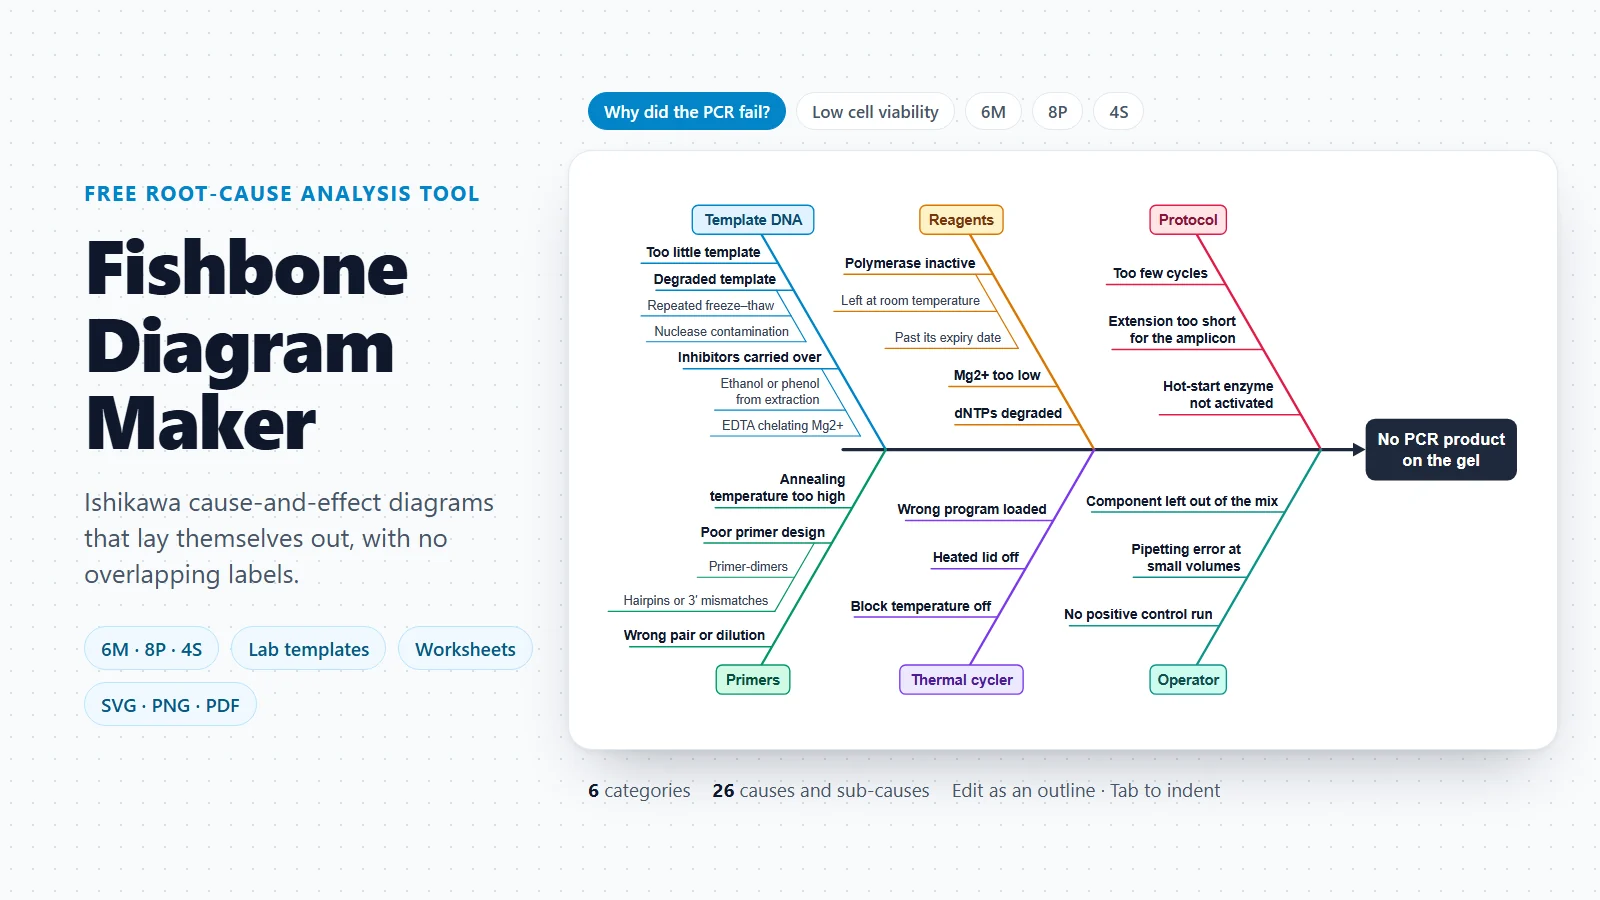
Fishbone Diagram Maker
Cause-and-effect diagrams for finding why an experiment or process fails.
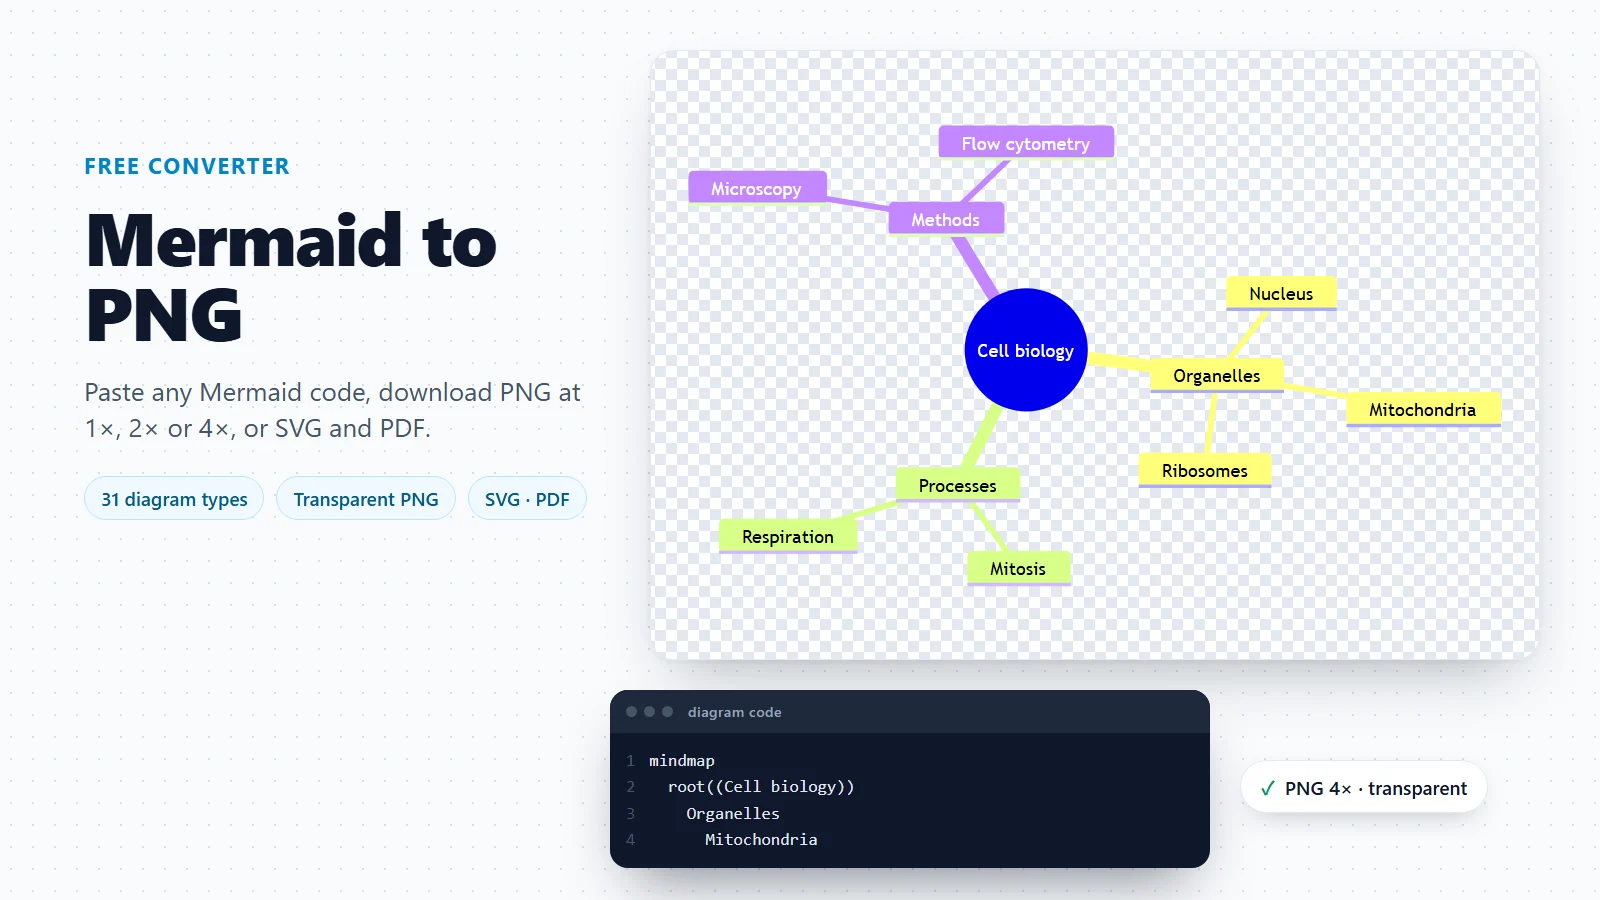
Mermaid to PNG Converter
Paste any Mermaid code and download PNG, SVG or PDF, with a transparent background if you need one.
Want an illustrated workflow figure instead?
For a methods figure with icons and colour rather than standard symbols, describe the procedure and let the workflow diagram generator draw it.
Open the workflow diagram generatorLast checked: November 17, 2026. Sources: ISO 5807:1985, Documentation symbols and conventions for data, program and system flowcharts (confirmed 2019); INCITS/ISO/IEC 5807:1985 (S2013), the US adoption of ISO 5807 (ANSI webstore); Mermaid flowchart syntax, including the expanded node shapes; GitHub Docs: creating Mermaid diagrams in Markdown. The laboratory, clinical and statistics templates are teaching examples, not validated procedures: follow your own SOPs, protocol and statistician.