For Researchers
AGU Poster Guidelines: AGU26 Abstract Rules, iPosters and a Layout for Earth and Space Science
AGU26 poster guide: abstract rules and the 2,000-character limit, in-person posters and online iPosters, session times, and a layout for maps and time series.
 SciFigure Editorial
AGU26, the American Geophysical Union's annual meeting, runs December 7–11, 2026, at the Moscone Center in San Francisco. AGU describes it as the largest gathering of Earth and space scientists, with more than 25,000 attendees from over 100 countries, and posters are its core format: the online program lists poster sessions every morning and afternoon of the week. AGU also runs two kinds of poster at once, a printed poster in the hall and an interactive iPoster online, and the rules for each are spread across the meeting website, the abstract guidelines and the online program.
This guide puts those rules in one place, then covers what AGU leaves to you: how to make maps, time series and model–data comparisons readable on a poster and in an iPoster. Every date, limit and fee below is as published on AGU's official pages when we checked them on November 17, 2026, with each source listed at the end.
AGU26 poster rules at a glance
| Item | AGU26 (as published) |
|---|---|
| Dates and venue | December 7–11, 2026, Moscone Center, San Francisco; meeting times in Pacific Standard Time |
| Poster hall | Moscone South, Halls A–C |
| Poster sessions | Monday–Thursday 08:30–12:00 and 14:15–17:45; Friday 08:30–12:00 |
| In-person posters | Print a paper poster and attend on your assigned date; an iPoster is optional |
| Online posters | An interactive iPoster in the online gallery is required; no dedicated online session |
| iPoster tool | AGU's iPosterSessions editor, opened with your AGU account |
| Poster board numbers | Assigned in late November: the last 4 or 6 digits of the final abstract number |
| Abstract deadline | August 5, 2026, 23:59 EDT (03:59 UTC) |
| Abstract length | Title up to 300 characters; text up to 2,000 characters excluding spaces, including punctuation |
| Abstract fee | $80 regular, $45 student; waived for affiliations in low- and lower-middle-income countries |
| Acceptance notices | Sent Thursday, October 1, 2026 |
| Confirm participation | By Thursday, November 5, 2026 (also the early-bird registration deadline) |
| Printed poster size | Up to 8 ft wide × 4 ft high (2.4 × 1.2 m), landscape; usable area about 91 × 45 in |
Mistakes that trip up AGU presenters
- Planning an oral talk. You cannot request one at AGU. You choose between "assign me a format" (oral, GeoBurst or poster) and "poster only", and session conveners decide.
- Writing to a word count. AGU limits the abstract by characters: 2,000, excluding spaces but including punctuation. That is roughly 300–350 words of scientific prose.
- Pasting from a word processor. AGU asks for plain ASCII text: no curly quotes, no em dashes, no pasted formatting, because they display badly in the online program.
- Treating the iPoster as optional when you present online. For online presenters it is the presentation. For in-person presenters it is optional but extends your audience beyond your session.
- Missing the November 5 confirmation. Presenters had to confirm participation, and whether they would present in person or online, in the Speaker Center by November 5.
- Rainbow colour maps. "Jet" and other rainbow scales create false boundaries in continuous fields and fail for colour-blind readers.
- Time series without a time standard or a baseline. State UTC or local time, the averaging period, and the reference period for any anomaly.
AGU26 dates and deadlines
| Date (2026) | What happened |
|---|---|
| July 22 | Deadline to request special membership exceptions (invited non-geoscientist authors, affiliated-society members) |
| August 5, 23:59 EDT | Abstract submission deadline; unpaid abstracts are withdrawn after it |
| August | Co-authors receive an email confirming they are listed |
| August 13 | Student Travel Grant and Berkner Travel Fellowship applications due |
| October 1 | Acceptance notices emailed to presenting authors and chairs from agu@confex.com |
| October | GeoBurst presenters receive a template and instructions |
| November 5 | Confirm participation, and in-person or online, in the Speaker Center; early-bird registration deadline |
| Late November | Final abstract and poster board numbers assigned |
| Early December | Online iPoster gallery opens |
| December 7–11 | AGU26 in San Francisco |
AGU had not published AGU27 dates or deadlines on the pages we checked. The AGU26 abstract window closed in early August, about four months before the meeting.
AGU abstract guidelines (AGU26)
- Membership: membership is required to submit and present. First authors must be current AGU members or members of an affiliated society or organization.
- Who submits: the person who submits is automatically the first author, and cannot submit on behalf of someone else. The first author can name a different co-author as the presenter.
- How many: first authors can submit up to two contributed abstracts, as long as the second goes to a session led by a different section (or a session co-organized with a different section). Session conveners can invite up to two authors to their session, and cannot be first or presenting author of an invited abstract in their own session.
- Title: up to 300 characters, in title case.
- Text: up to 2,000 characters, excluding spaces but including punctuation, in English and in ASCII characters only.
- Optional extras: one high-resolution image and a plain-language summary.
- Format request: "assign me" (eligible for oral, GeoBurst or poster) or "poster only". Authors cannot request an oral, and conveners cannot guarantee one.
- Participation: at submission, the first author says whether they will present in person in San Francisco or online.
- Fees: the fee table on AGU's abstract guidelines lists $80 regular and $45 student, with no fee for affiliations in low- and lower-middle-income countries. The fee is non-refundable, charged per abstract, payable by credit card only, and separate from membership dues and registration. First authors, including invited authors, pay all fees.
- Queue: near the deadline, AGU places submitters in a queue; when your turn comes you have 10 minutes to enter the submission site.
Poster formats at AGU26: in person, online and GeoBurst
| In-person poster | Online iPoster | GeoBurst | |
|---|---|---|---|
| Where | Poster hall, Moscone South, Halls A–C | Online iPoster gallery | A session room, then the poster hall |
| What you make | A printed paper poster; an iPoster is optional | An interactive iPoster (required) | A 5-minute talk of exactly 10 slides that auto-advance every 30 seconds, plus a poster |
| When | Your scheduled session on your assigned date | You set your own video or chat times during meeting week | In person only, as scheduled |
| Extras | — | Pre-recorded video or audio narration allowed | Template and instructions sent in October |
| Abstract number | Board number is the last 4 or 6 digits | Starts with VR, for example A11A-VR1234 | As scheduled |
GeoBurst sessions replace the eLightning format. Oral sessions mix in-person and pre-recorded talks, are not live-streamed, and are recorded for on-demand viewing; AGU says recorded content is available within 72 hours of each session.
AGU poster size
AGU posters are landscape and can be up to 8 ft wide by 4 ft high (2.4 × 1.2 m), with a usable area of about 91 × 45 in on the board. A print of about 88 × 44 in fills the board with a margin for pins; a smaller landscape print is fine too, but keep the 2:1 shape so the layout does not leave a band of empty board.
Poster session times at AGU26
AGU's online program lists every poster session in the poster hall, Moscone South, Halls A–C:
| Day | Morning session | Afternoon session |
|---|---|---|
| Monday, December 7 | 08:30–12:00 | 14:15–17:45 |
| Tuesday, December 8 | 08:30–12:00 | 14:15–17:45 |
| Wednesday, December 9 | 08:30–12:00 | 14:15–17:45 |
| Thursday, December 10 | 08:30–12:00 | 14:15–17:45 |
| Friday, December 11 | 08:30–12:00 | — |
Times are Pacific Standard Time, in the 24-hour format AGU uses. Your session code tells you the day and time slot (AGU publishes a session number key in the online program), and online posters appear in the daily sessions with an online icon.
How to build an AGU poster, step by step
1. Decide in-person or online, then plan both versions
If you present in person, design the printed poster first and treat the iPoster as a second, interactive version of it. If you present online, design the iPoster first: it is read on a laptop, so it can hold more detail, zoomable figures and a short narration.
2. Write a title that states the result
A title such as "Atmospheric rivers supplied most of our basin's winter snowpack" works from across an aisle; "Atmospheric rivers and snowpack" does not. Put your session code and board number in the title band.
3. Make maps that answer "where" at a glance
Give the study area its own panel with a scale bar, a north arrow where it is not obvious, latitude and longitude ticks and the projection. When several maps share a variable, give them one shared colour bar with units. Use a perceptually uniform sequential scale (viridis or cividis, for example) for continuous fields and a diverging scale centred on zero for anomalies. Credit satellite imagery and basemaps in the caption.
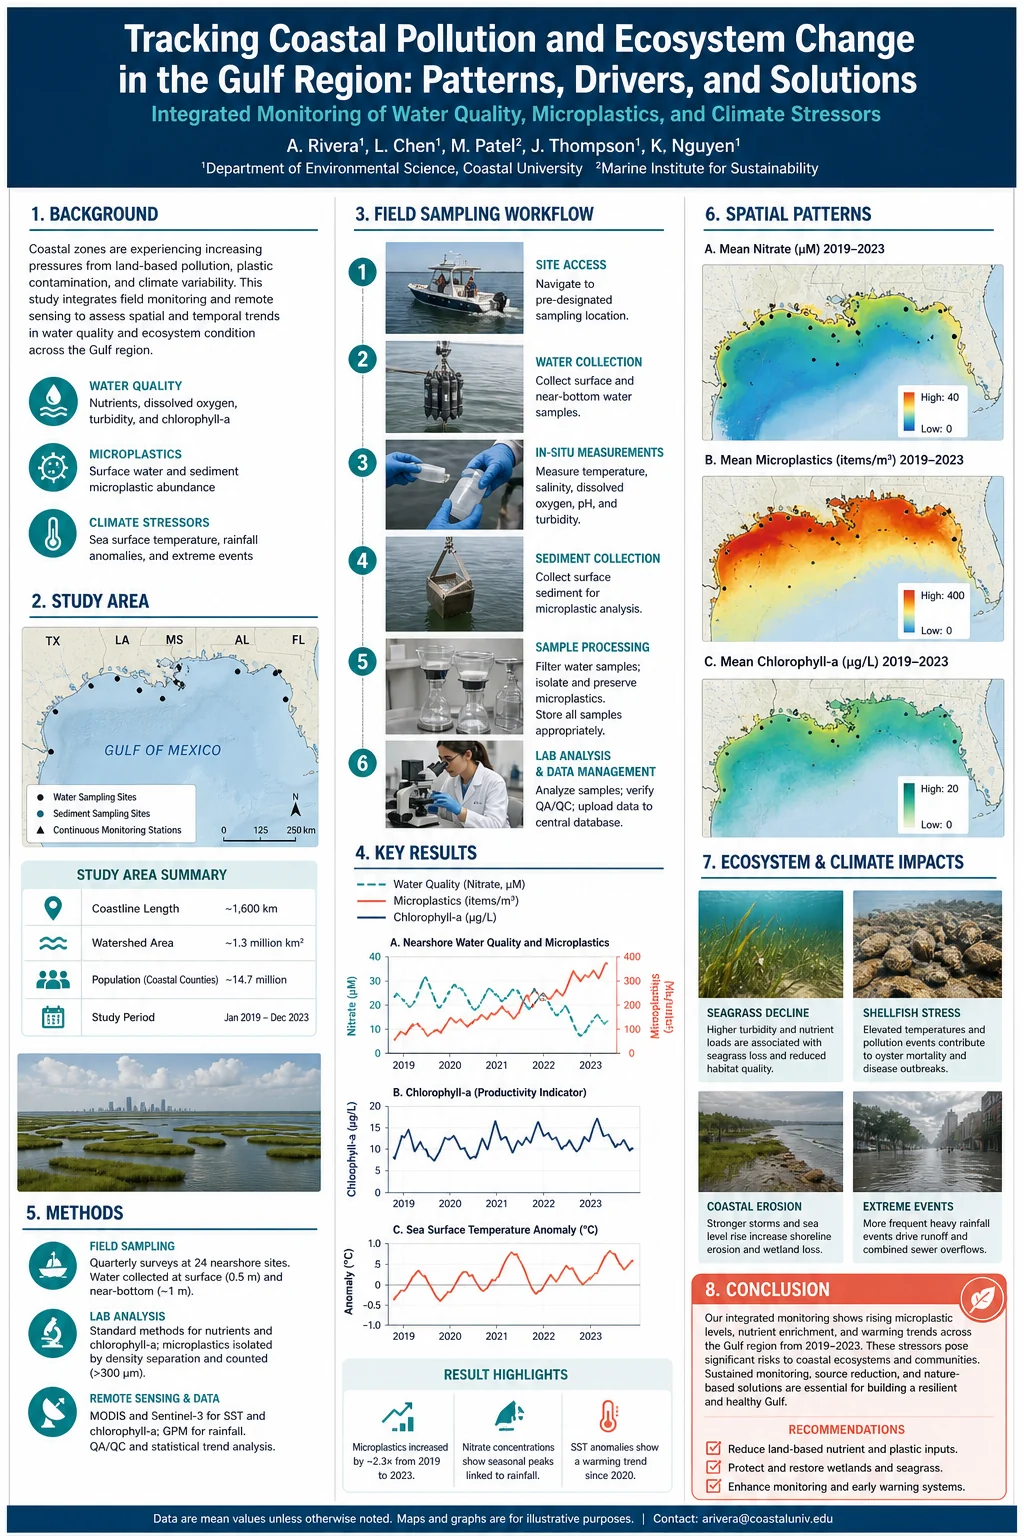
4. Draw time series that carry their own context
Label units and the time standard on the axis, show data gaps as gaps rather than interpolated lines, state any smoothing window, and give the reference period for anomalies. Shade the events you discuss and draw thresholds as labelled lines. The time series plot generator handles dates, gaps and annotations, and the line chart generator suits simpler multi-series comparisons.
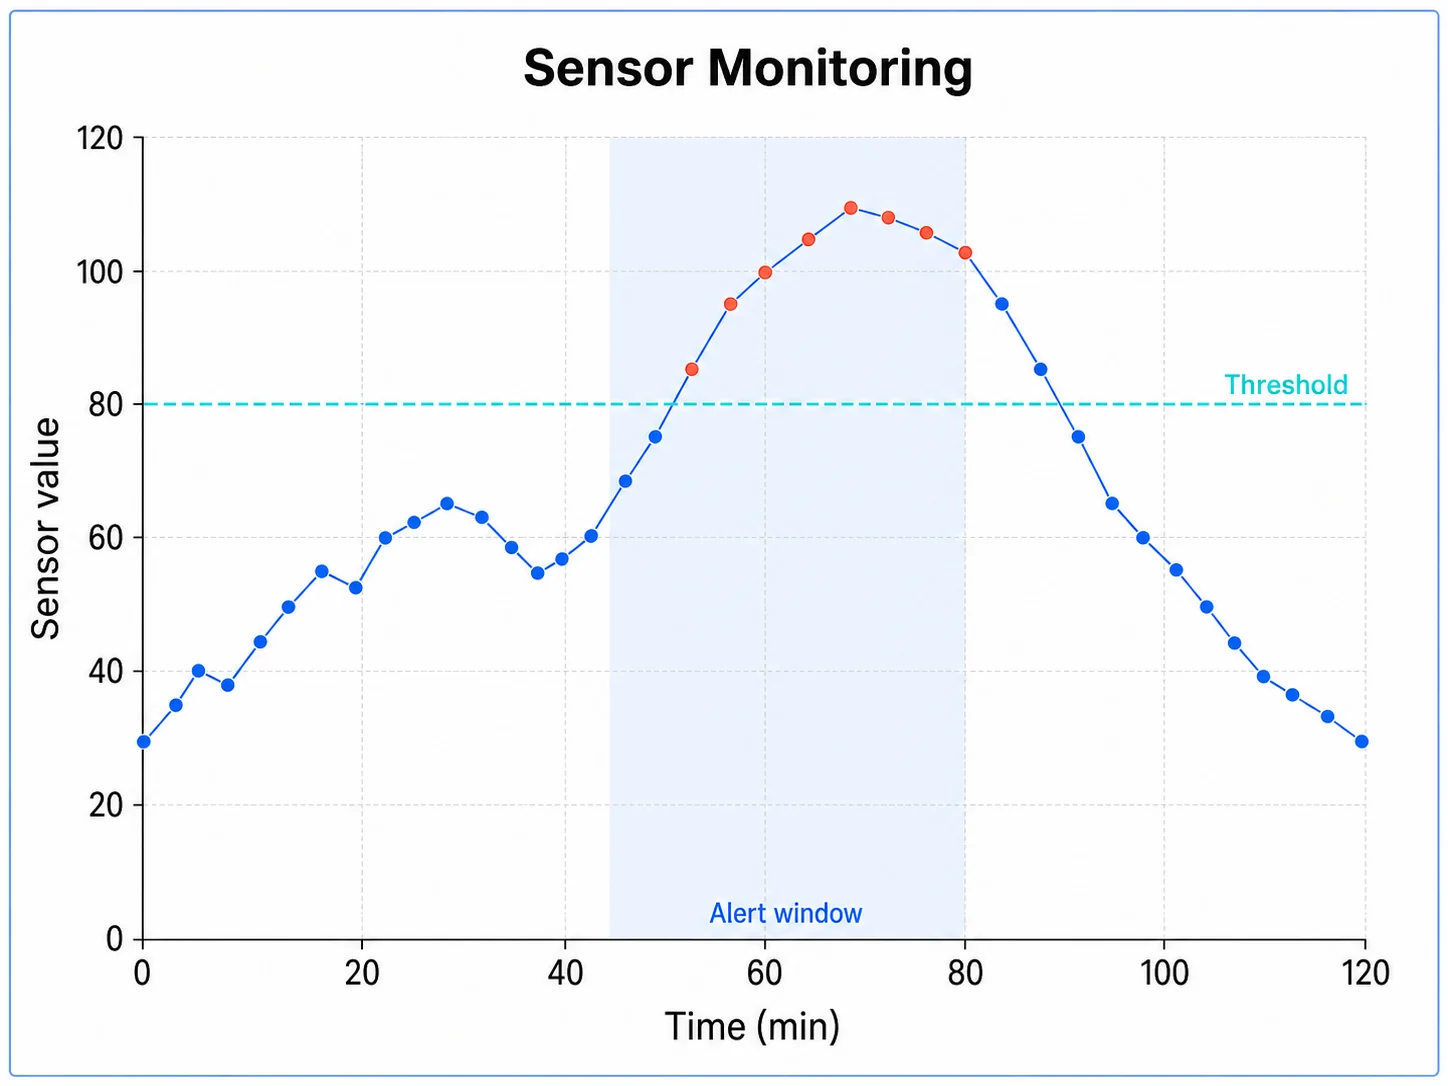
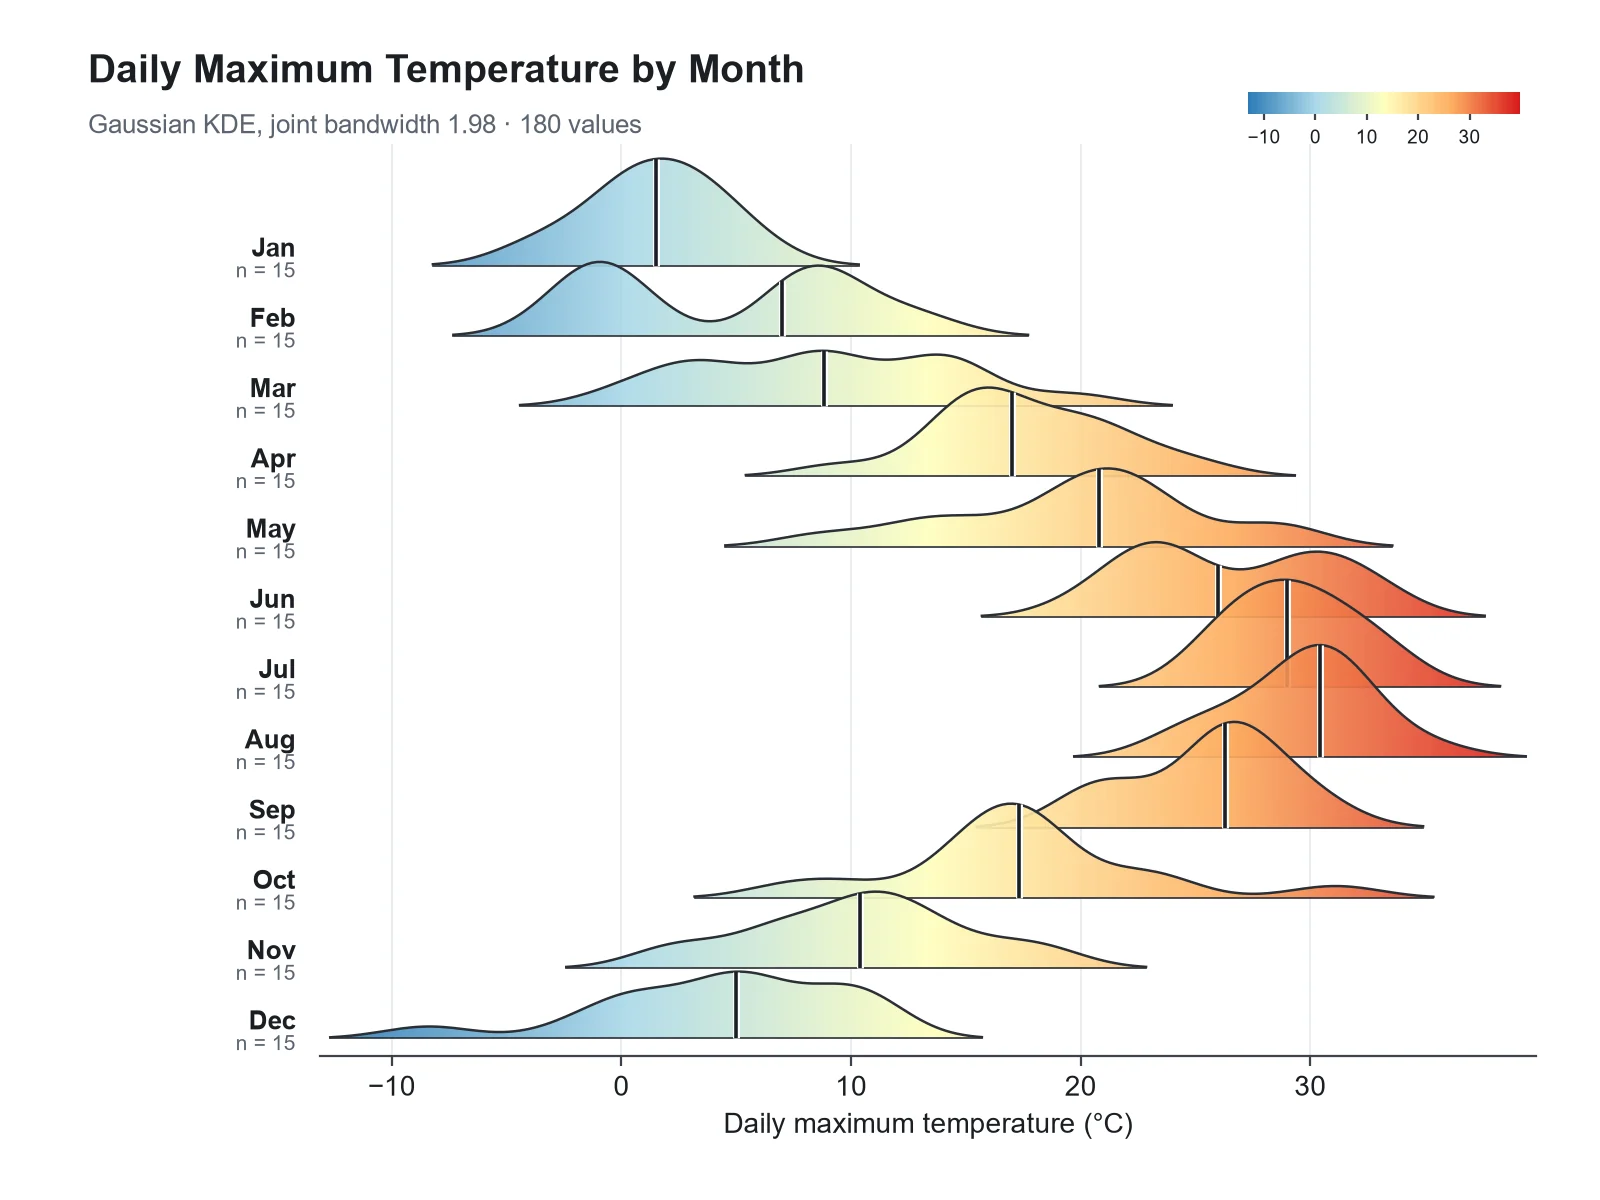
5. Show distributions and seasonal cycles compactly
Monthly or seasonal distributions read well as a ridgeline: twelve stacked densities take less space than twelve histograms and show shifts at a glance. The ridgeline plot maker draws them from raw values, and the box and whisker plot maker is the alternative when you need quartiles and outliers.
6. Compare models with observations honestly
Plot observed against modelled values with a 1:1 line and report the error metric you use; a regression plot or a Bland–Altman plot for instrument comparisons does this cleanly. Show uncertainty as shaded bands, and say whether they are standard deviations, standard errors or ensemble ranges. For relationships among many station variables, a correlation matrix with coefficients printed in each cell is clearer than a page of scatter plots.
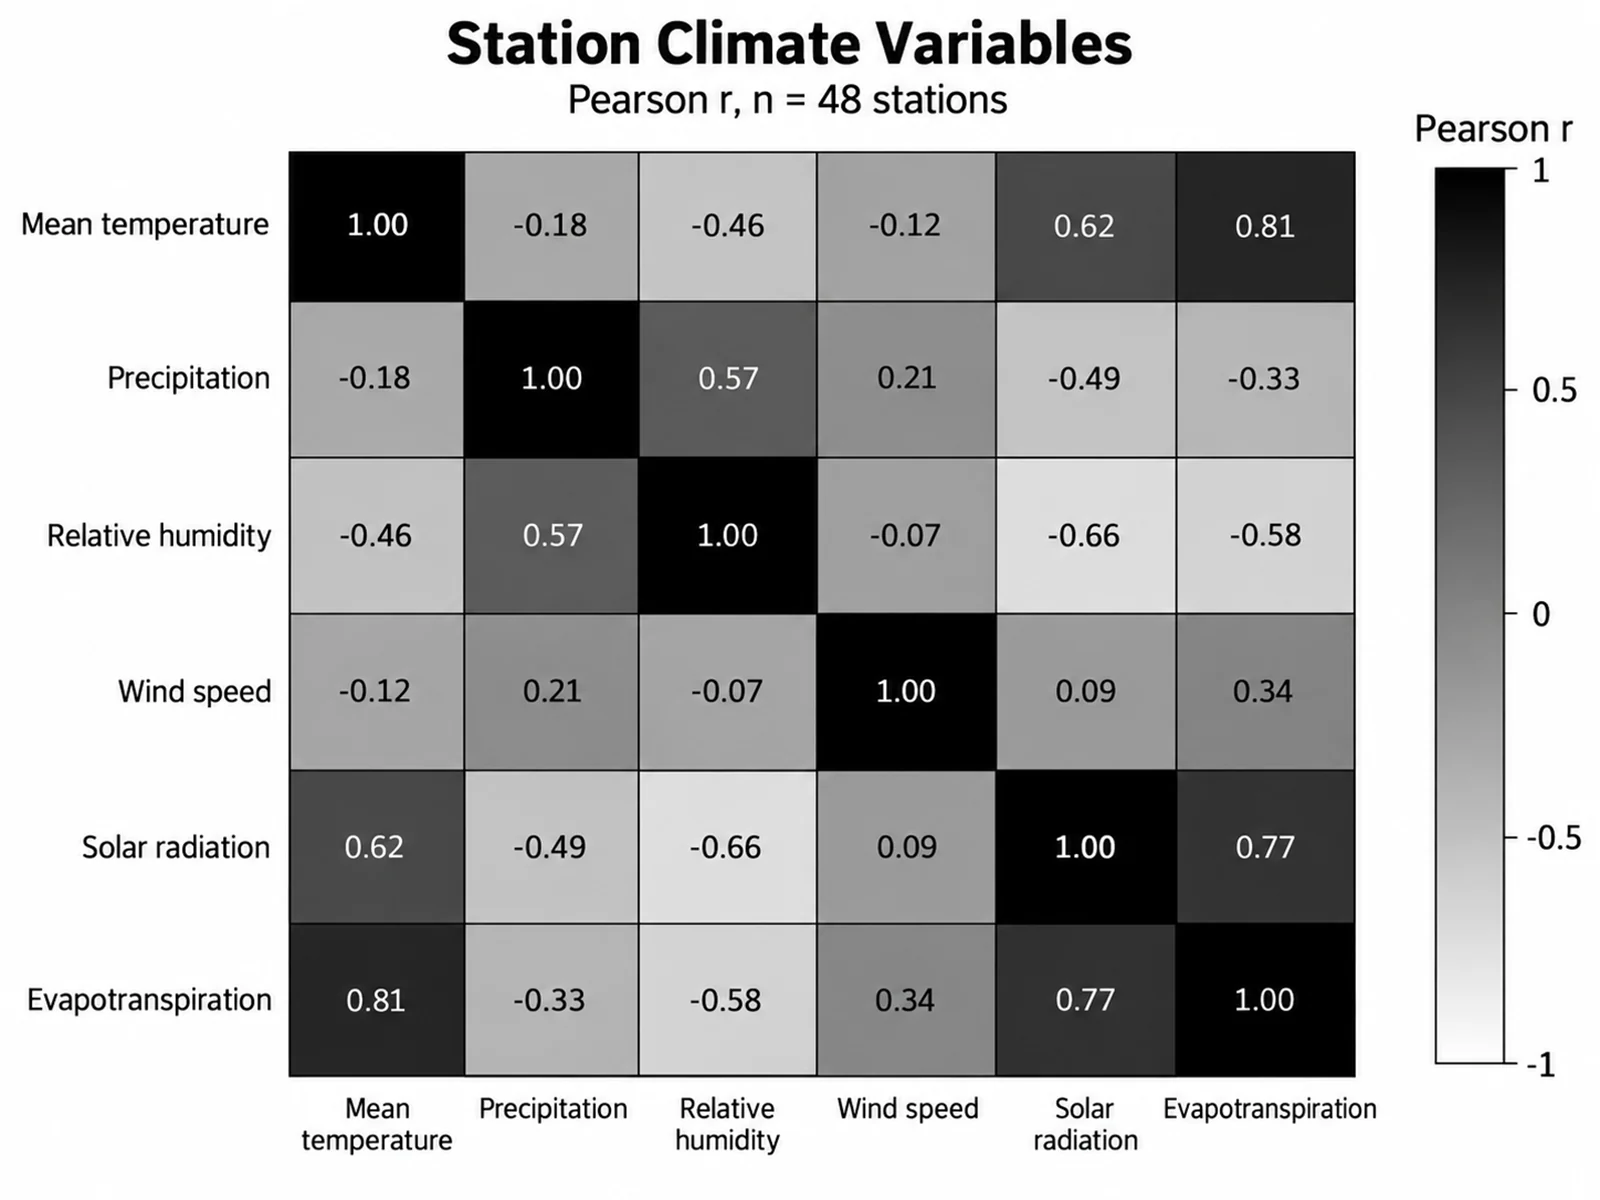
7. Use conceptual diagrams for the system, not the result
A schematic of the process you study (a reservoir model, a flux budget, an instrument setup) belongs in the left column. The water cycle diagram, carbon cycle diagram and biogeochemical cycles diagram pages draw clean starting points, and the scientific diagram maker handles custom systems. Check every label against your own understanding of the system before you print it.
8. Check colour, resolution and accessibility before you print
Run the poster through the colorblind simulator and pick categorical colours from the colorblind-friendly palette reference. Our scientific color palettes guide explains when to use sequential, diverging and categorical scales. Check every satellite image and photo with the image DPI checker at its printed width; aim for 150 DPI or more.
A sample layout for a wide landscape AGU poster
This grid uses an 88 × 44 in landscape print, which fits inside the board's usable area of about 91 × 45 in.
| Zone | Size (in) | Size (cm) | What goes there |
|---|---|---|---|
| Outer margin | 1 | 2.5 | Clear on every side |
| Title band | 86 × 6 | 218 × 15 | Result-style title, authors, affiliations, session code and board number, QR code |
| Left column | 24 wide | 61 wide | Question, study area map, conceptual diagram of the system, data and methods |
| Centre column | 36 wide | 91 wide | Main map panels with a shared colour bar, and the key time series below |
| Right column | 24 wide | 61 wide | Conclusions at the top, model–data comparison, implications and next steps |
| Gutters | 1 | 2.5 | Between columns and bands |
| Footer | 86 × 1.5 | 218 × 4 | Data and code availability, references, funding, contact |
Widths: 1 + 24 + 1 + 36 + 1 + 24 + 1 = 88 in. Height: 1 + 6 + 1 + 32.5 (body) + 1 + 1.5 + 1 = 44 in.
Type sizes at 88 × 44 in: title 120–150 pt, authors 50–60 pt, headings 60–72 pt, body 30–38 pt, map and axis labels at least 24 pt, footer 20–22 pt. PowerPoint cannot make a page wider than 56 in, so design at 44 × 22 in and print at 200%, halving every size. Our font guide and scientific poster layout checklist cover type and spacing.
For the iPoster, keep the same sections but think in screens: one figure per panel, each with a one-sentence takeaway, and a 2–3 minute narration that walks through the main result.
A prompt for drafting your AGU poster
The scientific poster maker turns a description into a full poster draft, a quick way to test arrangements before building the final file. Pick the 16:9 aspect ratio, the closest preset to a 2:1 landscape print, and adapt this prompt:
Create a landscape Earth science conference poster for a wide board, about twice as wide as it is tall. Title band: "[your result as one sentence]", authors, affiliations, session code, board number and a QR code placeholder. Three columns. Left: research question, a study area map with scale bar and latitude/longitude ticks, and a conceptual diagram of the system. Centre (widest): three map panels sharing one colour bar with units, using a perceptually uniform colour scale, and a time series below with shaded events and a labelled threshold. Right: three conclusion statements at the top, an observed-versus-modelled scatter plot with a 1:1 line, and implications. White background, colour-blind-safe palette, no rainbow colour maps, large readable labels.
Use the draft for structure and explanatory panels. Keep maps and plots as the files you made from your data, so every value on the poster is yours. For general principles, see how to make a scientific poster.
How to use this guide, depending on who you are
- Student presenting a first poster: read the at-a-glance table, the mistakes list and the step-by-step section; use the sample layout and prompt as they are.
- Online presenter: focus on the iPoster rows of the format table and step 1, and schedule your chat or video times early in meeting week.
- Researcher planning for AGU27: the abstract guidelines section matters most; the AGU26 deadline fell in early August.
AGU poster checklist
- Landscape print no larger than 8 × 4 ft, ideally about 88 × 44 in.
- Title states the result; session code and board number in the title band.
- Maps with scale bar, latitude/longitude ticks, projection and one shared colour bar with units.
- No rainbow colour maps; diverging scales centred on zero for anomalies.
- Time series with units, time standard, gaps shown and reference period stated.
- Uncertainty shown and defined; model–data comparison with a 1:1 line and an error metric.
- Satellite imagery and basemaps credited.
- Checked in a colour-blindness simulator; every raster at 150 DPI or more at print size.
- Data and code availability in the footer; QR code tested on two phones.
- iPoster built (required online, optional in person), with a short narration if you can.
- Participation confirmed in the Speaker Center; session time saved in the AGU26 app.
Printing and travel tips
- Print before you fly. Large-format printing near a major convention centre in meeting week is expensive and busy.
- Fabric or a sturdy tube. Fabric folds into a carry-on; a tube needs to survive the flight.
- Matte finish. It photographs better and does not reflect hall lights.
- Bring a QR card for people who want the paper or data, and a few push pins of your own.
Frequently asked questions
When and where is AGU26?
December 7–11, 2026, at the Moscone Center in San Francisco. Posters are in Moscone South, Halls A–C.
What is the AGU abstract word limit?
AGU uses a character limit, not a word limit: up to 2,000 characters for the abstract text, excluding spaces but including punctuation, which is roughly 300–350 words. The title can be up to 300 characters.
What was the AGU26 abstract deadline?
August 5, 2026, at 23:59 EDT (03:59 UTC). Abstracts not paid and submitted by then were withdrawn.
How much does it cost to submit an AGU abstract?
The AGU26 guidelines list $80 regular and $45 student, with no fee for affiliations in low- and lower-middle-income countries. The fee is non-refundable and separate from membership and registration.
What size should my AGU poster be?
Up to 8 ft wide by 4 ft high (2.4 × 1.2 m), in landscape, with a usable area of about 91 × 45 in. An 88 × 44 in print fills the board with a margin for pins.
What is an AGU iPoster?
An interactive poster built in AGU's iPosterSessions editor and shown in the online poster gallery. Online presenters must create one; in-person presenters can add one alongside their printed poster.
Can I present my AGU poster online?
Yes. Poster presenters could choose in person or online; online presenters create an iPoster, set their own video or chat times during meeting week, and can add pre-recorded narration.
When are the AGU26 poster sessions?
Monday to Thursday 08:30–12:00 and 14:15–17:45, and Friday 08:30–12:00, Pacific Standard Time.
Can I request an oral presentation at AGU?
No. Authors choose "assign me" or "poster only", and conveners decide which abstracts become talks.
What is a GeoBurst at AGU?
The format that replaced eLightning: an in-person 5-minute talk of exactly 10 slides that auto-advance every 30 seconds, followed by a poster session.
Related guides
- GSA Connects poster guidelines: an 8 × 4 ft landscape board and a layout for geologic maps and sections.
- ASHG poster guidelines: abstract scoring and layouts for human genetics.
- NeurIPS 2026 poster guide: poster sizes and printing by city.
- More meeting guides: AACR, AHA Scientific Sessions and SOHO.
- Colorblind-safe palettes for science figures for maps and plots.
- Graphical abstract maker if the same work is heading to a journal next.
Sources
All pages checked on November 17, 2026.
- American Geophysical Union, AGU26 Abstract Guidelines (deadline, membership, first-author rules, character limits, fees, format and participation requests, session formats, iPoster requirements)
- American Geophysical Union, AGU26 Call for Abstract Submissions (deadline and time)
- American Geophysical Union, AGU26 Online Program home (dates, city, attendance, time zone, online poster numbering, board numbers, online gallery, recordings)
- American Geophysical Union, AGU26 Conference Format and Presenter Guidelines (acceptance notices, November 5 confirmation, alternates and withdrawals, digital poster)
- American Geophysical Union, AGU26 poster sessions in the online program (poster hall location and session times)
- American Geophysical Union, AGU26 iPosterSessions editor (iPoster tool and contacts)
- American Geophysical Union, AGU26 meeting website, Present (venue address; the presenter-resources pages linked from it could not be loaded)