Design Resources
Okabe-Ito Color Palette: HEX Codes, RGB Values and How to Use It in R, Python, Excel and Prism
The Okabe-Ito color palette with exact HEX and RGB codes, the best order, pairs to avoid, and ready-to-copy code for ggplot2, matplotlib, Excel and Prism.
 SciFigure AI
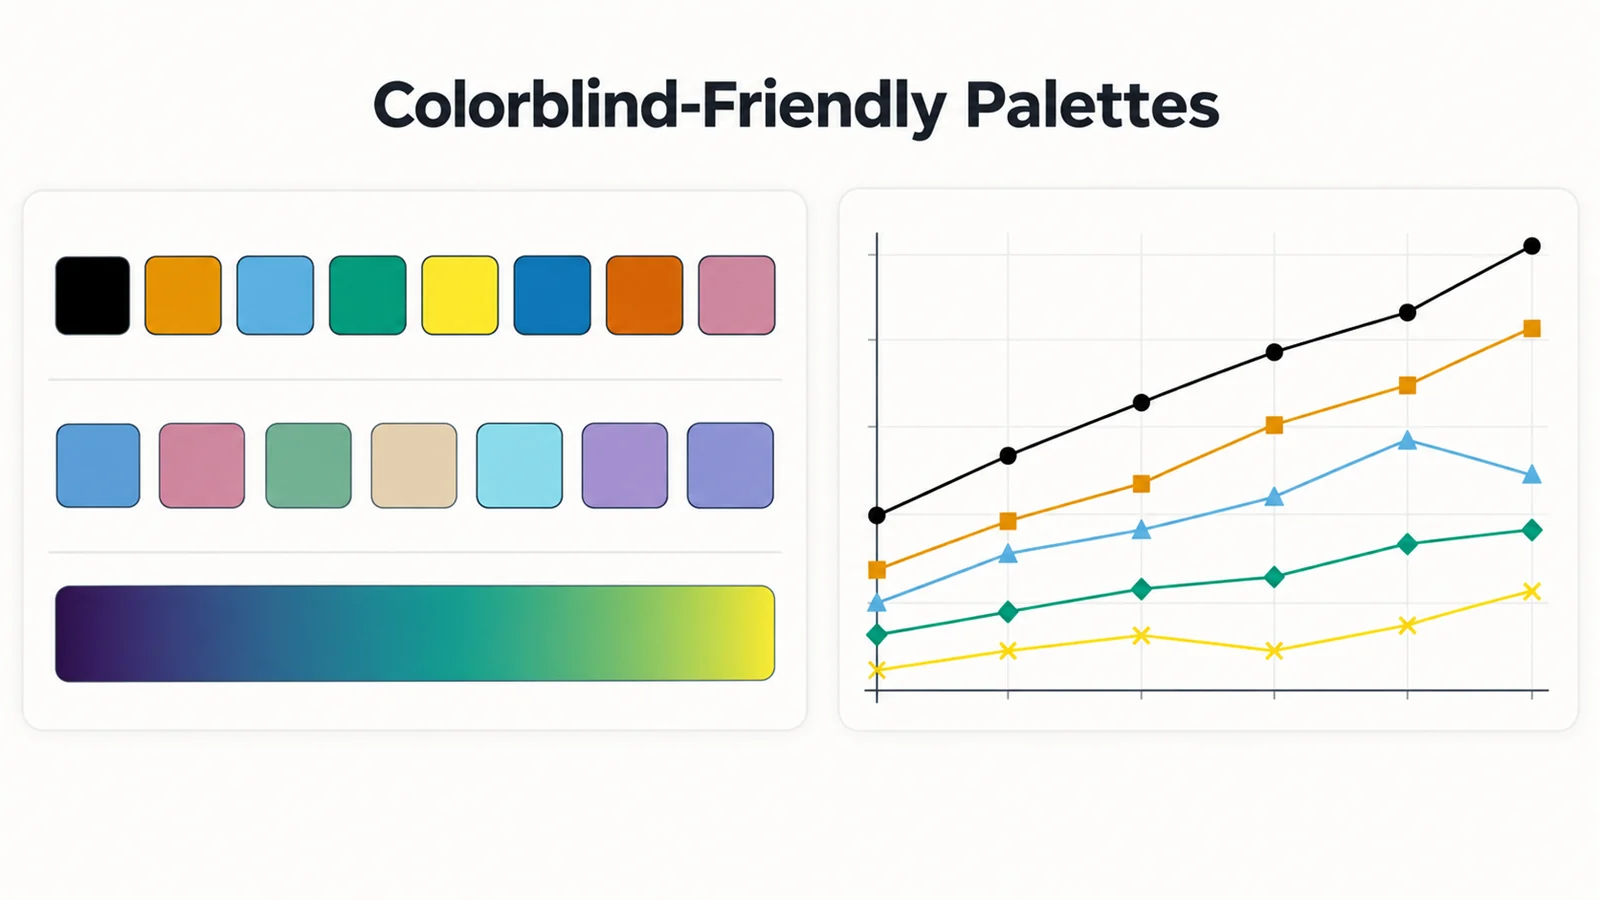
The Okabe-Ito palette is a set of eight colours chosen so that people with the common forms of colour blindness can still tell them apart. It was published by Masataka Okabe and Kei Ito in their Color Universal Design guide (2002, revised 2008), became widely known through Bang Wong's 2011 Points of View column in Nature Methods, and is now built into base R. Nature's figure guidelines cite it as an example of an accessible palette, which is why it is often called the Wong palette and has become the default categorical palette in many labs.
This page is the reference: the exact HEX and RGB values, the order to use them in, the few pairs that need care, and copy-ready code for R, Python, MATLAB, Excel, PowerPoint and GraphPad Prism. For choosing between palette types (categorical, sequential, diverging), see our guide to scientific color palettes.
Okabe-Ito HEX codes and RGB values
| # | Colour | HEX | RGB (0–255) | Contrast on white | Lightness (L*) |
|---|---|---|---|---|---|
| 1 | Black | #000000 | 0, 0, 0 | 21.00:1 | 0 |
| 2 | Orange | #E69F00 | 230, 159, 0 | 2.25:1 | 71 |
| 3 | Sky blue | #56B4E9 | 86, 180, 233 | 2.31:1 | 70 |
| 4 | Bluish green | #009E73 | 0, 158, 115 | 3.42:1 | 58 |
| 5 | Yellow | #F0E442 | 240, 228, 66 | 1.32:1 | 89 |
| 6 | Blue | #0072B2 | 0, 114, 178 | 5.19:1 | 46 |
| 7 | Vermilion | #D55E00 | 213, 94, 0 | 3.87:1 | 54 |
| 8 | Reddish purple | #CC79A7 | 204, 121, 167 | 3.06:1 | 61 |
The colours, names and order are Okabe and Ito's; base R uses the same eight values (spelling the seventh "vermillion") and adds a ninth, gray #999999. The contrast and lightness columns are our own calculations: contrast is the WCAG ratio against a white background, and L* is CIELAB lightness from 0 (black) to 100 (white).
Copy-ready:
#000000, #E69F00, #56B4E9, #009E73, #F0E442, #0072B2, #D55E00, #CC79A7
:root {
  --oi-black: #000000;
  --oi-orange: #E69F00;
  --oi-sky-blue: #56B4E9;
  --oi-bluish-green: #009E73;
  --oi-yellow: #F0E442;
  --oi-blue: #0072B2;
  --oi-vermilion: #D55E00;
  --oi-reddish-purple: #CC79A7;
}
You can preview these colours under each type of colour blindness, and copy them in other formats, in the colorblind-friendly palette tool.
Which order to use
The source order (black, orange, sky blue, bluish green, yellow, blue, vermilion, reddish purple) is a list, not a recommendation for plotting. On a white background, black is usually reserved for axes and reference lines, and yellow is too faint for thin lines. Libraries handle this differently: base R starts with black, while the ggokabeito package moves black to the end so that orange comes first.
For a figure on a white background, this order works well. It is based on our colour-vision simulation (method below) and on Okabe and Ito's own advice to prefer the darker blue and orange for thin lines and small symbols:
| Groups | Colours | Why |
|---|---|---|
| 2 | Blue #0072B2, orange #E69F00 | The most distinct pair in the palette: far apart for every simulated colour-vision deficiency and clearly different in grayscale |
| 3 | + bluish green #009E73 | Stays distinct under all three simulated deficiencies |
| 4 | + vermilion #D55E00 | Close to orange for deuteranopes and to bluish green in grayscale, so pair with marker shapes |
| 5–7 | + sky blue #56B4E9, reddish purple #CC79A7, then yellow #F0E442 | Sky blue matches orange in grayscale; yellow needs fills or thick lines |
If one group is a control or reference, give it black or grey and use the colours for the treatments.
Pairs that need care
No palette is distinct for every reader in every medium. We simulated each pair of the seven colours (black excluded) with the Machado et al. (2009) model at full severity, the same model our colorblind simulator uses, and measured the difference with CIEDE2000 (ΔE). As a rough guide, ΔE above 10 is easy to tell apart in filled areas, 5–10 needs a second cue on small marks, and below 3 the two colours look the same.
| Condition | Closest pairs (ΔE) | What to do |
|---|---|---|
| Deuteranopia (green-weak) | Orange / yellow (11.5), orange / vermilion (12.5) | Avoid these pairs for small points; vary marker shape |
| Protanopia (red-weak) | Blue / reddish purple (12.3), sky blue / reddish purple (14.1) | Fine for areas; add shape or line style on thin lines |
| Tritanopia (blue-weak, rare) | Orange / reddish purple (11.1), bluish green / blue (12.1), sky blue / bluish green (12.2) | Fine for areas; add a second cue on small marks |
| Grayscale printing | Orange / sky blue (0.6), bluish green / reddish purple (2.7), bluish green / vermilion (3.3) | These print as the same grey: use shapes, line styles or labels |
The palette holds up well for colour-blind readers: no pair falls below ΔE 11 under any simulated dichromacy. Its weak point is black-and-white printing, because several colours share almost the same lightness. If a figure must survive grayscale on colour alone, use Paul Tol's three-colour high-contrast scheme (below) or combine Okabe-Ito with marker shapes and line styles.
Contrast on white. Yellow (1.32:1), orange (2.25:1) and sky blue (2.31:1) are below the 3:1 contrast that WCAG 2.1 asks for graphical objects. Use them for filled bars and areas, give them a thin dark outline, or make lines and markers thicker. Blue (5.19:1) is the only colour dark enough for text.
How to use the Okabe-Ito palette in R and ggplot2
Base R (version 4.0.0 and later) includes the palette:
palette.colors(palette = "Okabe-Ito")   # 9 colours: black ... reddish purple, gray
palette("Okabe-Ito")                    # make it the palette for base graphics
In ggplot2, pass the colours to a manual scale. Drop black with [-1] and wrap the result in unname(): R 4.0 to 4.2 return a named vector, and ggplot2 matches named values to your factor levels by name, which can turn every group grey.
library(ggplot2)
oi <- unname(palette.colors(palette = "Okabe-Ito"))[-1]

ggplot(df, aes(time, response, colour = treatment)) +
  geom_line() +
  scale_colour_manual(values = oi)

ggplot(df, aes(group, value, fill = group)) +
  geom_col() +
  scale_fill_manual(values = oi)
The ggokabeito package (on CRAN) wraps this as ready-made scales and lets you pick the order:
library(ggokabeito)
ggplot(df, aes(time, response, colour = treatment)) +
  geom_line() +
  scale_colour_okabe_ito(order = c(5, 1, 3, 6))   # blue, orange, bluish green, vermilion
In ggokabeito's numbering black is moved last, so 1 is orange, 2 sky blue, 3 bluish green, 4 yellow, 5 blue, 6 vermilion, 7 reddish purple, 8 grey and 9 black.
How to use it in Python: matplotlib, seaborn and plotly
matplotlib does not ship the Okabe-Ito colours, so set them as the default colour cycle:
import matplotlib.pyplot as plt
from cycler import cycler

okabe_ito = ["#0072B2", "#E69F00", "#009E73", "#D55E00",
             "#56B4E9", "#CC79A7", "#F0E442", "#000000"]

plt.rcParams["axes.prop_cycle"] = cycler(color=okabe_ito)
Every subsequent plot, scatter and bar call then uses the colours in that order. For seaborn, call sns.set_palette(okabe_ito) or pass palette=okabe_ito to a plotting function. seaborn's built-in "colorblind" palette is a different ten-colour set, so use the list above when you need the exact Okabe-Ito values. In plotly express, pass color_discrete_sequence=okabe_ito.
matplotlib does include accessible cycles of its own (the "tableau-colorblind10" style and, from version 3.10, "petroff10"), but they are different palettes.
How to use it in MATLAB
MATLAB takes RGB values from 0 to 1:
okabeIto = [0.000 0.447 0.698;   % blue
            0.902 0.624 0.000;   % orange
            0.000 0.620 0.451;   % bluish green
            0.835 0.369 0.000;   % vermilion
            0.337 0.706 0.914;   % sky blue
            0.800 0.475 0.655;   % reddish purple
            0.941 0.894 0.259];  % yellow
set(groot, 'defaultAxesColorOrder', okabeIto);
How to use it in Excel, PowerPoint and Word
Office charts take their series colours from the six Accent colours of the document theme, so the cleanest approach is a custom theme colour set:
- In PowerPoint, open Design, then the Variants group's More arrow, then Colors, then Customize Colors. In Excel, open Page Layout, then Colors, then Customize Colors.
- For each of Accent 1 to Accent 6, click the colour button, choose More Colors, open the Custom tab and type the RGB values: Accent 1 blue (0, 114, 178), Accent 2 orange (230, 159, 0), Accent 3 bluish green (0, 158, 115), Accent 4 vermilion (213, 94, 0), Accent 5 sky blue (86, 180, 233), Accent 6 reddish purple (204, 121, 167).
- Name the set (for example "Okabe-Ito") and click Save.
New charts now use the six colours in order. With six accent slots there is no room for yellow or black, which is no loss for most charts: use black for reference lines and avoid yellow for series.
How to use it in GraphPad Prism
Prism has built-in colour-blind-safe colour schemes ("Colorblind Safe" from Prism 8.1, and three more added in Prism 9.5), but GraphPad does not say they are the Okabe-Ito colours. To use the exact values, format one graph by hand, entering the RGB values above for each data set's fill and border, then click the Color Scheme toolbar button and choose Define Color Scheme to save it for reuse. GraphPad also advises against adding transparency to colour-blind-safe colours: semi-transparent fills look washed out and become harder to tell apart, and Prism can add transparency automatically for some graph types (for example 50% fills on bars that share a colour with their symbols), so check the setting in Format Graph.
If you are choosing between Prism and other chart tools, our GraphPad Prism alternative page compares the options.
Related colour-blind-safe palettes
| Palette | Colours | HEX codes | Best for |
|---|---|---|---|
| Paul Tol bright | 7 | #4477AA #EE6677 #228833 #CCBB44 #66CCEE #AA3377 #BBBBBB | Tol's default for lines and labels |
| Paul Tol high-contrast | 3 | #004488 #DDAA33 #BB5566 | Two or three groups that must survive grayscale |
| Paul Tol muted | 9 | #CC6677 #332288 #DDCC77 #117733 #88CCEE #882255 #44AA99 #999933 #AA4499 | More categories (pale grey #DDDDDD for missing data) |
| IBM colour-blind safe | 5 | #648FFF #785EF0 #DC267F #FE6100 #FFB000 | Bold screen and slide figures |
The IBM colour-blind safe palette (Ultramarine 40, Indigo 50, Magenta 50, Orange 40 and Gold 20 in the IBM Design Language colour library) is a popular alternative for presentations, but check it in grayscale: in our calculation its ultramarine #648FFF and orange #FE6100 have the same luminance and print as the same grey. Tol's high-contrast scheme is the only palette here whose colours differ enough in lightness to be told apart in black and white (smallest grayscale difference ΔE 17.8).
For continuous data none of these apply: use a sequential map such as viridis or cividis, covered in our scientific color palettes guide.
Frequently asked questions
What are the Okabe-Ito HEX codes?
#000000 (black), #E69F00 (orange), #56B4E9 (sky blue), #009E73 (bluish green), #F0E442 (yellow), #0072B2 (blue), #D55E00 (vermilion) and #CC79A7 (reddish purple). Base R adds #999999 (gray) as a ninth colour.
Is the Okabe-Ito palette the same as the Wong palette?
Yes. Bang Wong's 2011 Nature Methods column presented Okabe and Ito's colour set to a wide scientific audience, so the same eight colours are often called the Wong palette or the Wong colours.
Is the Okabe-Ito palette colorblind-friendly?
Yes. It was designed so that people with the common red-green deficiencies (protanopia and deuteranopia) can distinguish the colours, and in our simulation no pair drops below ΔE 11 for any type of dichromacy. It does not survive grayscale printing on colour alone, so add shapes or line styles when a figure may be printed in black and white.
How many colours does the Okabe-Ito palette have?
Eight, including black. On a white background you will normally use the seven non-black colours for data, and in practice six or fewer per panel. Base R's version adds a grey for nine.
Who created the Okabe-Ito palette?
Masataka Okabe and Kei Ito, in their Color Universal Design (CUD) guide on making figures and presentations friendly to colour-blind people, first published in 2002 and revised in 2008.
How do I use the Okabe-Ito palette in ggplot2?
Use scale_colour_manual(values = unname(palette.colors(palette = "Okabe-Ito"))[-1]), or install ggokabeito and use scale_colour_okabe_ito() and scale_fill_okabe_ito().
Does matplotlib have the Okabe-Ito palette built in?
No. Set it yourself with plt.rcParams["axes.prop_cycle"] = cycler(color=[...]) using the HEX codes above. matplotlib's built-in "tableau-colorblind10" and "petroff10" styles are different palettes.
Which Okabe-Ito colours should I avoid?
Avoid yellow for thin lines, small points and text on white, because its contrast is only 1.32:1. Avoid relying on orange versus sky blue, or bluish green versus reddish purple or vermilion, in figures that may be printed in grayscale.
Related guides and tools
- Scientific color palettes: qualitative, sequential and diverging palettes, viridis, and journal colour rules.
- Colorblind-safe palettes for science figures: redundant encoding with shapes, lines and labels.
- Colorblind-friendly palette: Okabe-Ito, Tol, IBM, viridis and cividis with previews and code.
- Colorblind simulator: test a finished figure for each type of colour blindness and in grayscale.
- Line chart generator and bar chart generator: charts built with accessible colours.
Sources
- Okabe, M. & Ito, K. Color Universal Design (CUD): How to make figures and presentations that are friendly to colorblind people. 2002, revised 2008.
- Wong, B. (2011). Points of view: Color blindness. Nature Methods, 8, 441.
- R Core Team, grDevices,
palette.colors()documentation and the palette definitions in colorstuff.R. - Barrett, M. ggokabeito: Okabe-Ito scales for ggplot2 and ggraph.
- Tol, P. Colour schemes and templates.
- IBM Design Language, Color library: colour-blind safe palette (archived page).
- Nature Research, Preparing figures: our specifications.
- GraphPad, Colorblind safe color schemes and color transparency.
- matplotlib, What's new in Matplotlib 3.10.0: the petroff10 style.
- Machado, G. M., Oliveira, M. M. & Fernandes, L. A. F. (2009). A physiologically-based model for simulation of color vision deficiency. IEEE Transactions on Visualization and Computer Graphics, 15(6), 1291–1298.
- W3C, Web Content Accessibility Guidelines (WCAG) 2.1, success criterion 1.4.11 (non-text contrast).