
Free tool
Image DPI Checker for Publication Figures
Drop in a figure to read its pixel dimensions and embedded DPI, pick a journal column width, and see whether it reaches 300, 600, or 1,000 DPI at print size. This image DPI checker runs in your browser, so your image never leaves your device.
Drop an image here, or
Your image never leaves your device.
Choose or drop an image, or switch to manual mode, to see effective DPI at your target width.
The DPI stored in a file is a label. Changing it, or upscaling, does not add detail; only more original pixels raise effective resolution. Always confirm your journal's current guide.
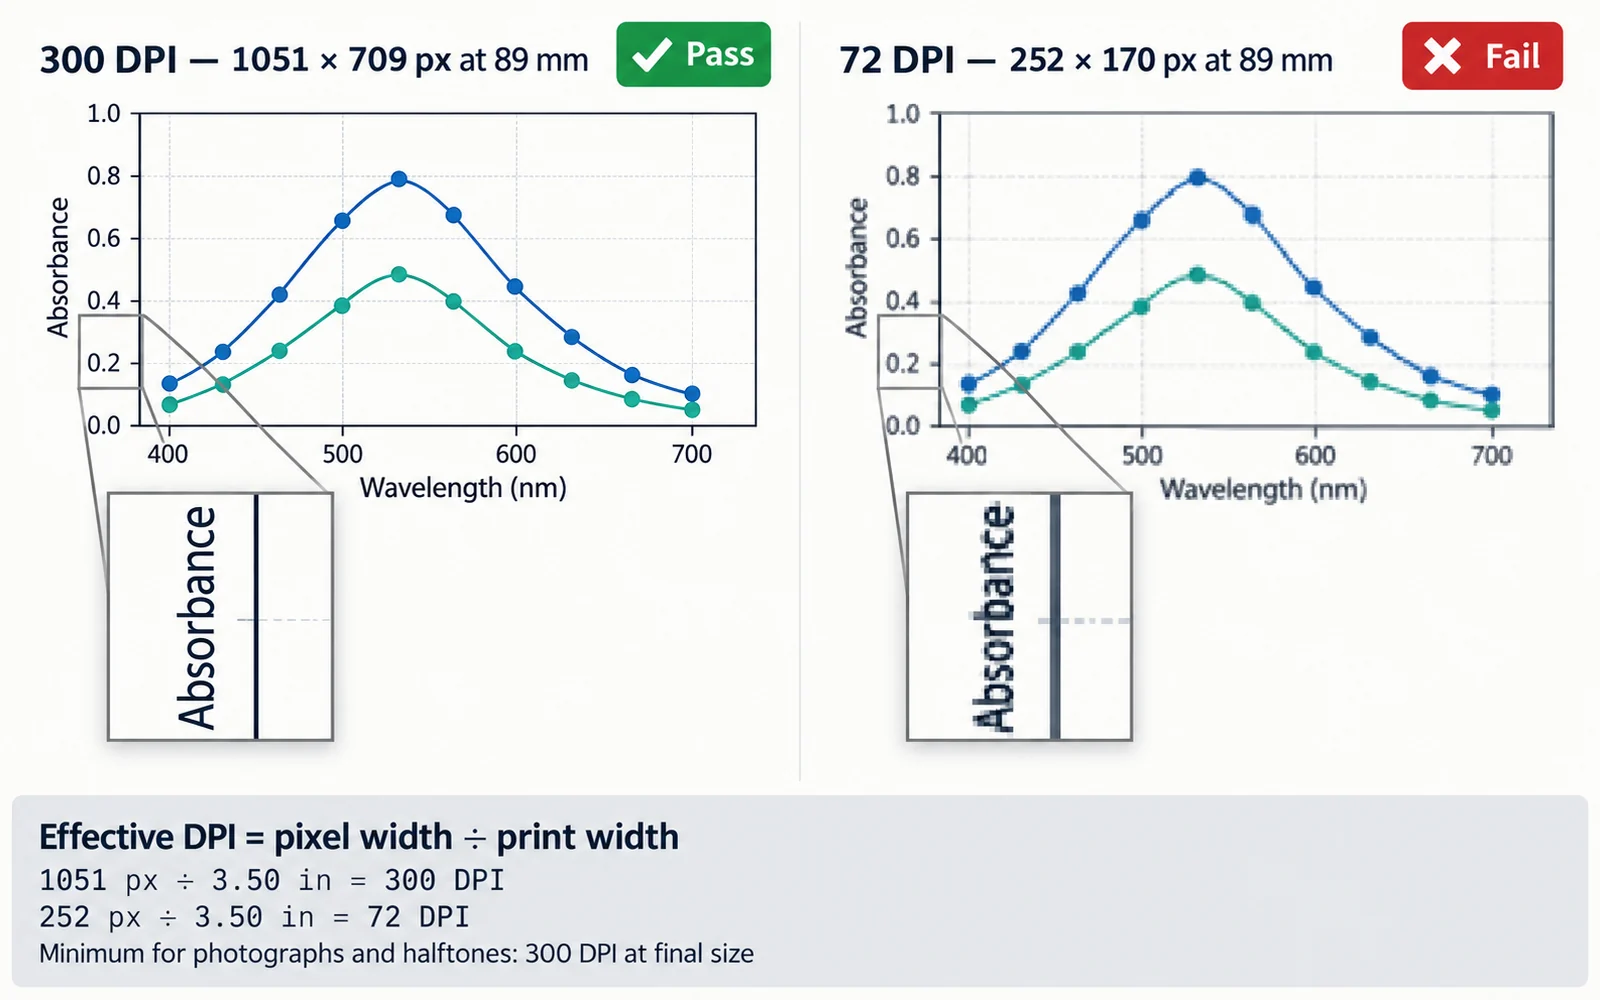
How this image DPI checker works
The number that matters for print is effective resolution: the pixels you have divided by the width the figure will be printed at. The checker reads the pixel width from your file, converts the target width to inches, and divides. A 2,000-pixel-wide image printed in an 89 mm (3.5 in) column has about 571 DPI; the same image stretched across a 183 mm (7.2 in) page has about 278 DPI and would miss a 300 DPI minimum.
- Effective DPI = pixel width ÷ print width in inches (1 inch = 25.4 mm).
- Pixels needed = target DPI × print width in inches, rounded to the nearest pixel.
- Maximum print width = pixel width ÷ target DPI.
- Journal presets use the widths and resolution minimums published in each official guide. Where a guide gives no value, the checker falls back to the common 300 / 600 / 1,000 DPI figure resolution guideline and labels it as general.
DPI vs PPI: what the number in your file means
PPI (pixels per inch) describes a digital image; DPI (dots per inch) originally described printer output. Journals and most software use DPI for both, and so does this page. The DPI stored in a file is only a label: a PNG pHYs chunk, a JPEG JFIF density, or an EXIF or TIFF XResolution tag telling software how large to print the pixels. Changing that label from 72 to 300 makes the default print size smaller but adds no detail. A 1,000-pixel image tagged 300 DPI and the same image tagged 72 DPI contain identical information. That is why this checker shows the embedded value but grades your figure on pixel dimensions and target width.
Why upscaling does not fix low resolution
Resampling an image to more pixels interpolates new pixels from the old ones. The file then passes a simple 300 DPI checker, but edges stay soft, small text stays blurry, and fine structure in micrographs or blots is not recovered. Science's instructions for revised manuscripts state that upsampling of images is not permitted, and image-integrity policies at many journals scrutinize processing. The fix is to go back to the source: re-export the chart from your plotting software at the final size, or use the original camera or microscope file.
Use vector formats for line art
Graphs, diagrams, and schematics made of lines and text are best kept as vector files (SVG for editing, PDF or EPS for submission), which scale to any size without pixels. Publishers ask for very high raster resolution for line art, such as 1,000 DPI at Elsevier or 1,200 DPI at Springer and ACS, because raster lines look jagged at lower resolution. If your journal accepts PDF or EPS, a vector export usually removes the problem. Photographs and micrographs stay raster, and combination figures that mix images with text often need 500 to 600 DPI.
Export at the right size from common tools
Set the physical size first and the resolution second, so fonts print at the size you intended.
- matplotlib: create the figure at print size, for example plt.figure(figsize=(3.5, 2.5)) for an 89 mm column, then fig.savefig("fig1.tiff", dpi=600). For line art, fig.savefig("fig1.pdf") keeps text and lines as vectors.
- R and ggplot2: ggsave("fig1.tiff", width = 89, height = 60, units = "mm", dpi = 600, compression = "lzw"), or ggsave("fig1.pdf", width = 89, height = 60, units = "mm") for a vector file.
- PowerPoint and Keynote: slides are sized for screens, and exporting a slide as PNG or JPEG often gives fewer pixels than a full-width figure needs. Build the figure at its final width, export as PDF where the journal accepts it, and check any raster export here.
- Image editors: when changing print size, turn resampling off so only the DPI label changes. If the effective DPI is still too low, the source needs more pixels.
Frequently asked questions
What DPI do journals require for figures?
Common minimums are 300 DPI for photographs and halftones, 500 to 600 DPI for combination figures, and 1,000 to 1,200 DPI for raster line art, all at final print size. The exact numbers vary: Elsevier lists 300, 500, and 1,000 DPI; Springer lists 300, 600, and 1,200 DPI; MDPI recommends at least 600 DPI for all figures. Check the journal figure requirements table and your journal's own guide.
Does changing the DPI in Photoshop or Preview increase quality?
No. With resampling off, changing DPI only relabels the file and changes its default print size. With resampling on, the software creates pixels by interpolation, which adds no real detail. Effective resolution depends on the original pixel count and the print width.
Why does my image show 72 DPI?
Screenshots, web exports, and some software defaults write 72 or 96 DPI into the file, or no DPI at all. That value is metadata. What matters is whether the pixel width is enough for the print width: a 3,000-pixel-wide image tagged 72 DPI still has about 856 DPI in an 89 mm column.
Is my image uploaded anywhere?
No. The image DPI checker reads the file with your browser's File API and parses the header bytes locally. Nothing is sent to a server, and no account or credits are needed.
Which width should I check: single or double column?
Use the width the figure will be printed at. Most publishers in our table define a single column of roughly 83 to 90 mm and a full page width of roughly 171 to 200 mm. If you are unsure, check at full width: a figure that passes there also passes at single column.
Can I check an SVG or PDF?
Vector lines and text have no fixed pixel resolution, so there is nothing to check for them. Photos embedded in a PDF still have a resolution; run the original image files through the image DPI checker, or enter their pixel dimensions in manual mode.
Related tools
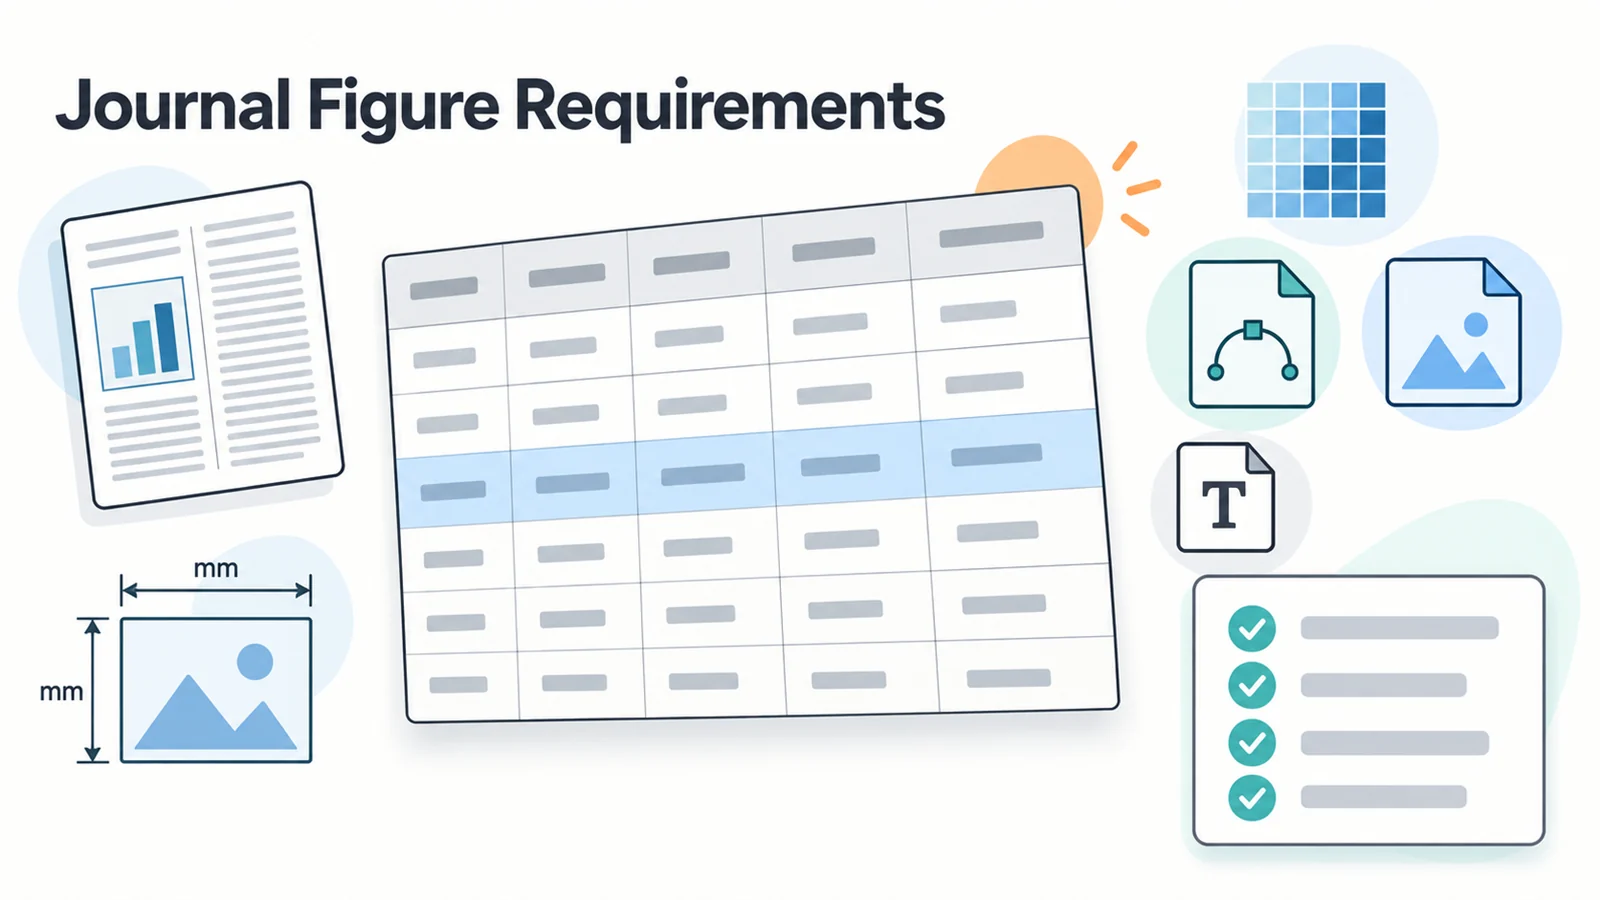
Journal figure requirements
Column widths, DPI, formats, and fonts for 14 publishers, with official source links.

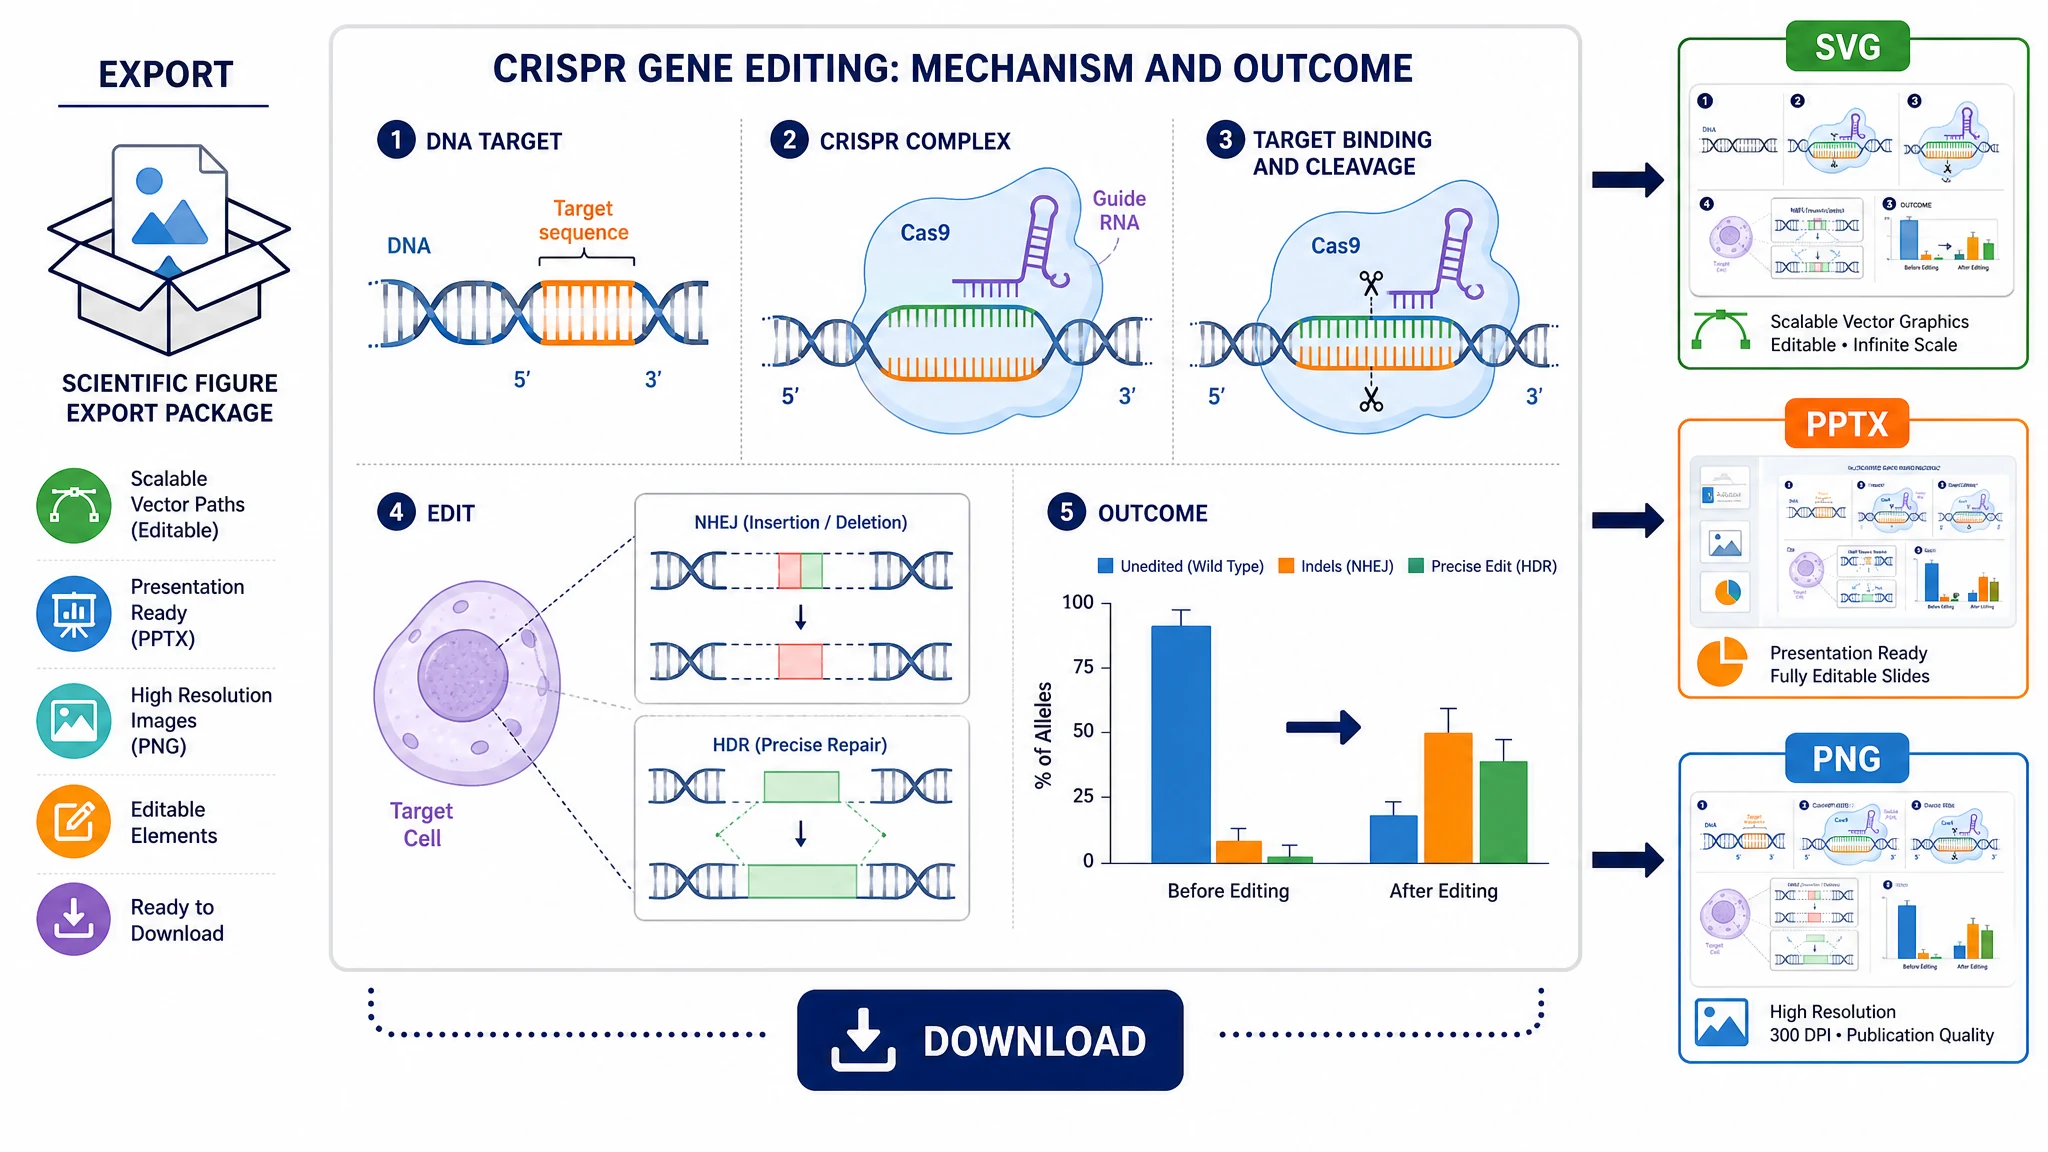
Editable export
Export SVG or PPTX with editable text, arrow, label, and callout layers over the figure image.
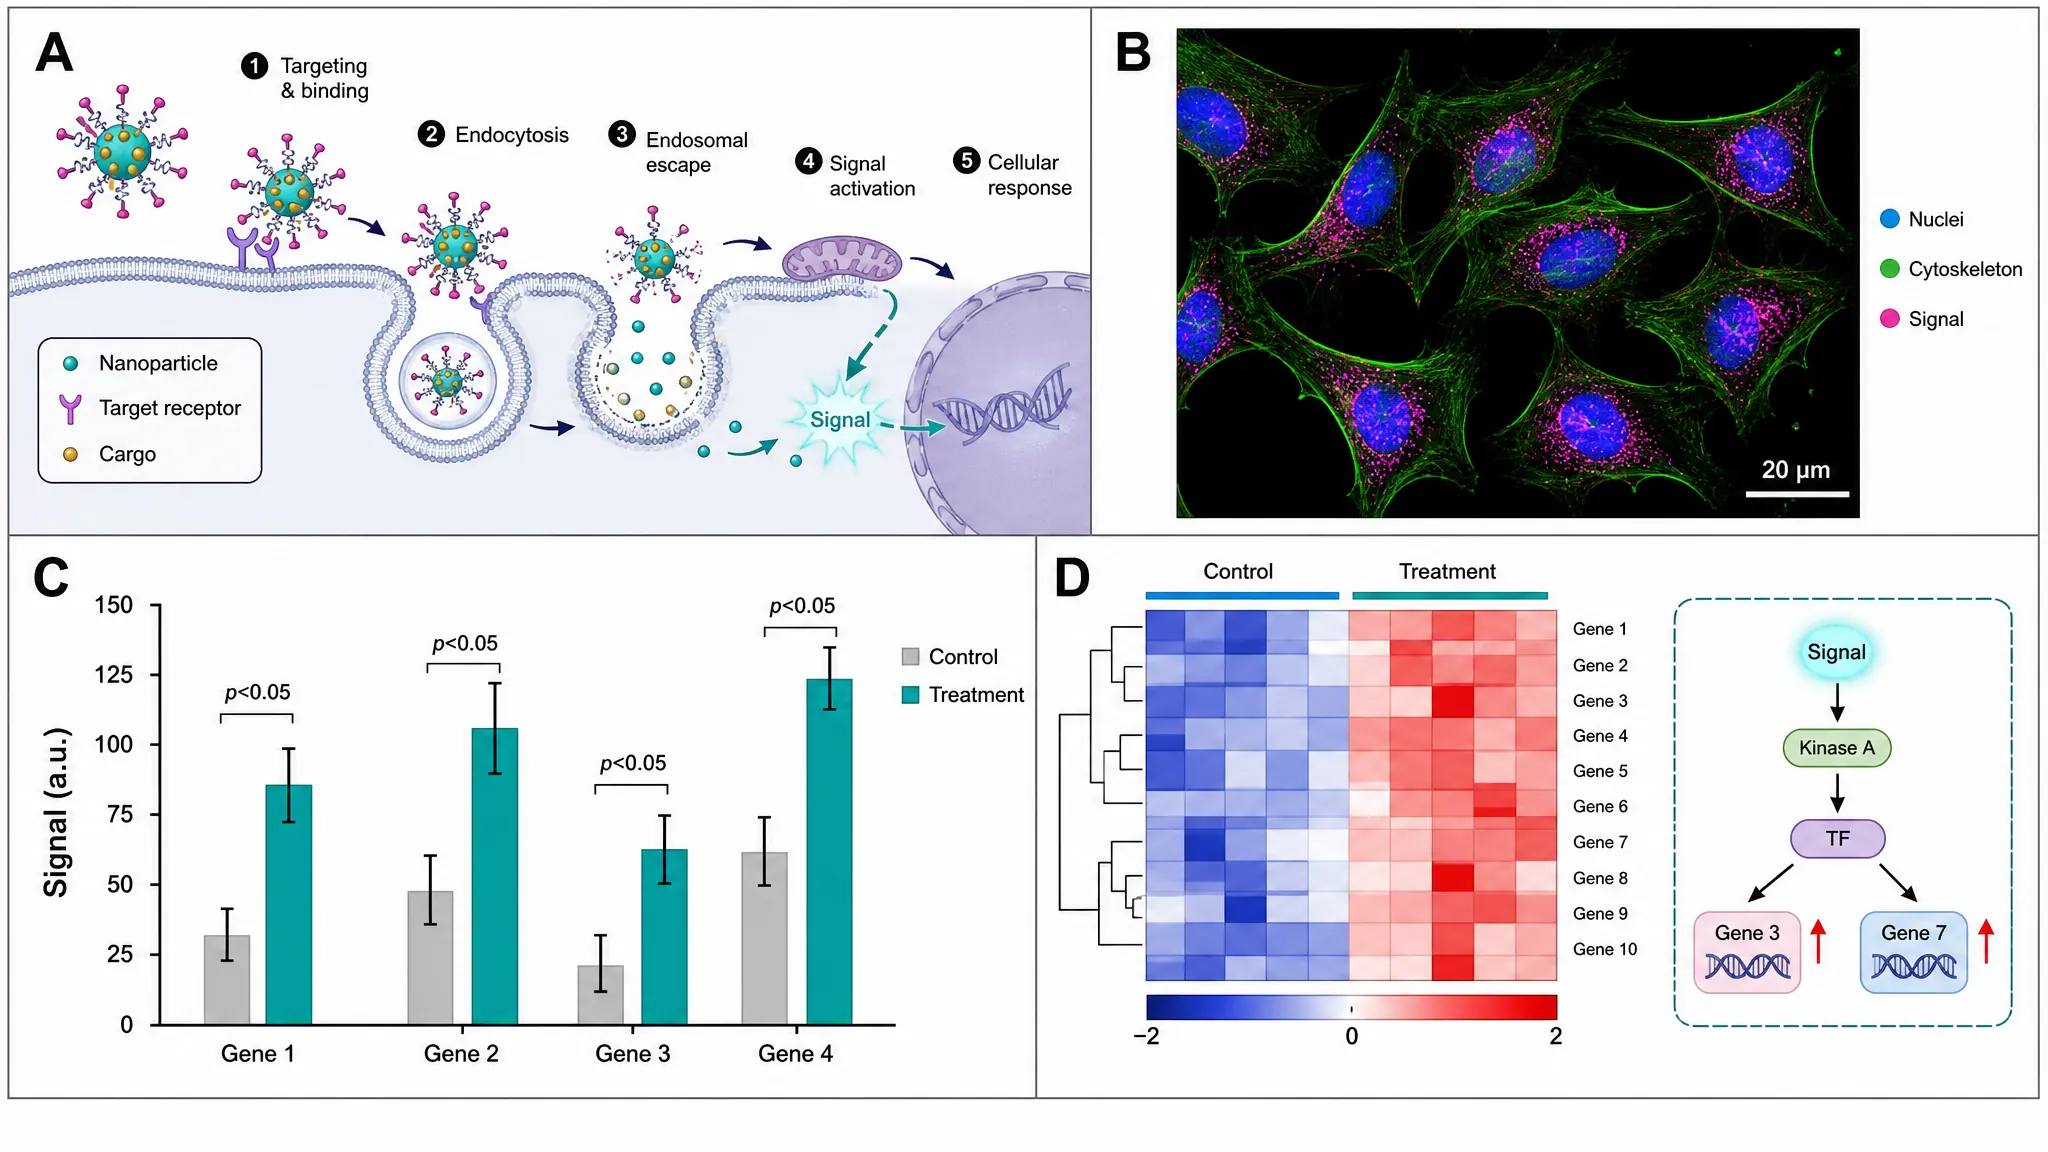
Scientific figure maker
Create scientific figures and illustrations with AI (requires a subscription or credit pack).
Journal submission figure checklist
A step-by-step checklist for getting figures ready before you submit.
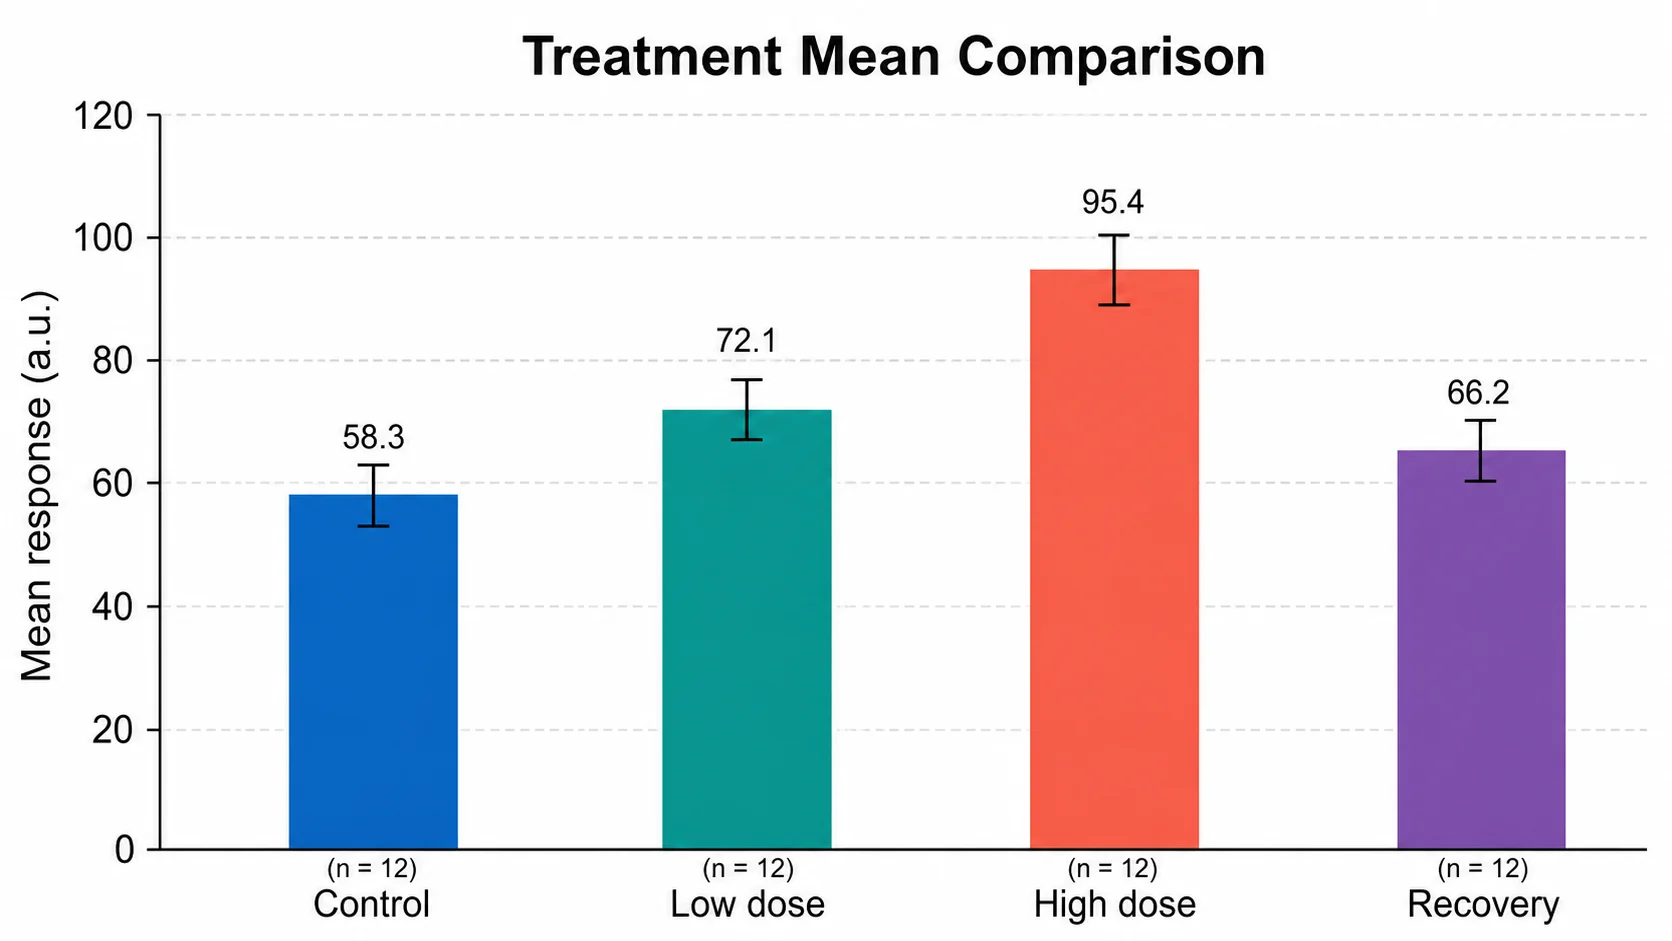
Bar chart generator
Upload CSV or Excel data and get a publication-style bar chart for 5 credits. Free credits work.
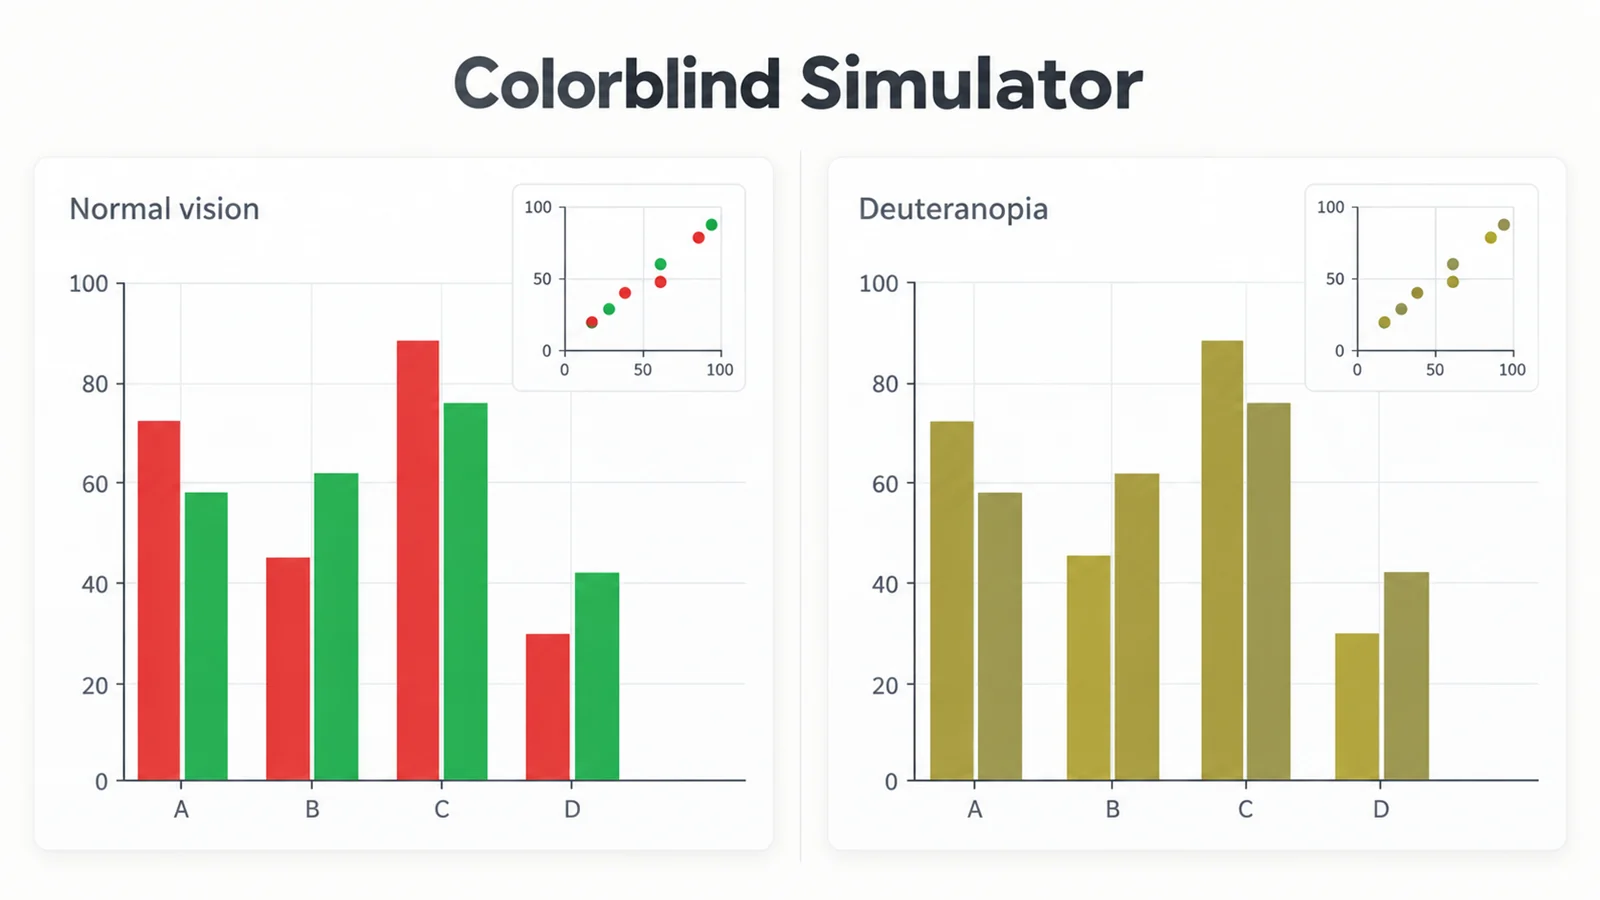
Colorblind simulator
Preview the same figure under protanopia, deuteranopia, and tritanopia.
Need the chart itself?
SciFigure chart generators turn CSV or Excel data into publication-style charts for 5 credits each, and free credits work for charts.
Browse chart generatorsLast checked: September 15, 2026. Journal presets come from official author guidelines; see journal figure requirements for details. Always confirm your journal's current guide.
Sources: Nature Portfolio · Science (AAAS) · PLOS · Elsevier · Wiley · Springer · ACS Publications · IEEE · Frontiers · MDPI · PNAS · eLife · Royal Society of Chemistry (RSC)