Prompt
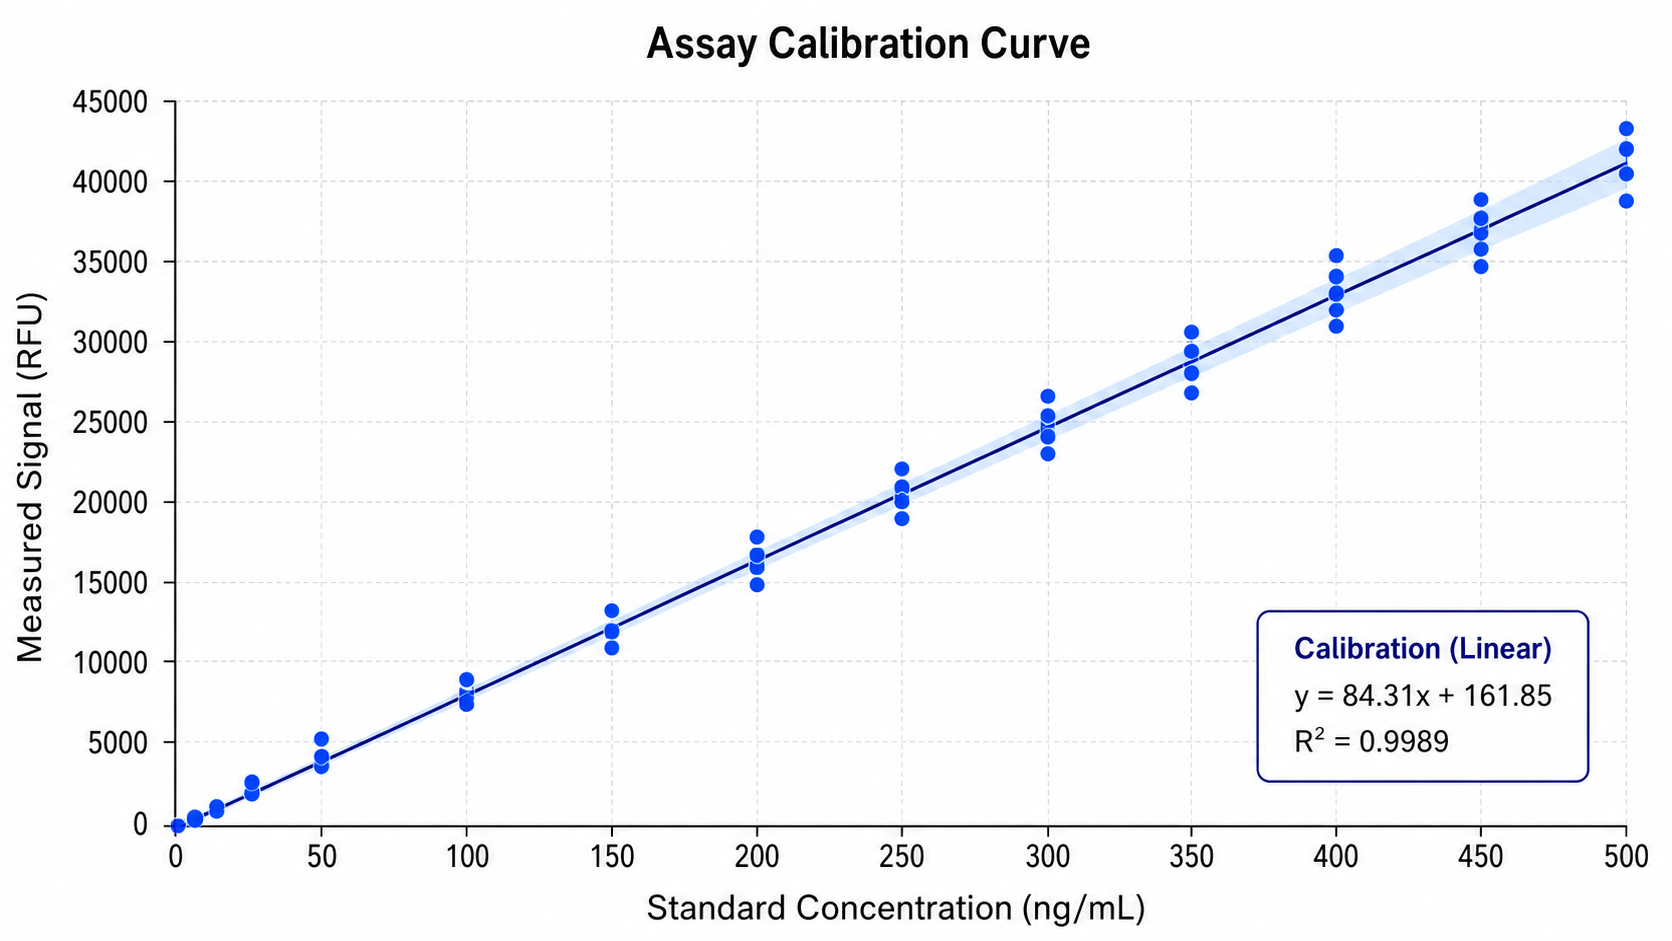
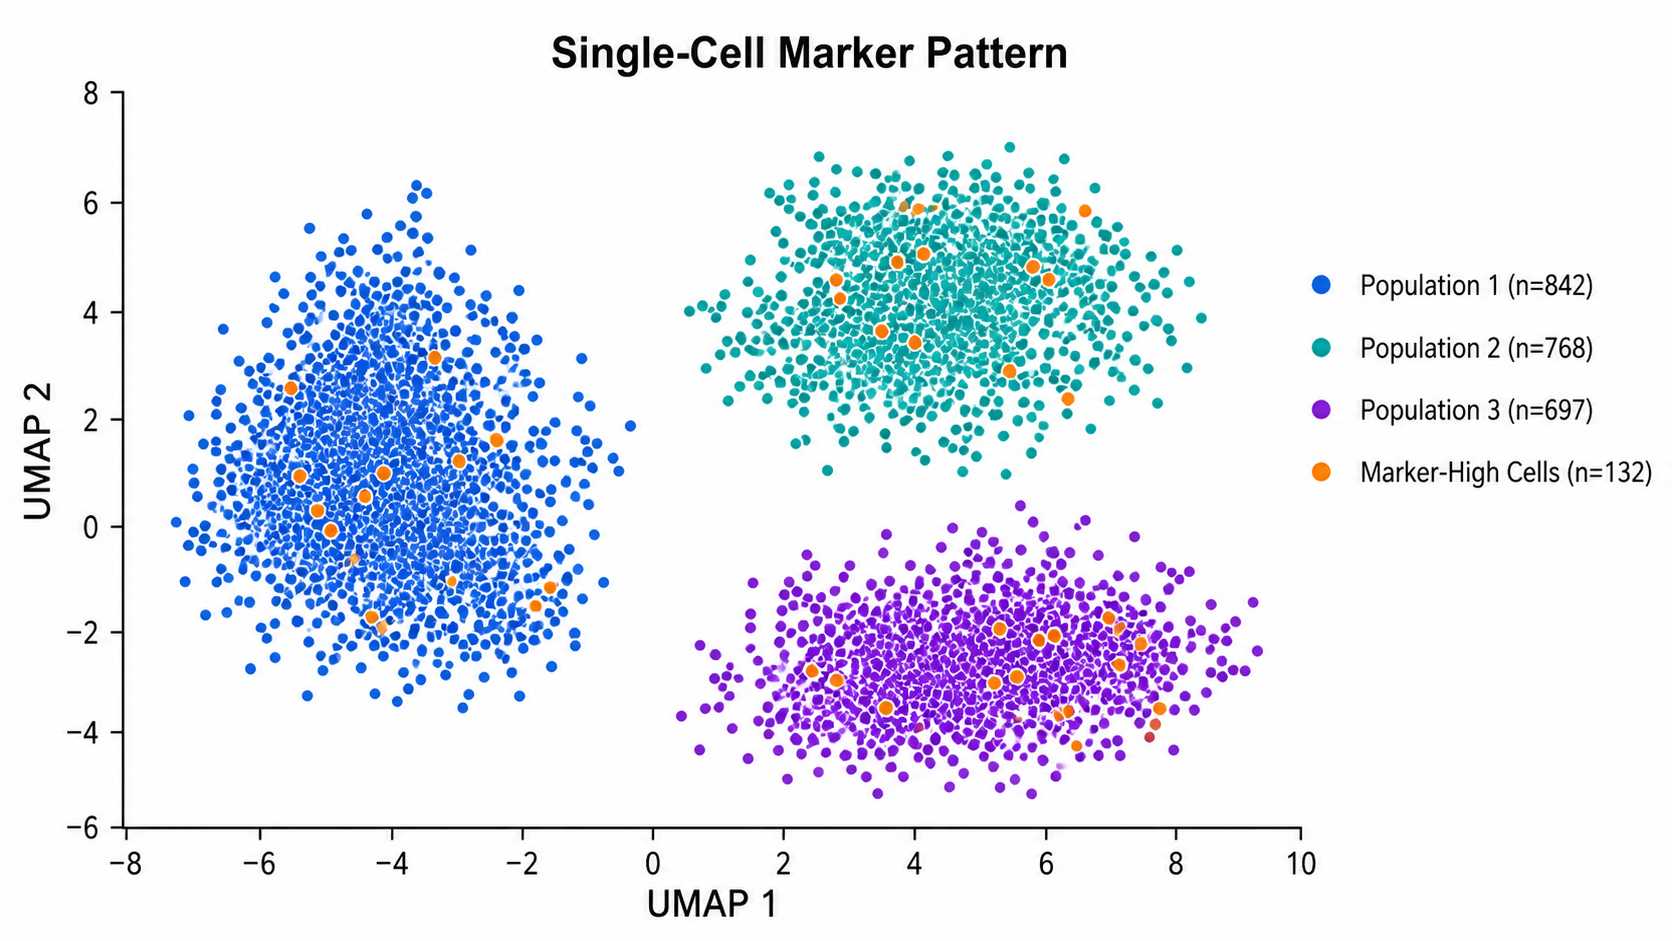
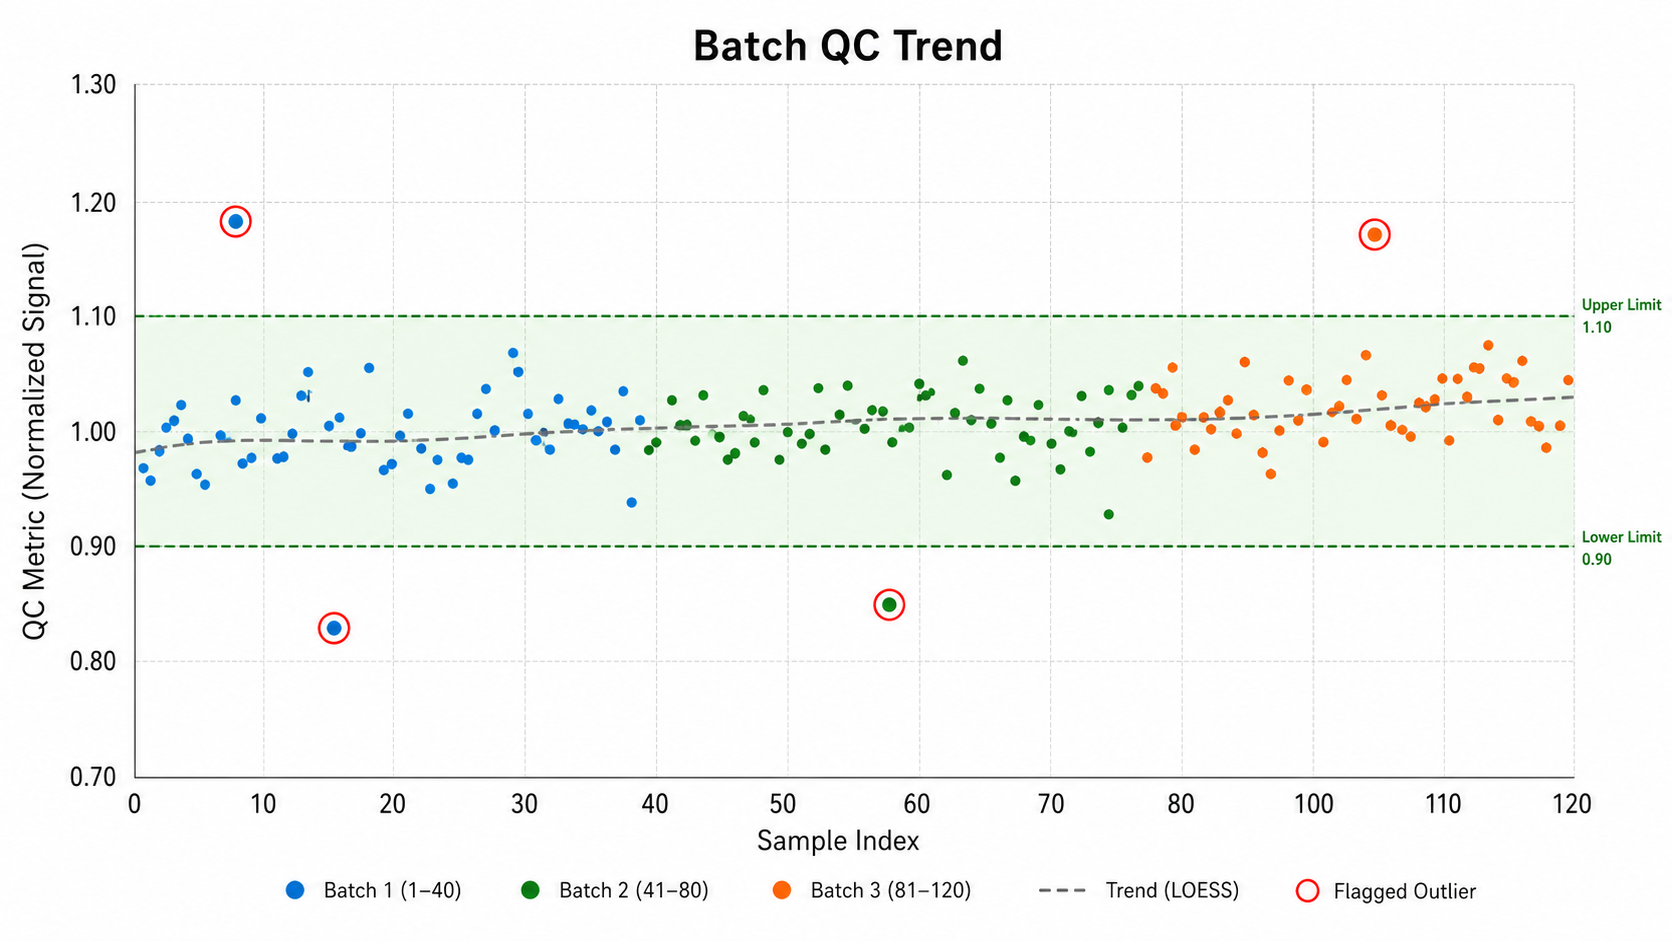
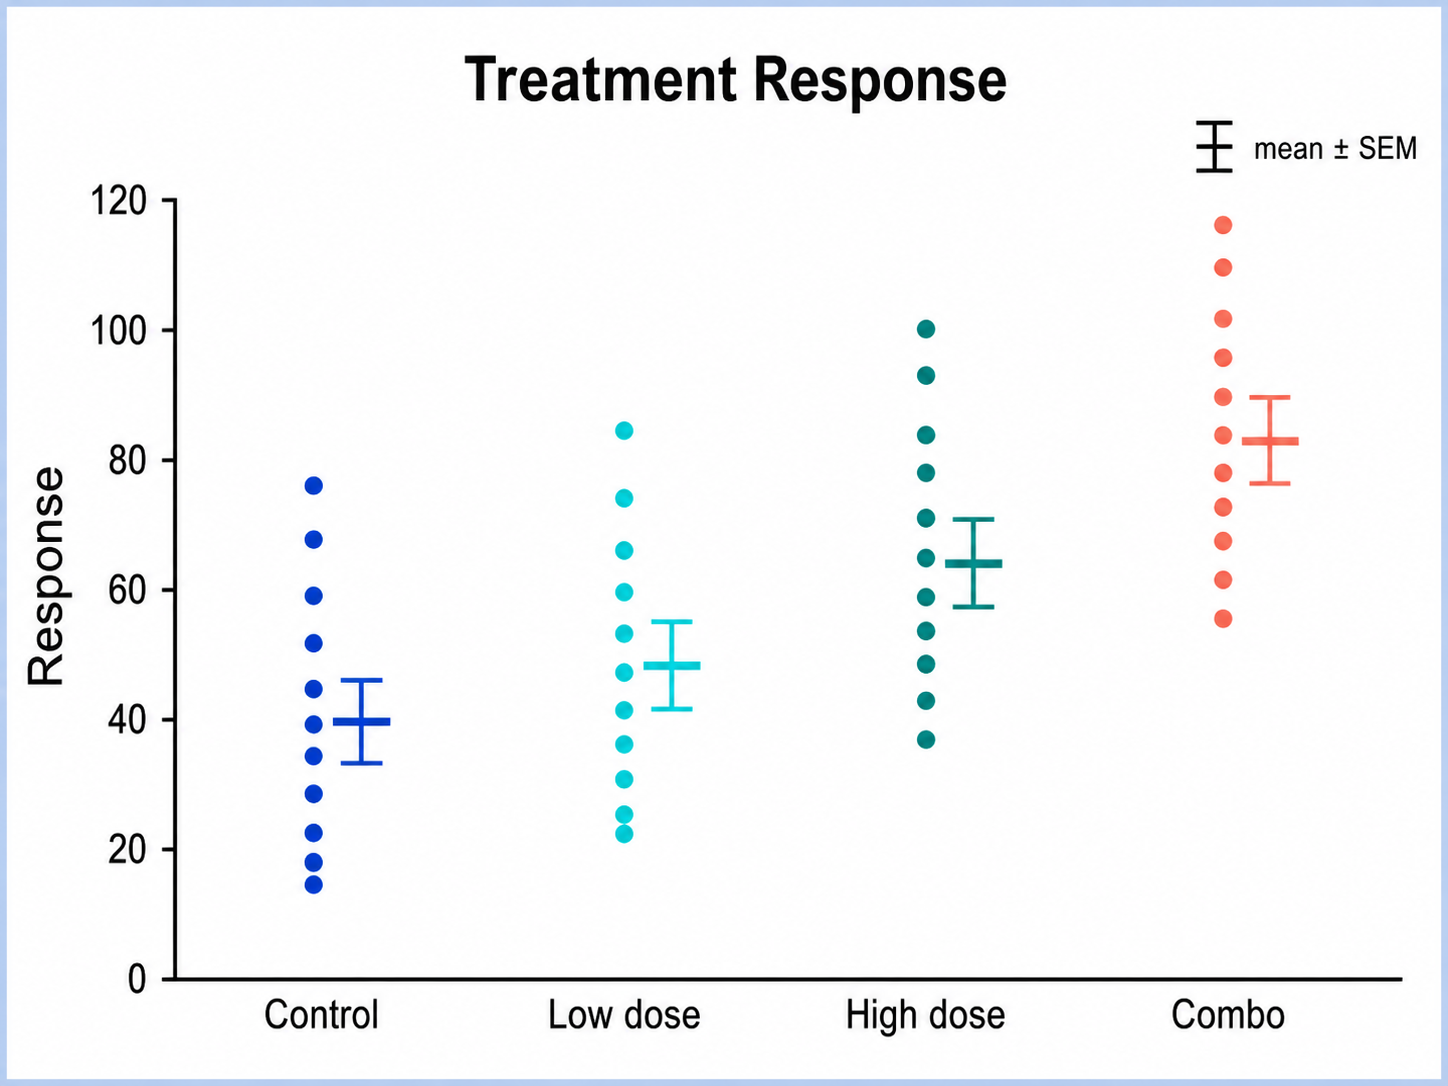
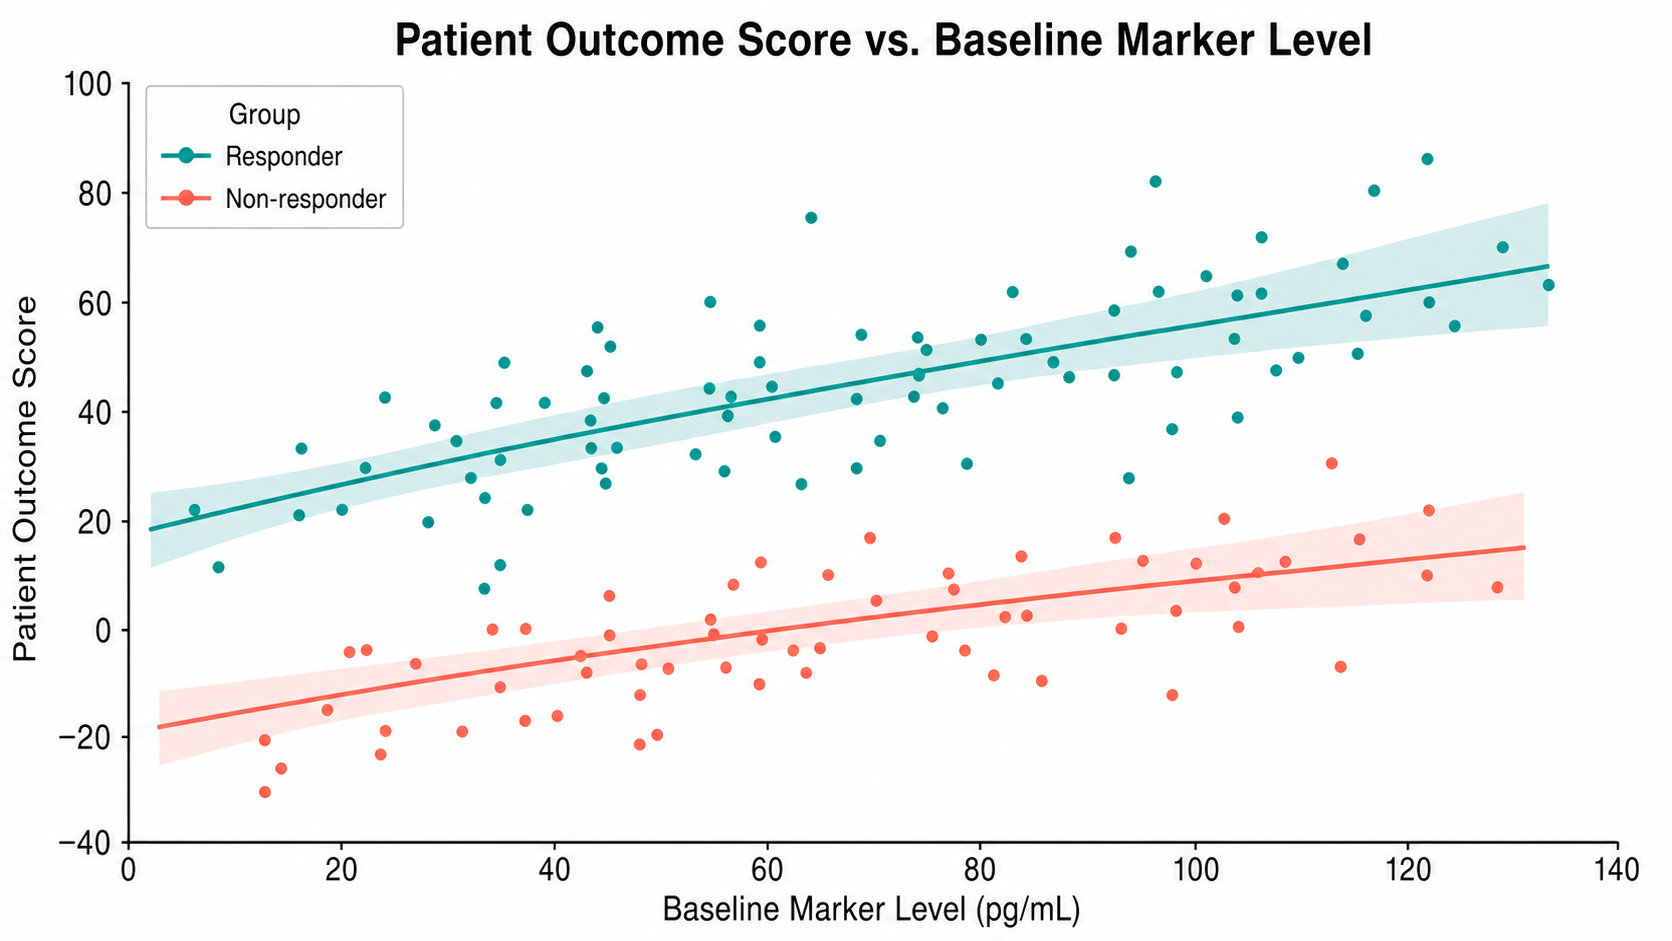
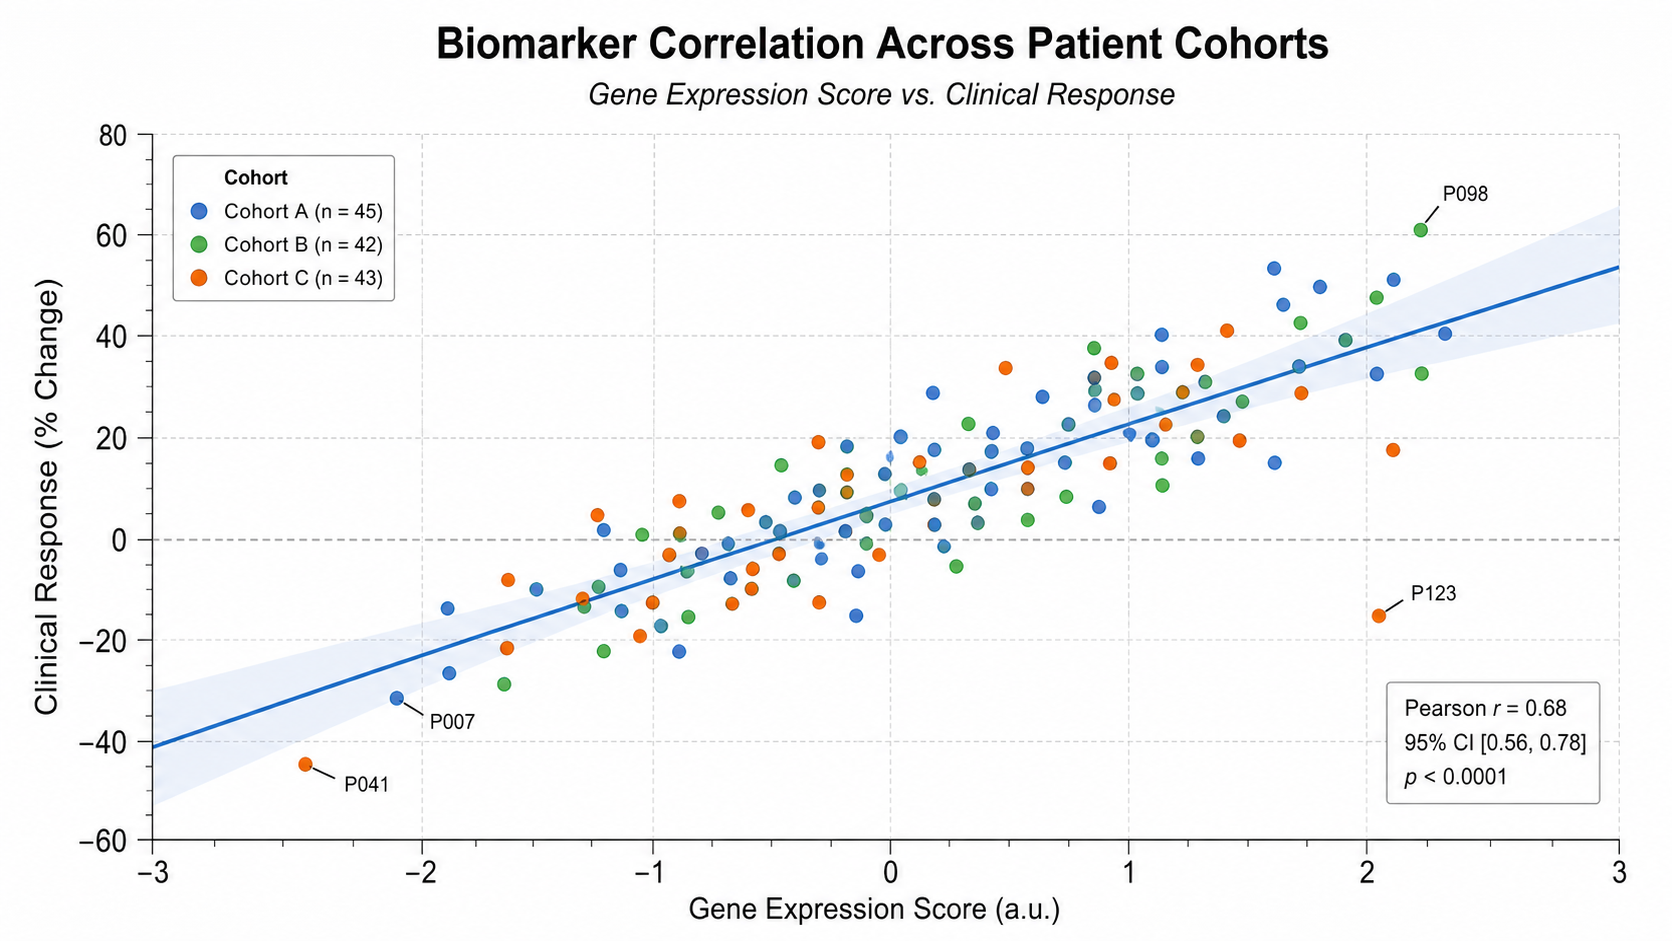
Based on the uploaded biomarker_response.csv file, create a clean scientific scatter plot showing biomarker expression on the x-axis and treatment response on the y-axis. Color points by patient cohort, add a linear trend line with a light confidence band, label only the most important outliers, and use a publication-ready white background with readable axis labels.