
Free phylogenetics tool
Phylogenetic tree maker for Newick files
Paste a Newick tree from IQ-TREE, RAxML-NG, FastTree, or MEGA and get a clean rectangular phylogram, cladogram, or circular tree. Midpoint root it, ladderize it, show bootstrap support above a threshold, color clades, and export SVG or high-resolution PNG. This phylogenetic tree maker runs entirely in your browser.
Everything runs in your browser. Your tree never leaves your device. NEXUS files are read too: the first tree in the TREES block is used.
Click an internal node in the tree (or focus it with Tab and press Enter), or list tip names below.
Branch lengths are drawn to scale; the bar shows one unit of the scale.
Tip: internal nodes are clickable dots. Selecting one colors that clade with the highlighted palette color.
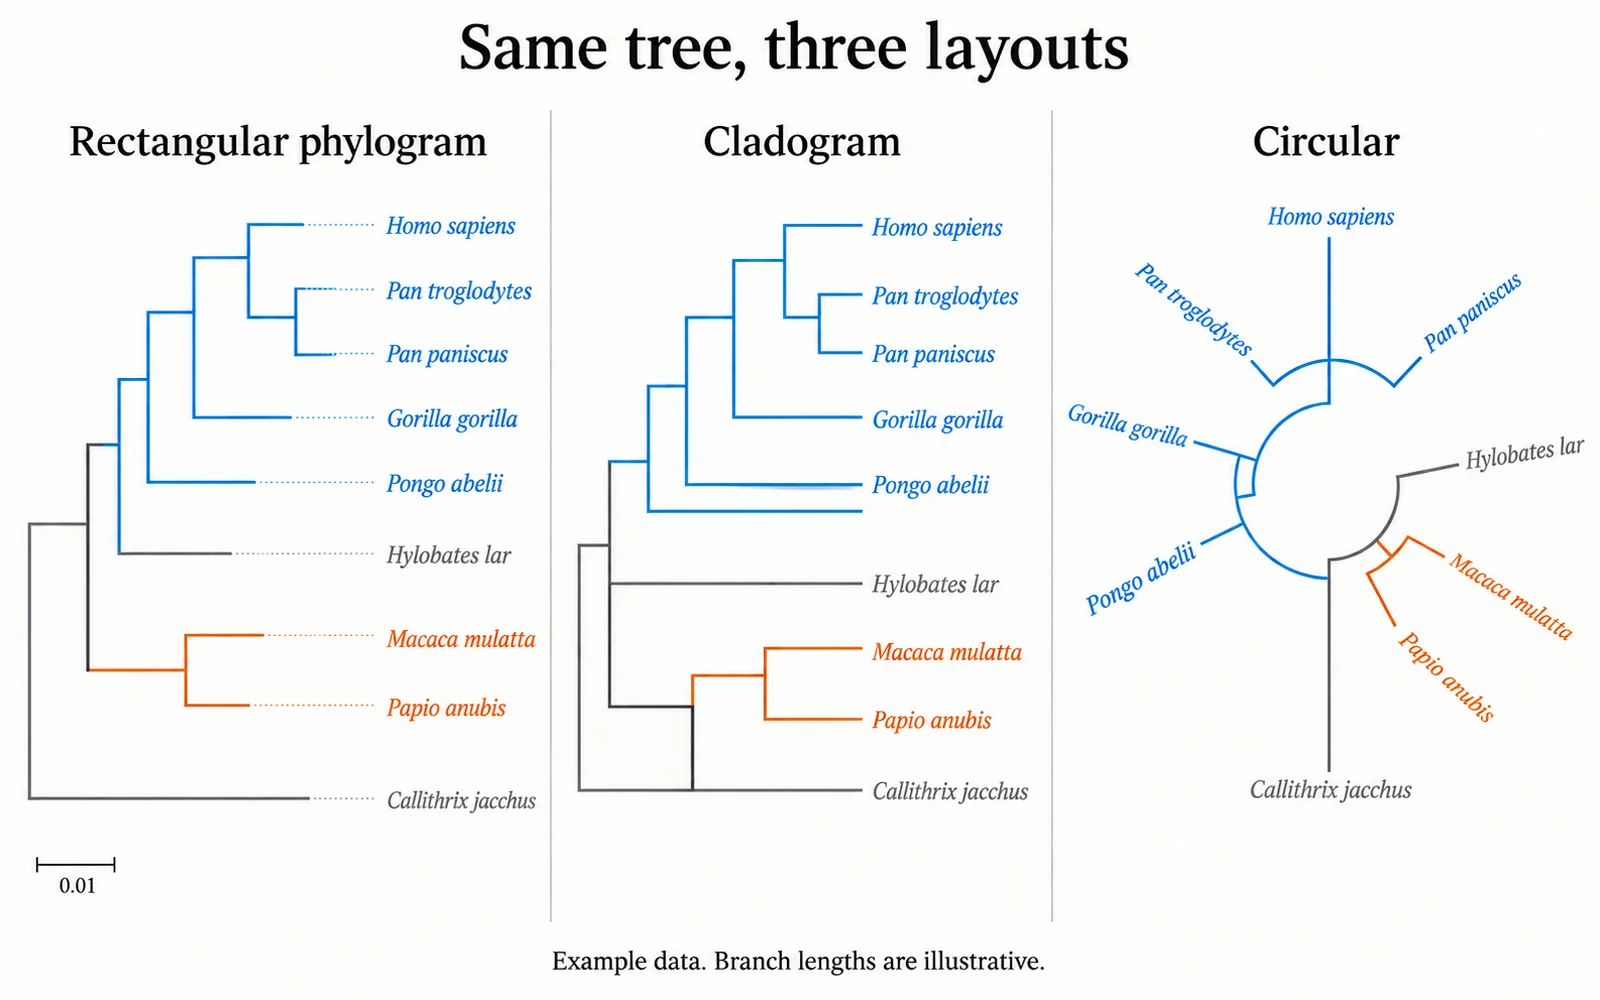
What a phylogenetic tree shows
A phylogenetic tree is a hypothesis about how sequences, species, or strains are related through common ancestry. Each part of the drawing has a specific meaning, and a good figure makes those parts easy to read.
- Tips (leaves) are the sampled taxa or sequences you analyzed.
- Internal nodes are inferred common ancestors. Everything descending from one node is a clade.
- Branch lengths, when present, usually measure expected substitutions per site, or time in a dated analysis. In a phylogram the horizontal distance carries that meaning; vertical distance means nothing.
- Support values such as bootstrap percentages or posterior probabilities describe how strongly the data back each split. They label internal branches, not tips.
- A rooted tree has a direction from an ancestor to its descendants. An unrooted tree only shows which groups are separated by each branch; many inference programs write unrooted trees with three branches at the base.
The Newick format in a minute
Newick describes a tree with nested parentheses. Each pair of parentheses is an internal node, commas separate its descendants, and a semicolon ends the tree. The parser here follows the Newick grammar documented with PHYLIP and accepts the extras that real programs write.
- Topology only: ((A,B),C); groups A and B together, with C as their sister.
- Branch lengths go after a colon: ((A:0.1,B:0.2):0.3,C:0.4); Scientific notation such as 1.5e-4 works too.
- A label after a closing parenthesis names an internal node. When it is a number, as in ((A,B)95,C); the tool reads it as a support value, on a 0 to 1 or 0 to 100 scale. Paired values such as 85/72 are shown as written.
- Underscores in unquoted names become spaces, so Homo_sapiens is drawn as Homo sapiens. Names with punctuation go in single quotes, and a quote inside a name is doubled: 'O''Brien strain'.
- Text in square brackets is a comment and is skipped, including NHX [&&NHX:...] and BEAST-style [&...] annotations. Spaces and line breaks between tokens are ignored.
- If the tree cannot be read, the error message gives the line and column of the problem, such as a missing closing parenthesis.
Phylogram, cladogram, or circular layout
Use the rectangular phylogram when branch lengths matter: branches are drawn to scale and a scale bar with a rounded length shows the units. Use the cladogram when you only want to show branching order; it ignores lengths and lines up every tip, which makes long species names easier to compare. Use the circular layout for large trees with a hundred or more tips, where a rectangular figure would be very tall. It is the same tree wrapped around a circle, with tip labels rotated and flipped so none are upside down. Ladderizing sorts clades by size, which tidies the figure without changing any relationships; switching layouts in this phylogenetic tree maker never changes the topology, only the drawing. The tool scales the drawing height with the number of tips and handles trees of around 500 tips.
Reading bootstrap and posterior support
Support values answer the question "how consistently does this split appear?" Bootstrap percentages come from re-analyzing resampled alignments; posterior probabilities come from Bayesian analyses. FastTree writes local support values between 0 and 1, and IQ-TREE can write SH-aLRT and ultrafast bootstrap values together as a pair. Use the support threshold to label only the branches that pass the cutoff your field or methods section uses, and say in the figure legend what the numbers are. A commonly reported cutoff is not a proof that a clade is real, and a low value means the data are uncertain about that split, not that the opposite grouping is supported.
Common mistakes when reading or drawing trees
- Reading tip order as relatedness. Neighboring tips are not necessarily close relatives; you can rotate any node without changing the tree. Relatedness comes from the most recent shared ancestor.
- Drawing an unrooted tree as if it were rooted. The base of a tree written with three branches is arbitrary. Root it with an outgroup in your analysis, or use midpoint rooting and say so in the legend.
- Treating a cladogram as if branch lengths were meaningful. In a cladogram the horizontal positions only show order.
- Placing support values on tips, or mixing bootstrap and posterior values without saying which is which.
- Omitting the scale bar from a phylogram, so readers cannot judge how much change a branch represents.
- Using red and green alone to mark clades. The clade colors here come from the Okabe-Ito palette, which stays distinguishable for common color vision deficiencies.
Where Newick files come from, and when to use other tree viewers
Most inference programs can give you Newick. IQ-TREE writes the maximum-likelihood tree to a .treefile, RAxML-NG writes .raxml.bestTree and support trees such as .raxml.supportFBP, FastTree prints a Newick tree, and MEGA can export trees from its Tree Explorer. BEAST tree summaries from TreeAnnotator are usually NEXUS files; this tool reads the first tree in a NEXUS TREES block, including a TRANSLATE table, but treats BEAST annotations as comments. For advanced annotation, established tools are a better fit: iTOL is an online tool for displaying and annotating trees with many dataset types, FigTree is a free desktop viewer designed for BEAST output, and ggtree is a Bioconductor package that brings ggplot2-style annotation to trees in R. Use this free phylogenetic tree generator online when you need a quick Newick tree viewer and a figure-ready export in seconds, and move to those tools when you need per-tip metadata strips, images, or scripted figures.
Frequently asked questions
Is this phylogenetic tree maker free, and is my tree uploaded?
It is free and needs no account. Parsing, layout, and export all run in your browser, so your tree never leaves your device and nothing is stored on a server.
How do I draw a phylogenetic tree from a Newick file?
To draw a phylogenetic tree from a Newick file, paste the text into the input box or open the file (.nwk, .newick, .tre, .treefile, or .txt). Pick a phylogram, cladogram, or circular layout, set the options, and export SVG or PNG. Try a preset first if you want to see the format.
Can I use it as a cladogram maker for trees without branch lengths?
Yes. Topology-only Newick such as ((A,B),C); is drawn as a cladogram with aligned tips. If a tree has branch lengths, choose Cladogram to ignore them.
What does midpoint rooting do?
It finds the longest path between any two tips and places the root halfway along it. This is a reasonable default when you have no outgroup and rates are roughly similar across lineages, but it is an assumption; mention it in your figure legend.
How do I highlight a clade?
Click or press Enter on an internal node in the tree, or type tip names separated by commas. The tool colors every branch and tip label in the smallest clade that contains those tips, using colorblind-safe Okabe-Ito colors with HEX codes shown.
Is the exported figure good enough for a paper or poster?
SVG keeps lines and text as vectors you can edit in Illustrator or Inkscape. PNG exports at 2× or 4× scale for slides and posters. Check your journal's figure requirements, and state what the support values and scale bar represent in the legend.
Related tools
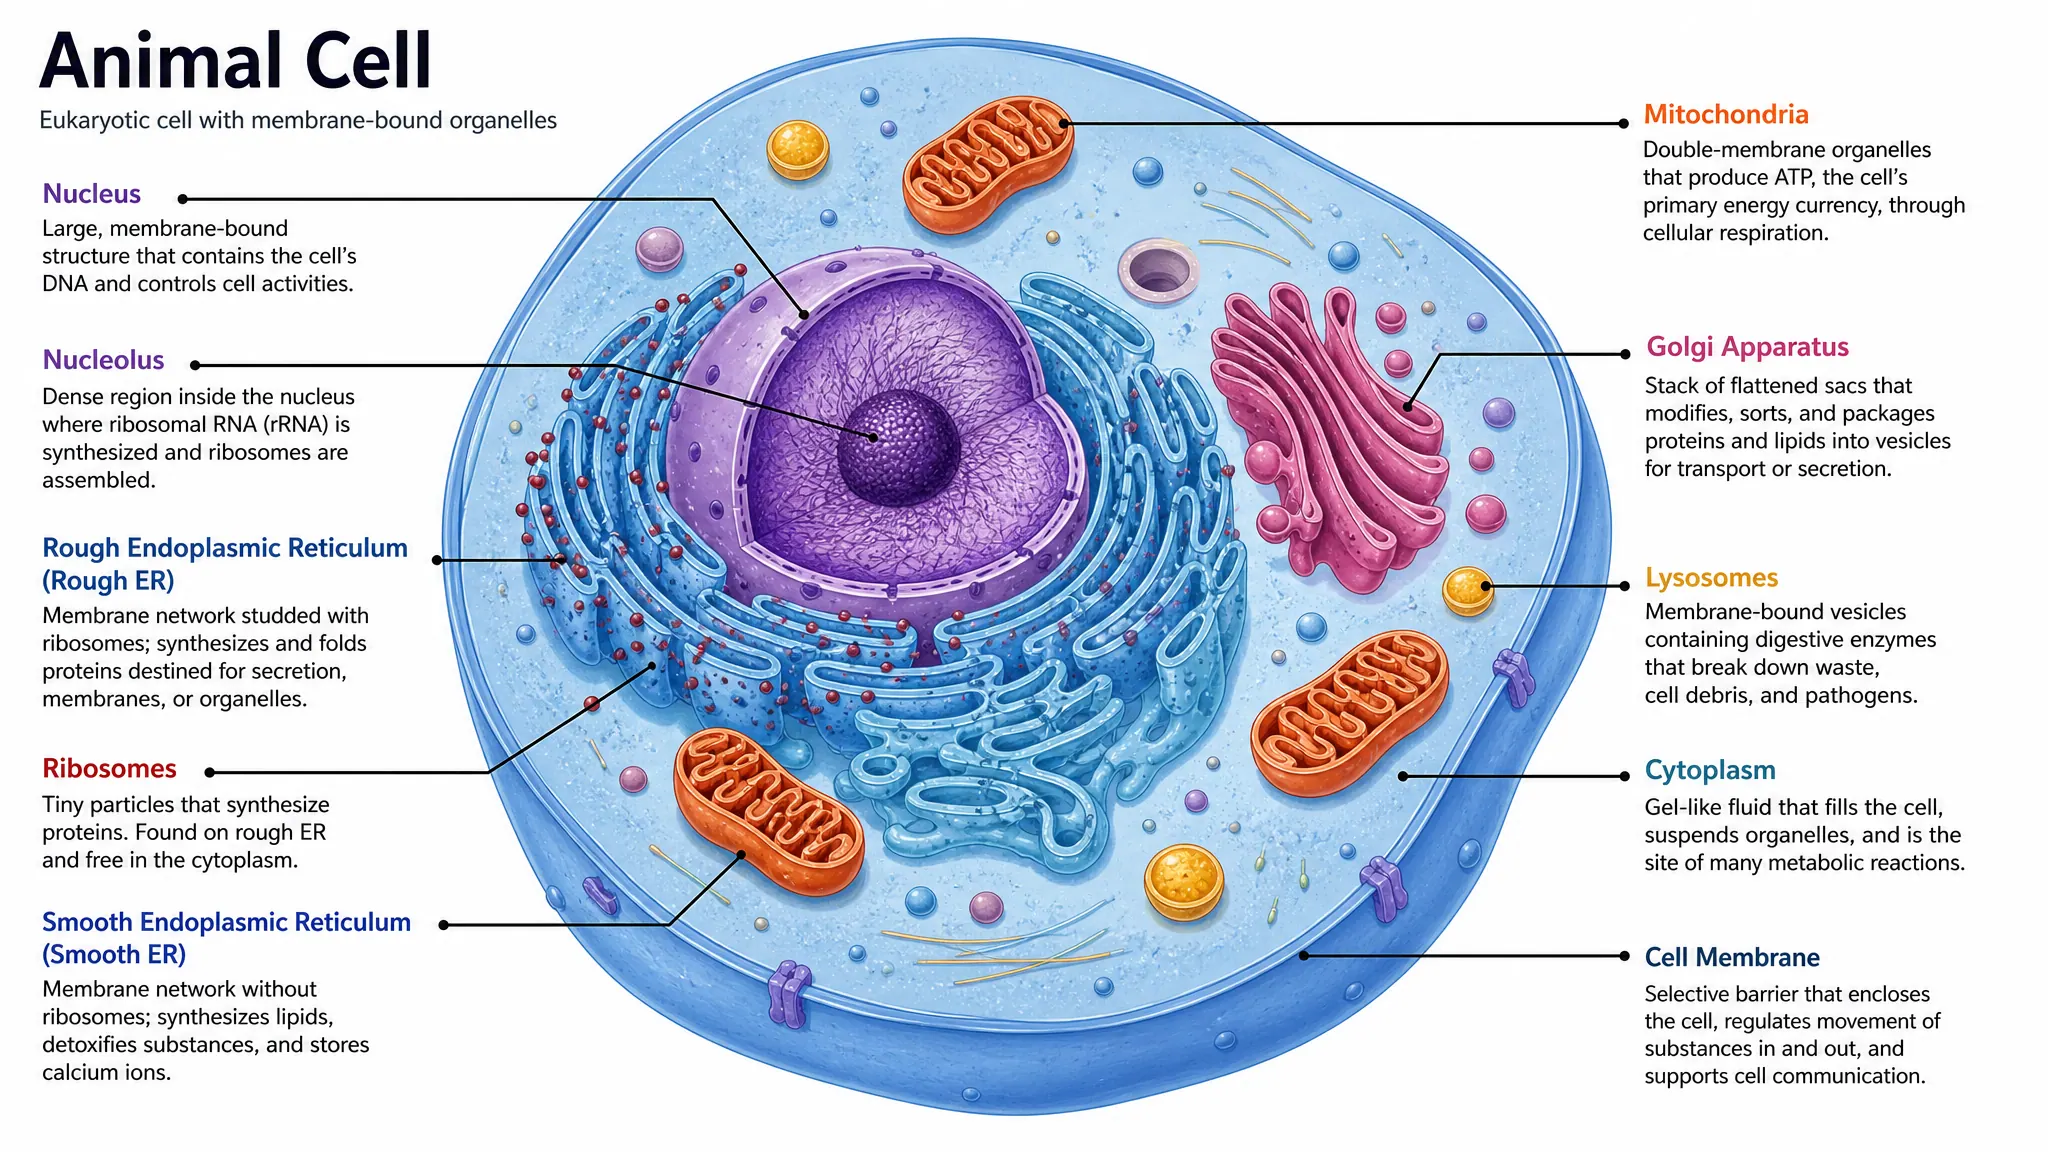
Biology diagram maker
Create labeled biology diagrams for teaching, papers, and posters.

Cell diagram generator
Generate labeled cell diagrams in a clean scientific style.
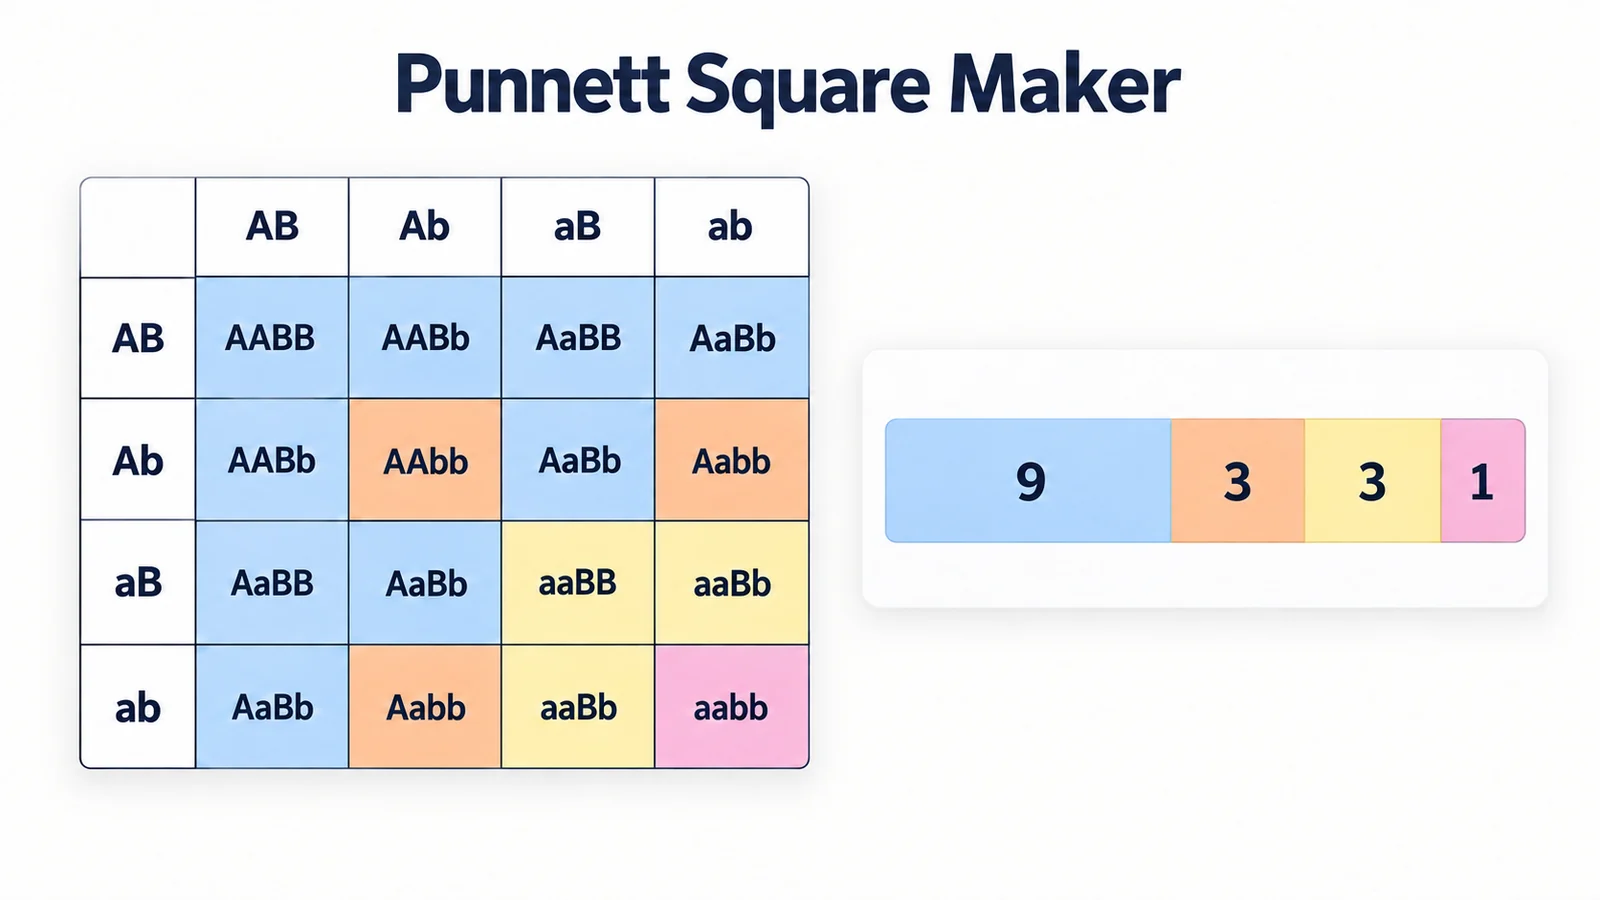
Punnett square maker
Build monohybrid, dihybrid, and sex-linked Punnett squares with genotype and phenotype ratios.
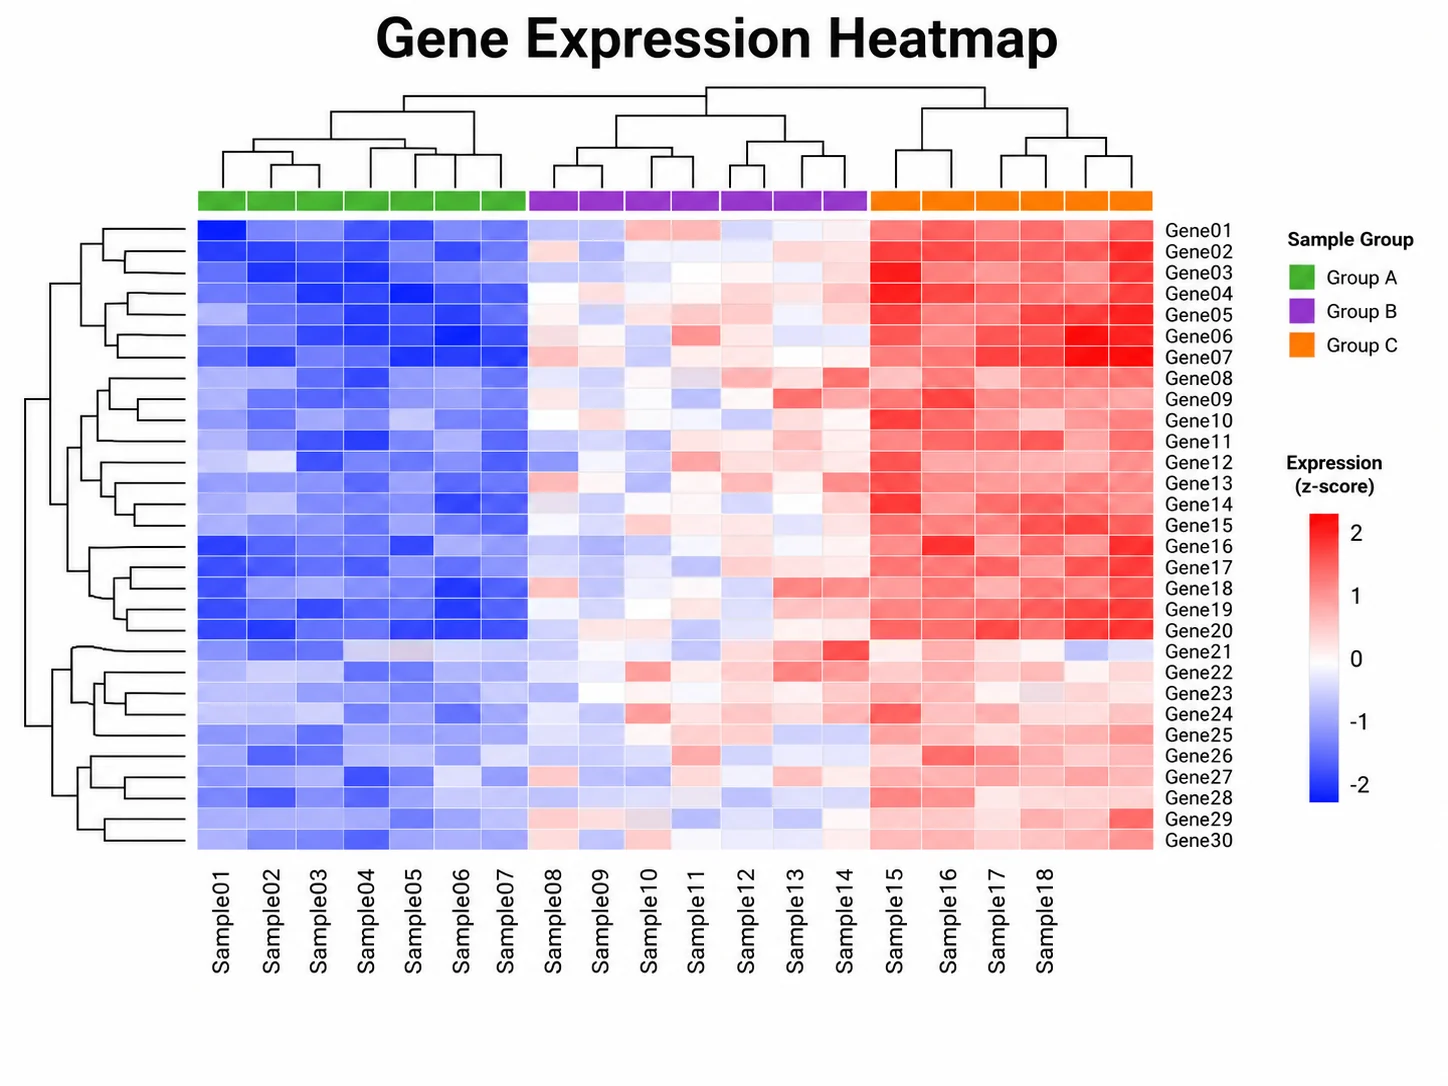
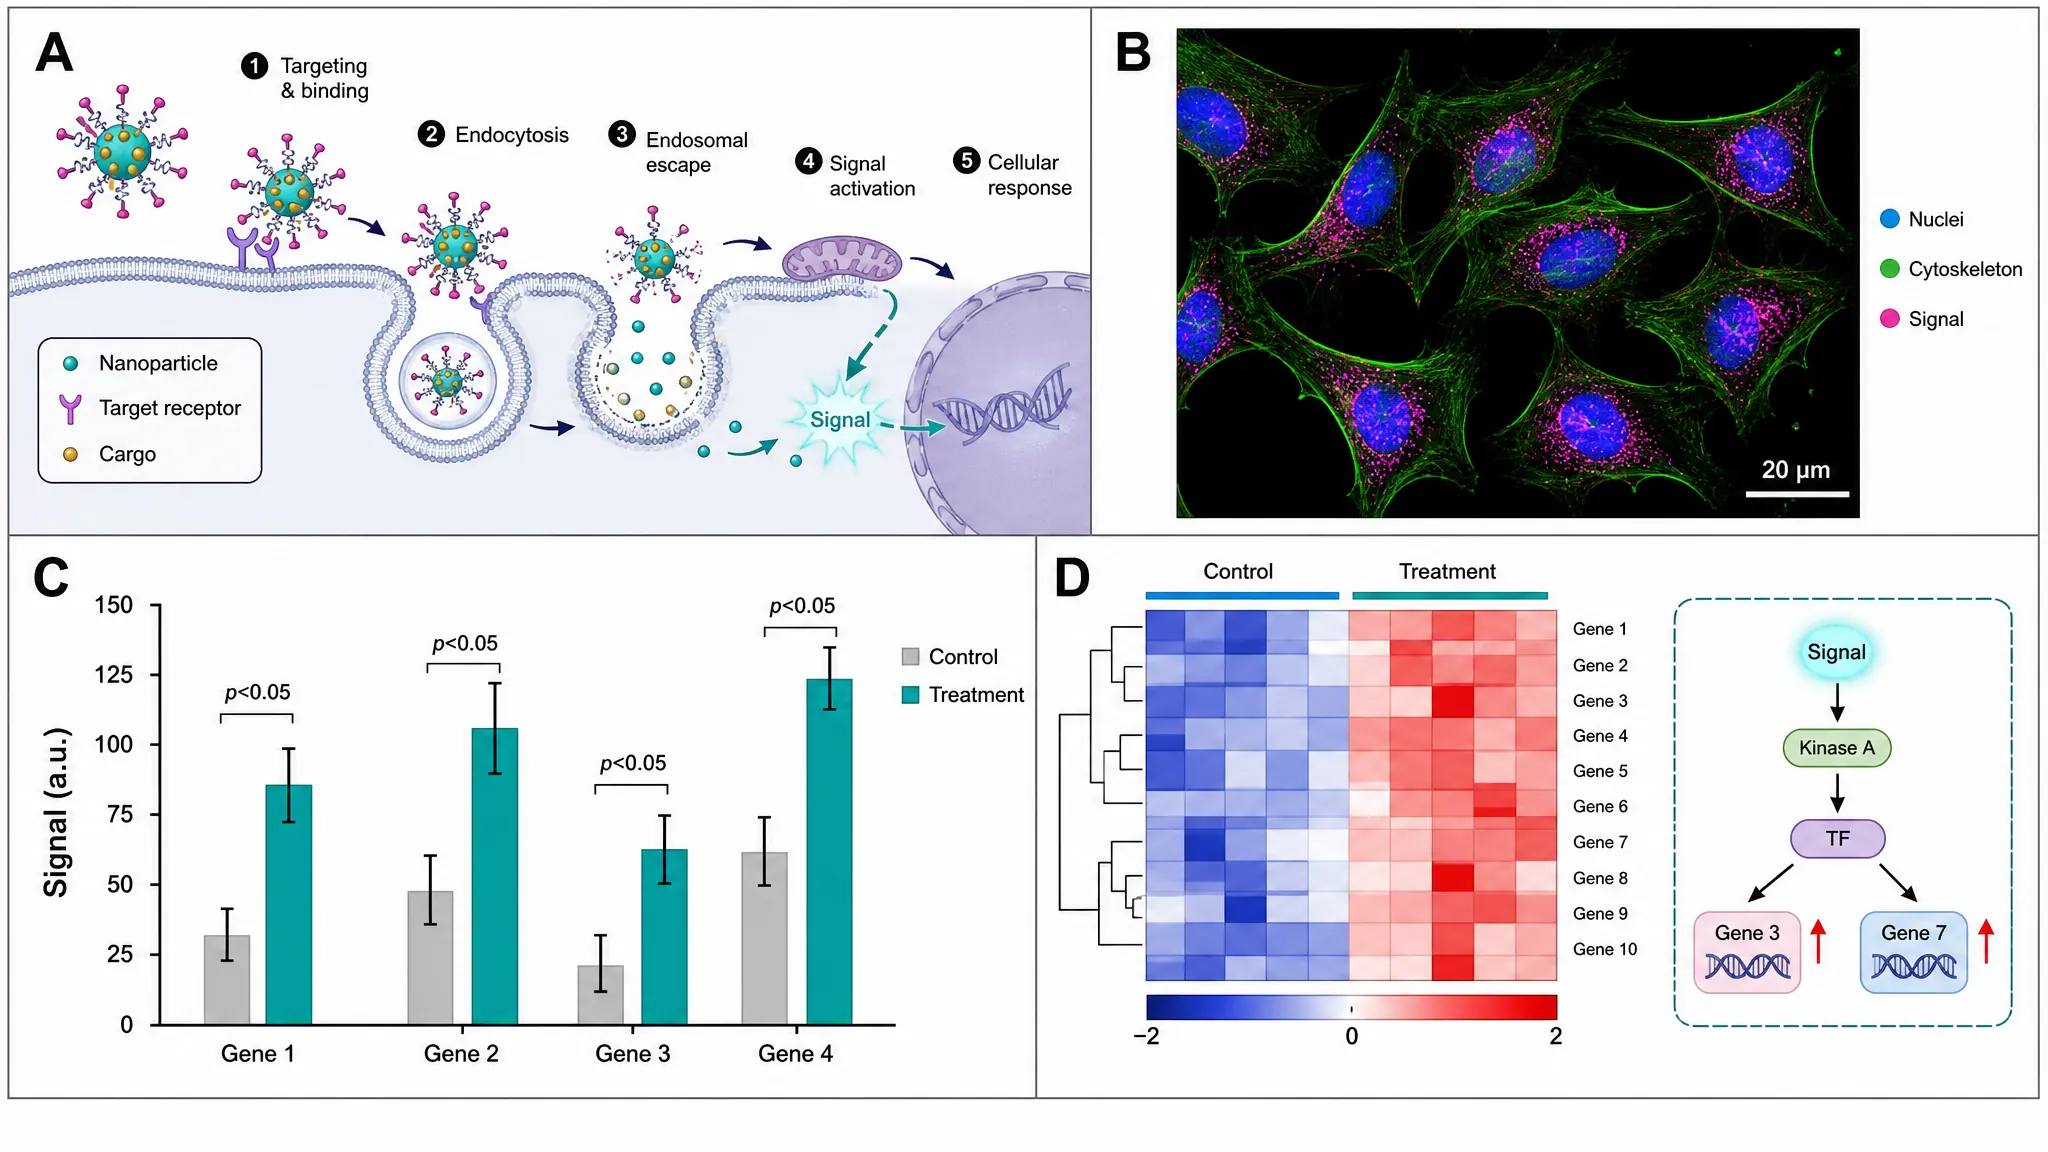
Heatmap generator
Turn a CSV or Excel matrix, such as gene presence or expression per taxon, into a heatmap.
All free tools
Browse every SciFigure figure tool and generator.
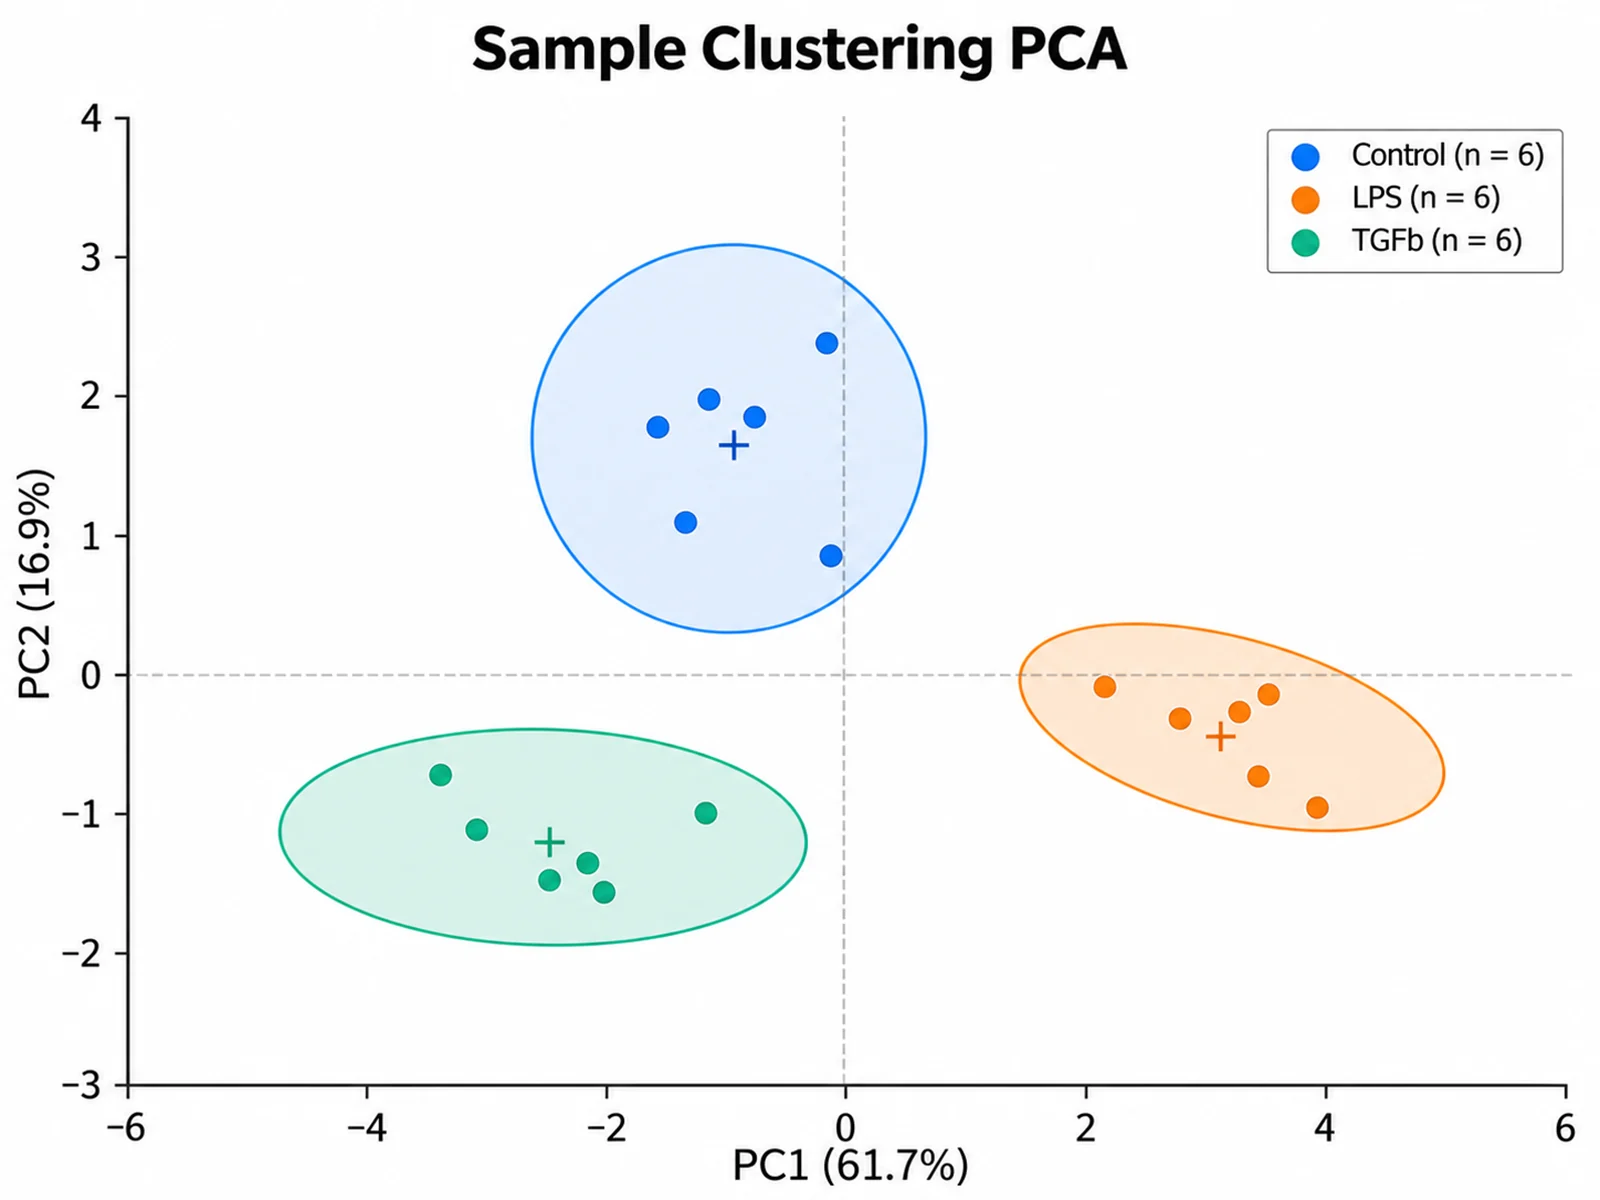
PCA plot generator
Project samples onto PC1 and PC2 to compare population structure.
Pair your tree with a data figure
Trees often sit next to a heatmap of traits, genes, or abundances. Upload a CSV or Excel file to the SciFigure heatmap generator: charts cost 5 credits each, and new accounts get 10 free credits.
Open the heatmap generatorLast checked: September 15, 2026. Sources: Newick format (PHYLIP); Newick grammar (PHYLIP); IQ-TREE tutorial; RAxML-NG tutorial; FastTree; MEGA Tree Explorer File menu; BEAST TreeAnnotator; iTOL; FigTree; ggtree (Bioconductor).